
The first quarter of 2026 is complete now and it’s time to take a look at how sales volume and median prices compare month to month and year over year. Typically the number of homes closing escrow picks up as the holiday season passes and spring arrives. The median price, on the other hand, seems to depend on ever more factors with each following year.

Month to Month
As usual, January was even slower than December with a 35% drop in the number of sales recorded. This year February, with 20% more sales than January, was a little slower than usual. In an unexpected showing of strength, March has made up for some of the decline during the weak winter months, posting a 49% increase over February.
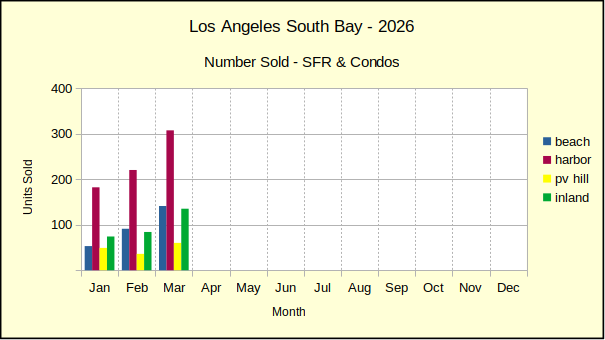
Sales volume was up across the South Bay, with the PV Hill and the Inland area posting the highest monthly increases at 67% and 61%, respectively. The Beach area came in third with a 55% growth in sales, followed by the Harbor area at a 40% increase in sales

Monthly median prices stumbled again in March, becoming increasing flat. On the negative, there was a 4% drop in median price for the Inland area. Closing prices on the Palos Verdes Peninsula barely made the mark posting a 1% increase over the February median. The other two areas were positive, though the increases were so small they registered as zero in the charts. The wars in West Asia may be having a short term effect. On the other hand, the slowdown in median prices may be the beginning of price corrections.
Year to Year
The year over year perspective came with a more nuanced set of numbers and some surprises. As a whole, sales volume in the South Bay ranged from a 16% decline in home sales for January to a 19% decline in sales for February, before reversing course with a 20% jump up in March. Those March increases ranged from 17% in the Beach Cities to 21% at the Harbor. All good, solid increases in the number of homes sold.

The most dramatic shifting came in comparing median prices this year to last year. The Beach area has suffered the greatest swings. After struggling in January with a 29% decline in median price, followed by a mere 1% increase in February, the Beach area claimed a 10% increase in the March median.
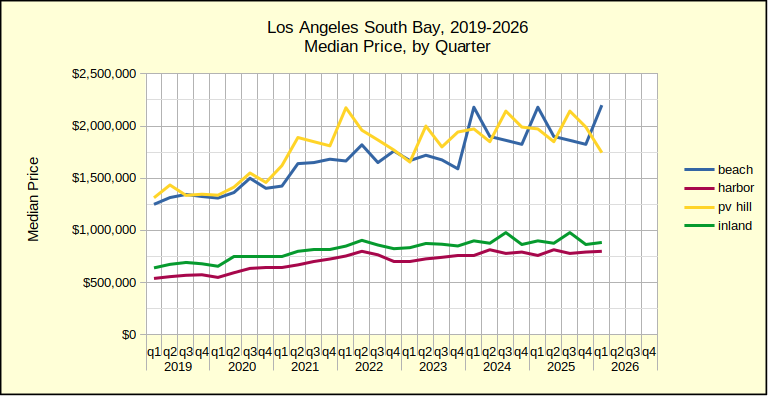
The Beach was the only growth area for median price. The Harbor area fell from a solid 5% increase for both January and February to a 0% negative in March. At the same time, the PV Hill showed a 12% drop in pricing and the Inland area fell by 3%.
The statistics tend to support the price correction theory. As the quarter has progressed, median sales prices have slipped below the highs of last year at least once in all the areas.
Year to Date
In summary, the first quarter of 2026 has been markedly less positive for real estate in the South Bay than in 2025.
Overall sales volume has dropped 4%. Declines ranged from 3% at the Beach to an 8% drop at the Harbor. The PV Hill was the only area trending positive, with a 13% increase in the number of homes sold. As always, one must consider the caveat of sample size. Because the volume of business on the Hill is comparatively tiny, small moves can look dramatic.

Median prices for the first quarter are also significantly down from 2025. The Inland area dropped 2% while the Hill fell by 12%. The Beach cities eked out a 1% increase and the Harbor area showed a solid 5% increase in the median. This is a distinct shift from what has been happening in recent years. The Beach cities have been the predominant leaders in median price apprectiation, leaving the Harbor and Inland areas behind.
Stats for Nerds
Beach:
M-m, vol: 141, 55%, med: 2,200,000, 0%
y-y, vol: 17%, med: 10%
ytd, vol: -3%, -10% from 2019, med: -1%, up 76% from 2019
Harbor:
M-m, vol: 307, 40%, med: 800,000, 0%
y-y, vol: 21%, med: -0%
ytd, vol: -8%, -20% from 2019, med: 5%, up 33% from 2019
Hill:
M-m, vol: 60, 67%, med: 1,744,932, 1%
y-y, vol: 20%, med: -12%
ytd, vol: 13%, 1% from 2019, med: -12%, up 33% from 2019
Inland:
M-m, vol: 135, 61%, med: 885,000, -4%
y-y, vol: 18%, med: -3%
ytd, vol: -4, -10% from 2019, med: -2%, up 38% from 2019
Beach=Manhattan Beach, Hermosa Beach, Redondo Beach, El Segundo
Harbor=Carson, Long Beach, San Pedro, Wilmington, Harbor City
PV Hill=Palos Verdes Estates, Rancho Palos Verdes, Rolling Hills, Rolling Hills Estates
Inland=Torrance, Lomita, Gardena
Photo by Ameer Basheer on Unsplash