2026 Year-to-Date vs 2025
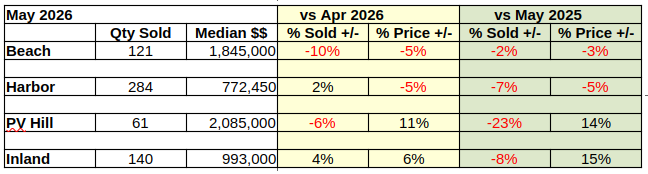
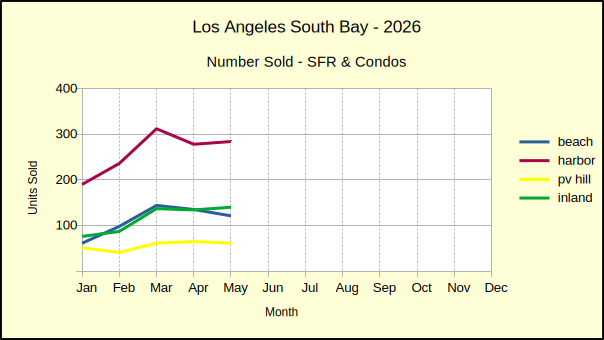
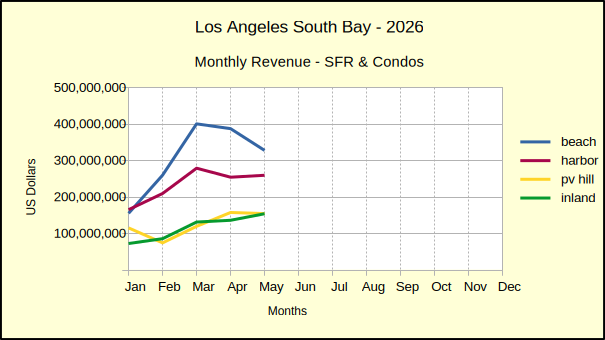
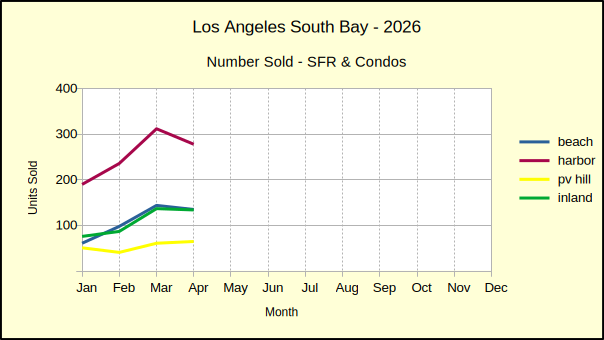
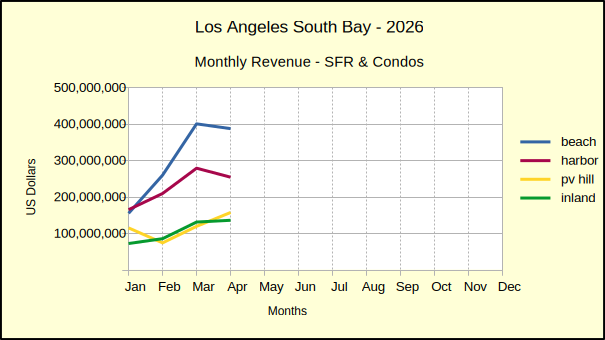
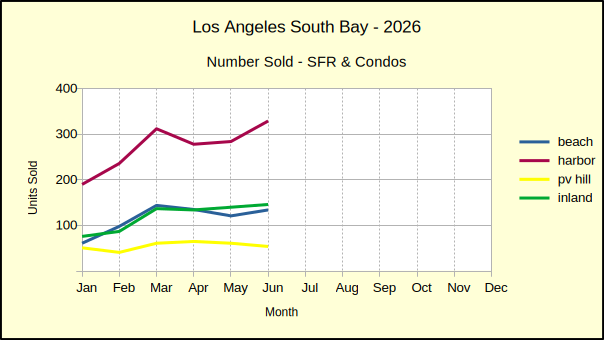
Half way through the year, June brought a 5% drop in year-to-date sales for the Los Angeles South Bay residential market. Only in the Beach area did sales exceed the first six months of 2025. With 693 homes sold at the Beach in the first half of 2026, compared to 653 for the same period in 2025, sales were up 6%, in comparison to the South Bay as a whole.
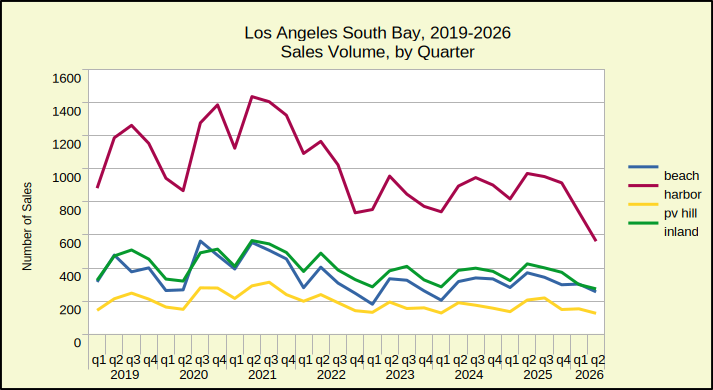
While the Beach was enjoying a year-to-date improvement, Harbor area sales volume dropped 10%, falling from 1790 homes last year to 1629 this year. In the same time frame, sales volume on the PV Peninsula declined from 342 properties sold in 2025 to 333 in 2026, for a 3% fall. Running a very similar decline of 4%, the Inland area fell from 749 to 720 sales.
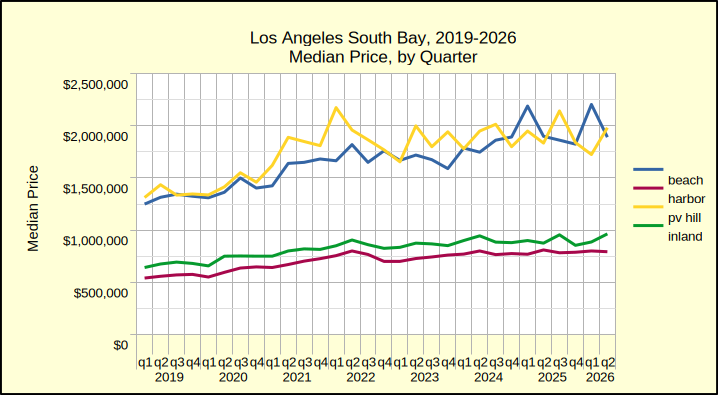
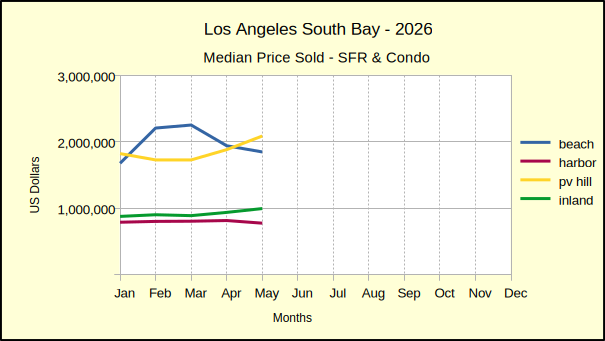
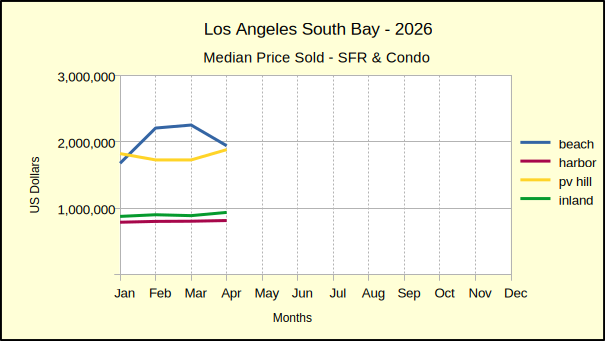
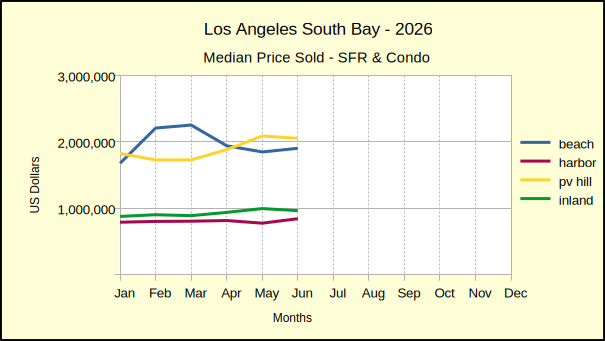
Comparing median prices from the first half of 2025 to the first half of 2026 the Beach came in with a 5% drop. It was closely followed by the Hill which fell by 3%. Both the Harbor and the Inland areas continued to show growth in the median price, with the Harbor at 1% and the Inland area at 3%.
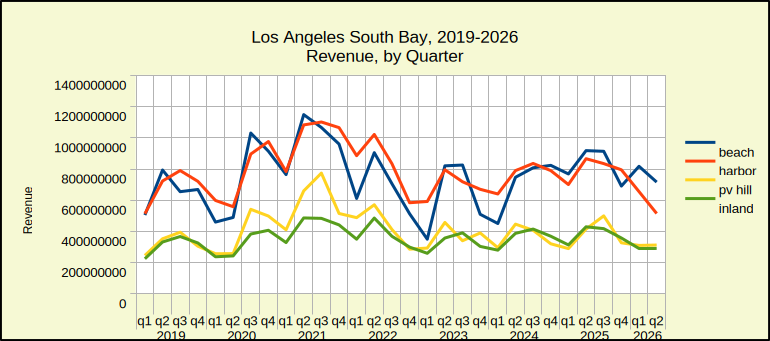
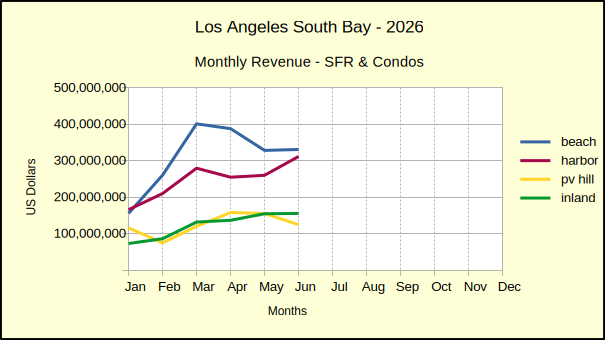
The Harbor and Inland areas are the largest market areas, easily surpassing the sales volume of the Beach and Hill. At the same time they sell for prices that average significantly less than their counterparts.
The Outlook
Anecdotally, sales volume and median price have an inverse relationship. When the number of home sales in an area falls repeatedly, it’s an indication the median prices will soon be falling. With the exception of the Beach cities, year-to-date, the region showed declining sales volume.
For the same six months, the median price has continued to fall at the Beach and on the Hill. The Harbor area has managed to stay on a growth path. The Inland area has, as well, but has seen a lot of negative price movement with three of the six months at or below zero.
The first half the year already shows declining sales and declining median prices, It seems safe to assume the second half will continue along the path. However, inflation is pushing interest rates, even while war is driving more inflation. Buyers are challenged to qualify at new rates causing inventory to continue growing. More and more often, sellers find it necessary to lower prices as life changes force them to move.
At least in the short term one can expect further slippage in sales volume, including the premium neighborhoods which often escape slow markets. That slowdown in sales would normally feed a lagging decline in median price. This year that decline seems to be sputtering. The two largest markets, the Harbor and Inland areas, respectively saw 10% and 4% declines in sales year over year. In the same half year they both maintained a 1% and 3% increase in median price.
If the inflation rate, currently at 3.5% goes up to 4.25% as predicted for July, and ends the year at 4% per predictions, one can readily assume a smaller number of qualified buyers for local area homes. The natural consequence is a further decrease in sales volume. The median price will be impacted. When sellers must sell, the prices will drop, or the owner will convert it to a lease and it will leave the market.
At this point, about the best one can do is wish the Fed good luck with controlling interest rates.
Stats for the Detail Minded
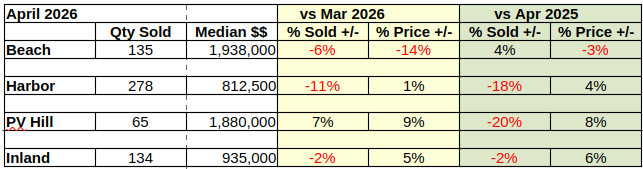
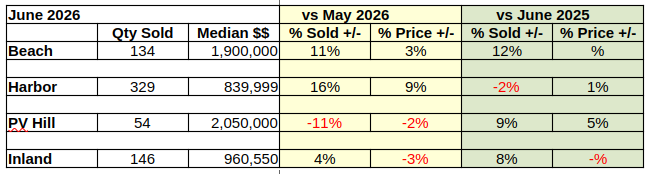
Beach:
M-m, vol: 134, 11% med: 1,900,000, 3%
y-y, vol: 12%, med: 0%
ytd, vol: 6%, med: -5%
vs 2019: vol: -13%, med: 50%
Harbor:
M-m, vol: 329, 16% med: 839,999, 9%
y-y, vol: -2%, med: 1%
ytd, vol: -10%, med: 1%
vs 2019: vol: -21%, med: 47%
Hill:
M-m, vol: 54, -11% med: 2,050,000, -2%
y-y, vol: 9%, med: 5%
ytd, vol: -3%, med: -3%
vs 2019: vol: -7%, med: 39%
Inland:
M-m, vol: 146, 4%, med: 960,550, -3%
y-y, vol: 4%, med: -0%
ytd, vol: -4%, med: 3%
vs 2019: vol: -10%, med: 41%
Beach=Manhattan Beach, Hermosa Beach, Redondo Beach, El Segundo
Harbor=Carson, Long Beach, San Pedro, Wilmington, Harbor City
PV Hill=Palos Verdes Estates, Rancho Palos Verdes, Rolling Hills, Rolling Hills Estates
Inland=Torrance, Lomita, Gardena
Photo by