Before we start, let’s be clear about the time frame of the business we’re discussing. I say that because it’s easy to forget the sales closures we are discussing for January are for deals cut in December, or possibly late November. The average escrow time is still 30-45 days. That helps to explain the timing of some shifts in the raw numbers. Because fewer deals are cut in the time frame from Thansgiving to the New Year, traditionally the holiday season, it takes only a few more deals, or a few less dollars, to shift the percentages dramatically in January. Given those qualifications, let’s look at the statistics for January in the South Bay.
It’s not unusual for January real estate sales to be fewer than December, though the numbers have been stabilizing since the end of the pandemic. January of 2025 was only down 17% across the South Bay from January 2024. The year before, January of 2024, sales were off 24% from 2023, and the year before was down 28% from the 2022 sales. The surprise is in 2026 starting the year with an out-size 35% decline from December of 2025. (See the area break down below for details.)
The jump from a years long trail of improving numbers to a 35% drop in month to month sales volume, especially when spread relatively equally across the four areas, draws attention. R emember the Hill is the smallest of the areas and just because of the nature of mathematics it has wide percentile swings.
As you see, our month to month sales volume has dropped significantly across the South Bay, and has made a significant drop from the historical upward trend, as noted above.
Monthly median prices have also dropped in the Beach and PV Hill areas, both typically more volatile in response to economic markets. The Harbor and Inland areas, on the other hand have shown modest growth in median value from December into January. Could it be we are seeing a shift in valuation, from the flashy high end properties to bread and butter properties?
Year over year prices seem to be down across the South Bay with the exception of the Harbor area, a surprise for the largest market area of the South Bay. A 5% increase in the median price the for largest volume area in the south Bay is a huge stop sign on the path to market.
Sales are down everywhere except the Hill which represents a mere 14% of the month’s sales. It’s easy to say three out of four markers indicate slower business for the coming year.
In the past the format of the newsletter would go on to discuss details of each of the market areas. We’re going to change that a bit starting this month. Rather than a textual description, we’re including just the statistics for each area. If you, as the reader, have additional questions, just give us a call and we’ll walk through the numbers with you.
In addition, we’ll be including charts, showing the shifting business as the months go by. Please let us know if you like the transition to less words and more pictures.
Beach:
M-m, vol: 53, -41%, med: 1,675,000, -8%
y-y, vol: -17%, med: -29%
ytd, vol: -17%,, med: -29%, ytd vs 2019: vol -97%; med 23%
Harbor:
M-m, vol: 182, -39%, med: 795,000, 2%
y-y, vol: -25%, med: 5% Is the Harbor shifting? Or just a shortage of inventory?
ytd, vol: -25%,, med: 5%, ytd vs 2019: vol -96%; med 31%
Hill:
M-m, vol: 49, 9%, med: 1,820,000, -9%
y-y, vol: 53%, med: -4%
ytd, vol: 53%,, med: -4%, ytd vs 2019: vol -94%; med 25%
Inland:
M-m, vol: 74, -36%, med: 875,000, 4%
y-y, vol: -15%, med: -3%
ytd, vol: -15%,, med: -3%, ytd vs 2019: vol -96%; med 18%
Beach=Manhattan Beach, Hermosa Beach, Redondo Beach, El Segundo Harbor=Carson, Long Beach, San Pedro, Wilmington, Harbor City PV Hill=Palos Verdes Estates, Rancho Palos Verdes, Rolling Hills, Rolling Hills Estates Inland=Torrance, Lomita, Gardena
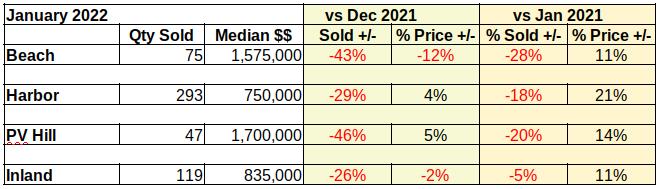
January 2022 showed a different face than we were seeing all last year. Of course, in many respects that’s a good thing. Depending on whether you’re buying or selling, the real estate market for 2022 could be wonderful or horrible. As always, the location will make an even bigger difference.
Sales Volume Dropping
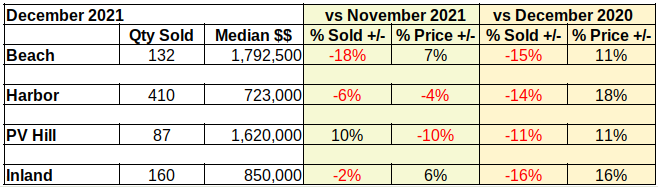
Check out all the red ink in the table below. Compared to December, sales volume is down by nearly 50% at the Beach and on the Hill. November and December of 2021 were heavy with transactions spurred on by the fear of increasing interest rates. The number of homes sold in comparison to January of last year also dropped, though not to as great an extent.
Sales volume down, prices up
As of right now interest rates are expected to hover in the 3.5% to 4% range for the balance of the year. The increase from under 3% to roughly 3.5% has served to lock a substantial portion of entry level buyers into the rental pool. Those who found a place and could afford to buy last year did. The first part of this year is expected to continue to show declining sales volume as many first time buyers drop out of the purchasing market.
Prices Starting to Reverse Direction
Prices meanwhile are faltering in the unsustainable march upward. As the table above shows, the Beach and the Inland areas have already begun declines in the median price. Simultaneously buyers in the Harbor and Palos Verdes communities have continued pushing purchase prices higher, though not nearly as fast as last year.
We expect price corrections in all four areas as the year rolls out. Initially, we anticipate buyers in the Inland and Harbor areas to balk at the combination of higher interest rates and historically higher prices. Lower priced homes are traditionally impacted sooner and to a greater degree by changes in mortgage interest.
Homes on the Palos Verdes Peninsula and in the Beach communities of the South Bay are expected to also experience price declines as the market adjusts to the new reality of higher prices, steeper interest rates and the shrinking impact of Covid.
The Covid Connection
Covid wreaked havoc with social lives, business practices and just about every other aspect of society. When the pandemic struck in 2020 the real estate world was already heated because of low interest rates. Unfortunately, protecting society from Covid meant slowing down much of the business world, including real estate transactions. For months agents were dealing with masks, alcohol gel and the task of wiping every surface touched by potential buyers. And the buyers kept coming because the interest rates made buying a home affordable for many.
By the time 2021 started, the industry had found ways to show property and ways to consummate paperwork with relative safety from Covid. Keeping one eye on the mortgage interest rate, the buying public responded promptly. It was one of the busiest years ever for brokers and agents. As the year ended and lenders continued raising the cost of purchase loans, buyers started showing signs of stress.
January appears to have been the fulcrum point for a shift in market dynamics. The people involved are more than ready for relief from Covid. Bidding wars have all but ended. Price reductions are coming after only a few weeks on the market. The State has declared Covid “endemic.” Essentially we’re ready for normal business.
The first month of the year has pointed in the direction of a slowing market, with some pricing shifts to compensate for over-exuberant purchases in the close out of 2021. We anticipate February to show more of the same. We’ll be back soon with charts comparing the monthly progress. (You’ll find the beginning charts for 2022 at the bottom. Not real exciting without data to compare.)
The High Sale and the Low Sale
We’ve had requests for a little “human interest” added to the dry statistics we throw out here every month. We’re going to try to do that while still maintaining privacy for the people involved. Let us know how we’re doing.
For example, an observation we made this past month was the highest sale versus the lowest sale as reported by TheMLS for January. Those of you who follow us know the Beach areas are invariably at the top of the chart, so you won’t be surprised to find that the highest sale in January was in the Manhattan Beach hill section. New in 2021, this expansive 6 bed, 6.5 bath home sold for $6.5M. At nearly 6500 square feet, that’s over $1,000 per sq ft.
It’s far from the highest price we’ve seen there, but that piqued our curiousity. So we looked to the other end and found the lowest January sale in our part of the South Bay. Down from 6500 sq ft to 400 sq ft, and from $6.5M to $255K, this studio condo in Long Beach calculates out to a hair over $600 per sq ft. In other words, about 60% of the cost to build new construction in Manhattan Beach.
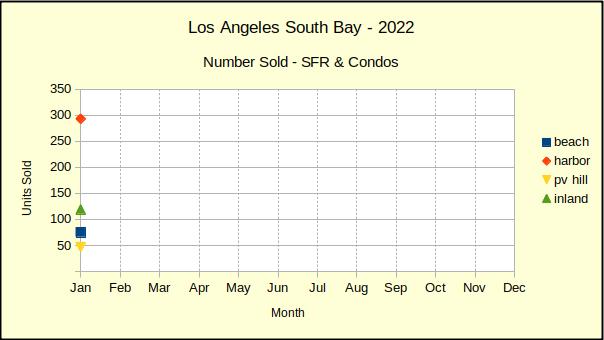
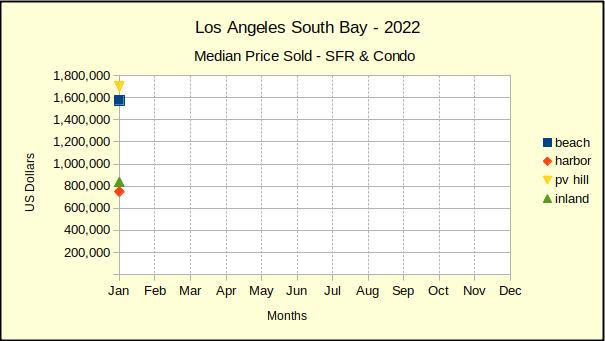
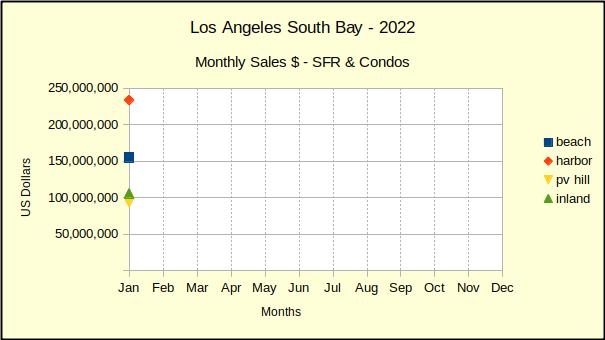
2022 Charts – The Beginning Point
The first chart of the year is less than exciting. We’ve included them here for reference. In March, when we can compare January to February and we can be confident we are past the bulk of the pandemic, these should be much more interesting and informative.
2021 was a year of tears for many people. But, not so for most South Bay property owners. Briefly, median sales prices across the area increased between 9% (the Inland areas) and 24% (on the Hill). Those are incredibly large increases. To put it in perspective, the median price increase the previous year, 2020, was less than half that, ranging from 4% (at the beach) to 9% (Hill and Inland).
Similarly, the year over prior year sales volume for 2021 was up in a range from 18% (harbor area) to 22% (beach and hill). This compared to a range from decline of 6% (inland area) to an increase of 7% (hill) for 2020.
Along with median sales value increasing and number of units sold increasing, we also saw astronomical increases in total sales dollars for the year. The change from 2020 to 2021 ranged from 33% (harbor) to 52% (hill). That compared to a range from 2% (inland) to 20% (hill) for the transition from 2019 to 2020.
These huge percentages are uncomfortably like the years 2006 and 2007 leading up to the Great Recession. It’s highly unlikely that 2022 will continue at this pace. We anticipate the year starting out with listings priced on the high end, with subsequent price reductions as “distressed” properties come on the market with more appealing prices.
So called “distressed” properties include those which have been hidden from the market by the Covid-inspired moratorium on foreclosures and evictions. Now that lenders are allowed to process foreclosures, we are beginning to see properties come on the market as “pre-foreclosure.” Here in the South Bay we have yet to see any significant number of bank-owned property come on the market, though at least ten distressed homes have been listed in the past three months in Los Angeles county.
In the end, most real estate sales involve a family home where buying or selling is dictated by events beyond the property owner’s control rather than by market trends. Births, deaths and new employment top the list of reasons for transactions that will happen regardless of market conditions. If you anticipate a need to sell in the next few months, we recommend you consult with your broker/agent early. Ask about marketing or negotiating techniques that will deliver the best result in a slowing market given your circumstances.
Year-End Housing Sales Drop
Regular readers will recognize that we’ve been seeing the sales volume declining for a couple months now. On the one hand, it’s understandable because we report actual sales results, as opposed to seasonally adjusted results. Being the winter season, sales are slower.
On the other hand, nearly everyone has been ignoring the white elephant in the marketplace. Let’s face it, prices have gone up dramatically, the interest rate is climbing at a quickening pace, and inflation is on the rise. Combined, those factors foretell fewer qualified buyers, more inventory on the market and some pullback on the recent price increases. We’ll talk more about that next month when we take a first look at real estate in 2022. If you’re about to make a move and need information sooner, give us a call.
Sales quantity fell off from the November numbers everywhere except in the Palos Verdes area. There we found a healthy 10% increase in activity for December. (With a hundred or fewer units sold in any given month, statistics related to sales volume on the Hill can have some wild variations.) Sales rose by 10% from last month, but fell 11% from last year.
Harbor area sales slowed the most in the South Bay. Of course, sales there and in the Inland cities had increased dramatically early in the year. The confluence of low interest rates threatening to go up, with burgeoning demand from first time buyers, drove sales numbers all year. As the mortgage interest rate passed three percent, many of those first timers fell out of the market.
Year-End Median Prices Mixed
Palos Verdes homes brought in 24% more in median prices last year than the year before, which was 9% above 2019. Most of the 2021 increase came in the first three months of the year. Prices were stable for the summer before dropping in the fall. At the same time, Beach homes went up 19% in 2021, compared to a 4% increase in 2020 over 2019. Much the same in the Harbor area, median prices doubled, up 15% over 2020, compared to 7% above 2019.
In an interesting anomaly, prices in the Inland increased 9% over last year, which was 9% above 2019. It seems the purchasing mania and bidding wars didn’t have as much impact to Inland areas.
By mid-year all areas had seen one or two months of declining median prices on a month-to-month basis. As the year wore on, the “down” months grew and the “up” months shrank. Despite the year-over-year median price being up, three out of the final six months of the year saw declining median prices in all areas.
On a month over month basis, selling prices on the Hill were the most impacted in December, dropping 10% from November. Harbor area homes fell by 4%, while Inland property values were up 6% and homes at the Beach grew 7%.
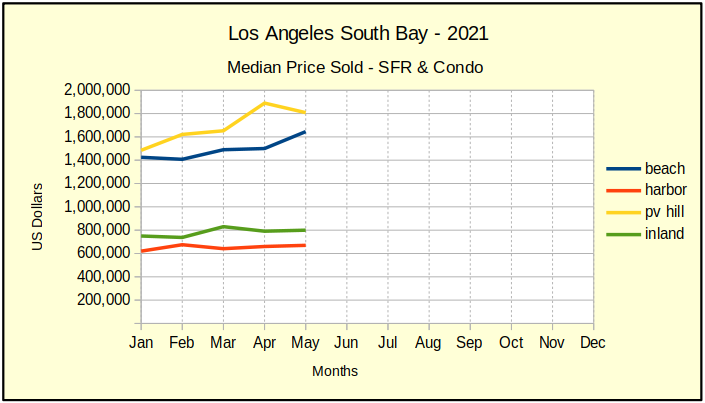
The Beach areas enjoyed significant appreciation in 2021. Prices at the Beach started the year at just over $1.4M, moved quickly up to $1.7M in August, then lost $150K of those gains before springing up to close the year out at a median price of nearly $1.8M.
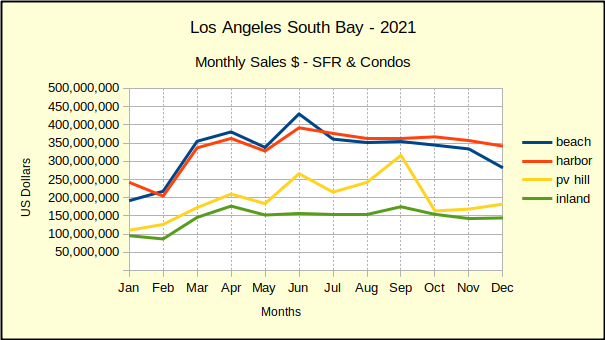
Year-End Total Sales Dollars
The total dollar value of all the homes sold in the South Bay in a given month or year is probably only useful to investors or economists. At the same time it can be instructive by way of demostrating market direction. For example, let’s look to total sales on a monthly basis.
In total dollars South Bay homes sales for 2021 were up 38% from 2020 sales. That compares to a 10% increase from 2019 to 2020. Looking at individual months, the bulk of that revenue increase happened between January and July. By August the 2020 to 2021 increases had slowed to single digits. By December, the Beach and Inland areas were already seeing monthly declines compared to 2020.
The December year-to-year decline in total sales dollars was only 5% at the Beach but compare that to an increase of 156% in April. The Inland areas dropped 3% for the same period, compared to a 159% increase in sales for May. Harbor area sales were up 8% compared to 106% in May. Palos Verdes December sales were up 2% compared to 228% in May.
What does all this mean? For most of 2021 we cautioned readers that year to year comparisons were problematic because in 2020 no one was truly prepared for Covid. Business exploded in the first three quarters of 2020. It took until August and September of 2021 to get past the previous year’s damage, so camparisons were even explicable. Until then nothing is there to compare to. Businesses were locked down. Consumers and retailers alike were hunkered down at home. That’s why 2021 annual percentages are so large–they’re an anomaly! Only the last few months of 2021 are valid comparisons to historically relevant statistics.
In Summary
From our perspective it looks like we’re headed into a correction. One might even look at it as a correction from a correction. It’s as though the real estate market over-corrected from the Covid collapse and boomed for about three quarters. Now we’re coming back down to some pretty solid numbers.
We expect January 2022 to look a lot like this table, with some moderation of the numbers. That moderation should continue into the year as sellers and buyers move closer together on their initial expectations. By the end of summer we predict the market will show the first indications of pulling together for another roughly 10 year cycle.
We like to think of the proverbial real estate cycle as three steps forward–one step back. It’s important to note that this is the “back step” of the cycle. As such, it’s probably the lowest price a purchaser can expect to see for that product in the next decade, if ever again. At the same time, it’s probably the last opportunity for a seller to trade up without having to make significant upgrades to the product, or taking a big hit for deferred maintenance. By 2023 we should be working on building long term market value.
Thank you for reading. Our lead photo is courtesy of Michael Fallon. See https://unsplash.com/@fallonmichaeltx . As always, we’re here if you have a question or want to bounce an idea off us.
It’s official. We’re now in the post-pandemic phase. So what’s the real scoop on local real estate? Follow along as we review the May statistics and tease you with a little early June data.
Putting Statistics in Perspective
The first thing we want to do is remind everyone that in the first three months of the pandemic, the number of sales in the Los Angeles South Bay had dropped to approximately 50% of 2019 activity. So, when we say sales are up 100% from last year, what we’re really saying is that sales volume is pretty much back to normal. That is, “normal” in 2019.
Similarly, the fact all areas show higher sales prices than 2020 is relatively meaningless. We can only look to recent months or pre-pandemic statistics for market indications. We’ll get into more detail below, but remember that comparisons of 2020 to the Great Recession can be misleading.
Median Price Climbs: Everywhere
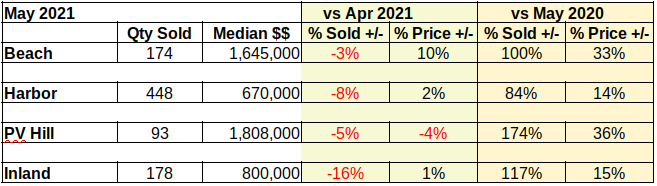
The median price in May of this year is shown in the chart below. Because 2020 wasn’t very meaningful in terms of normal real estate activity, we pulled up 2019 statistics. Respectively, the median price is up from 2019 by 25% at the Beach, 20% in the Harbor, 18% in PV and 16% Inland. That’s more than a healthy increase in prices for two years of appreciation. We can see from the charts there was some rapid inflation the first quarter of the year. More so at the Beach and in PV than elsewhere. Probably we’ll see some of that taken back as the market cools.
What we’re not talking about is what part of the market is selling? High? Low? Let’s look at the sales volume to find the hot spot in the market.
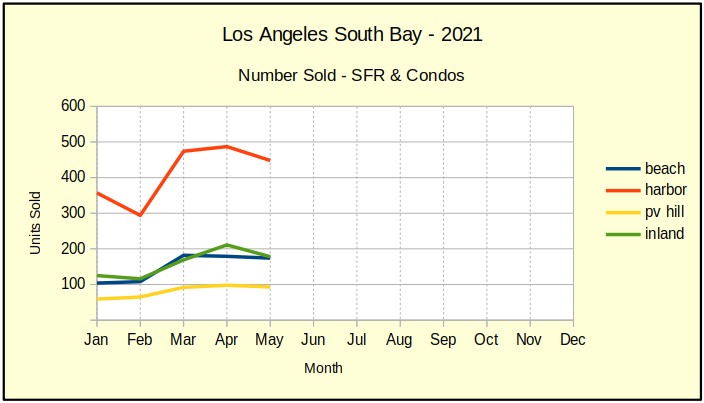
Sales Volume Starting to Smooth
The number of home sales per month across the South Bay has just about returned to normal. Sales in May 2020 were off by 45%-55% across the board from 2019. Now, comparing May of 2021 to 2019 we find that the Harbor cities have had virtually zero change in the number of sales. By contrast, the Beach shows 2% more sales, the Inland cities 5% growth in sales, and Palos Verdes 19% growth.
Two things stand out for me. The two year lack of growth in sales volume for the Harbor cities tells me the pandemic hit those cities the hardest. The recovery there will lag behind the rest of the South Bay offering some opportunity for those ready to buy now.
The second hot spot is 19% growth in sales volume on the Palos Verdes peninsula. Looking over the actual sales, I’ve concluded it’s simply that there are far fewer homes on the Hill, so minor change in sales statistics can look like a major fluctuation.
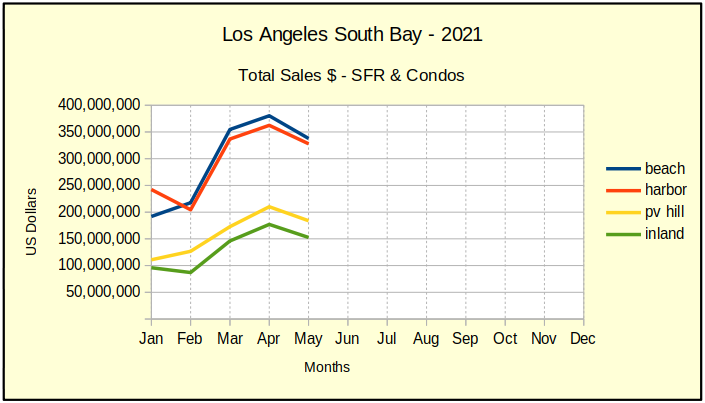
Total Sales Down Across the South Bay
Our chart below shows the total sales dollars climbing out of a winter slowdown that was accentuated by the pandemic. All areas rose uniformly in March and April of this year ending in May just about where they were the prior fall. June results will give us a better picture, but we expect a gradual leveling as inventories grow.
As of now, activity indicates that the peak of recovery from the pandemic is passing by us right now. Things should level out over the summer leaving us with a statistically somewhat normal sales year.
South Bay Summary
Across the South Bay we’re seeing a moderation of the wide swings and extreme numbers generated throughout the pandemic. For example, monthly March sales volume for all areas was up 57% over the prior month. By the end of April volume was only up by 6%. For May it was down -8%. Taking a peek at sales to date in June, it should be at -2% next month.
What we’re watching is the panic leaving the marketplace and stability returning. Pent-up demand earlier this year pushed property prices up as much as 14% on a month-to-month basis. While still steep, the high for May was 10%. Our forecast for June price increases in SoBay is a high of 9%, with a low of 0%.
At the moment there is little indication prices will move into negative territory beyond losing some of the rapid inflation of recent months. That may change as moratoriums on eviction and foreclosure dissipate. Currently slated to end September 30, 2021, some fear that the end of local moratoriums will release a flood of foreclosures and cause prices to plummet.
Locally, Los Angeles county and city have offered several alternative plans to minimize the impact. In some cases the entire debt may be covered by combined State, Federal and local government funds, completely rescuing both the tenant and the landlord from housing loss. As a result, many in the industry expect prices and activity levels to return to approximately where they were prior to the pandemic.
We believe the level of inventory will be nearly normal by this fall. Already we see offer prices declining and Average Days On Market (ADOM) stretching past 30 days for 15-20% of available homes. Following the usual slowdown for the holiday season, we predict a robust January in 2022 as the pandemic becomes a fading memory.
Judging from the downturn in May, we’re now returning to a more normal market. So, logically speaking, homes listed in June and later should come on the market at slightly lower prices. Our expectation is for area median sales to fall back by approximately $175K in the Beach and Harbor areas, with a decline of about $100K for PV and Inland area sales.
The year 2020 was very nearly the least predictable time in local real estate history. Seriously, what other time have we experienced massive unemployment and rising home prices simultaneously? All indications suggest 2021 will be a tad more conventional.
Home Values Grew in 2020
Despite “turmoil” being the watchword of 2020, the year produced some remarkable results in the Los Angeles South Bay. The Beach cities recorded a 28% increase in median price for December compared to December 2019. The cost of building didn’t rise at that rate, so clearly there was a heavy investment in anticipated value. As the chart below shows, Even with all the up and down motion, during the final half of the year buyers & investors were betting heavily that things were headed for calmer, more profitable waters.
That activity was spread across the spectrum of prices, as you can see tracing the community lines shown above.
Note that May reflects the sudden market contraction from the Covid announcement the beginning of March. This is a rare moment when the chart shows how much delay there is between signing a purchase agreement, and closing escrow. In April, 30 days after the announcement of a Covid pandemic, escrows were starting to drop off and were at or slightly down from March closings. By May, 60 days later, the number of closed sales had fallen by ~50K units in each of the four market areas. It took the classic 45 day escrow period to show that the pandemic took away nearly 30% of the business in the local real estate market.
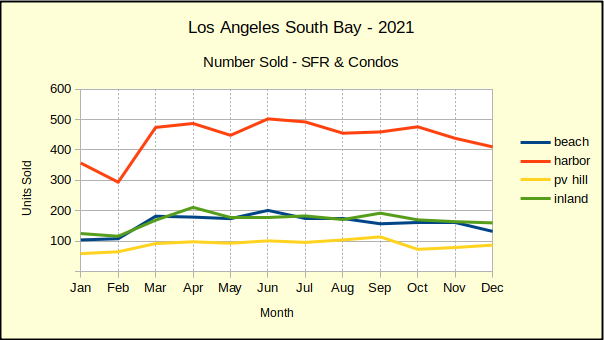
How Many Sales? Where? Why?
While the Beach and the Harbor areas fought it out for the highest total sales dollars throughout the year, the Harbor clearly enjoyed the highest number of units sold every month as we see in the chart below. While the number of sales climbed across the South Bay, at the end of the year it was the Harbor with the largest increase in sales. Starting 2020 with 315 sales in January, the number climbed consistently through the year to a strong finish with 476 in December.
Two factors play into the volume of Harbor area sales. Part is the sheer number of homes in what is physically a larger area. The more interesting aspect of Harbor area sales increasing while the rest are relatively flat is the reason.
Homes in the Harbor cities are lowest priced in the South Bay by about $100K. Interest rates are currently running below 3%, and it’s in the lowest price points of the market where low interest rates are most effective. The low rates mean more buyers can afford to purchase at the same price point, on the same income stream. The larger number of buyers competing creates multiple offers and drives the price higher, which is a major factor pushing the market today. If we are to believe the Federal Reserve Bank, current interest rates are expected to remain historically low for the foreseeable future. The demand should hang around for just about as long.
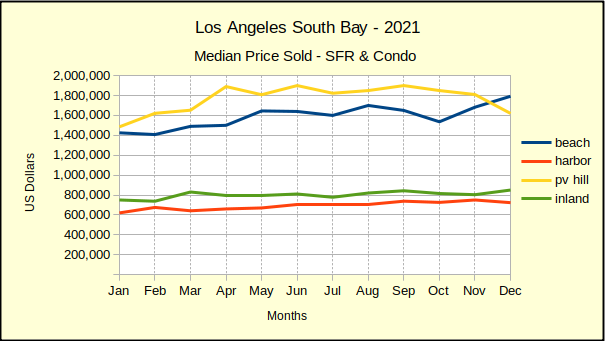
Different Strokes for Different Folks
In the chart below, it’s interesting to note that the Inland and Harbor cities progress across the months with stability and only a slight change from beginning to end. At the same time, the Beach and PV cities gyrate through the year, sometimes with $200K jumps from one month to the next. One is tempted to say it’s the comparative size of the market area, but the Inland cities have very nearly the same number of homes as the Beach cities.
This difference is often thought of as reflecting the nature of the home buyer in these communities. Looking at stereotypes, it’s easy to imagine an owner in Torrance or Long Beach, for example, who buys in their early twenties and doesn’t move again until retirement–very stable. In the Beach and PV price ranges, where a home is often considered more as an investment vehicle than a residence, it’s easy to see where market forces can result in sudden changes to where one lives.
Moving From 2020 to 2021
The beginning of 2021 marked the end of some of the more impactful aspects of 2020. A ferocious political battle is ended, and a new Federal administration looks inclined to use “all the available tools” to bring our collapsed economy back on line quickly. Time will tell how much that helps us here in the South Bay.
The ever-changing story of the international pandemic may be coming to an end with the approval of multiple vaccines for Covid-19. Rumors still abound as to the actual efficacy of the drugs, and rates of infection are still climbing dramatically, especially here in Los Angeles county. It will end, whether sooner or later. The big question today is if the price increases we’ve seen as a result of bidding wars will sustain as the pandemic eases and government assistance is strengthened.
Looking at December activity, we see big increases in sales volume for Month over Month (M-M) and Year over Year (Y-Y) statistics. A continuance of this trend could make 2021 an exceptional year for real estate in the South Bay.
Median prices show a large variation from area to area, and importantly show a slowdown in the climbing prices. Y-Y price growth was strong in December, reflecting the high demand at current interest rates. However, M-M prices predominantly showed a reversal in price growth. Some of the slowdown could be seasonal, but if you’ve been reading our blog posts you already know there’s a growing backlog of homes poised on the edge of foreclosure. The only thing preventing a mass of short sale and foreclosure properties on the market is the forbearance rules put in place to prevent a sudden jump in homelessness during the pandemic.
Beach
December activity in Beach cities showed insane growth for M-M and Y-Y sales, both in the the number of sales, and especially in the prices of sold homes.
As if annual growth of 28% in median price wasn’t crazy enough, look at that monthly increase of 18.2%! Annualized, that would be over 114% growth! Statistics with this much reach can only be attributed to a profound belief that prices will continue to increase at a similar rate. Or, continue until the property can be flipped, that is.
Palos Verdes
Palos Verdes in December was almost a reverse image of the Beach cities. The explosive growth in PV came in the number of home sales which shot up 18%, bringing the annual number to a phenomenal 42% growth in volume for the year.
Median prices in PV showed modest increases, ending the year only slightly higher than the Fed’s target growth rate. The shift from positive growth to shrinkage in December hints at an overall market trending toward lower median sales prices.
A side note: Homes on the hill have not maintained the “investment quality” image of those on the Beach. PV was once considered the place to buy a home from a prestige angle and from an investment perspective. New money moving into the Beach cities has diminished that role in recent years. I predict a rebirth of property values in the Palos Verdes cities over the next few years, which will make having a home on the peninsula key in local business and society.
Inland
For the most part, Inland homes are family homes. They are the places with hoops in the driveway and lemonade stands at the sidewalk. Investment here is a long term concept.
So, when we see over 20% M-M growth in number of homes sold accompanied by nearly 30% Y-Y, we’re seeing market movement rather than shifts in investment strategy. As it is throughout South Bay, the cause of that movement appears to be the sub-3% interest rate which enlarged the entry level market segment. More buyers flooding in created bidding wars and drove sales and prices higher.
Compared to last December, median prices in the Inland cities were up 5.5%, peaking at $733K. That’s a good healthy increase, only slightly above the expected Consumer Price Index (CPI) numbers. Caution though–the M-M median is down 2.3%. It could be a momentary blip; a result of the holiday season, or the Covid surge. That year end drop may also indicate that the $750K median from November is the market ceiling.
Harbor
In addition to the largest home sales volume in the South Bay, the Harbor area boasts the most entry level homes. There’s a good deal of lifestyle overlap with the Inland cities, to be sure. The Harbor dramatically displays the same message we see across most of the South Bay. Everything was going strong until December, then buyers put the brakes on.
Today’s environment in the Harbor points the direction to the future. Sales here had a stronger growth than the Inland cities over the months leading up to December, and show a more pronounced decline in December.
Some of the slowdown will ultimately prove to be driven by the holiday, and some the election, and some by the pandemic. Even then, it’s hard to avoid the feeling that some of the decline is a recession held back by a thin wall of regulations temporarily preventing foreclosure and eviction.
We can certainly hope for better news from the new year, but as of the end of 2020 many of our indicators are calling for a deeper recession in coming months. It’s possible. Somewhere in the range of 20%-40% of homeowners are in forbearance now, and a roughly equivalent number of tenants are building up deferred rent payments. If adequate measures are taken to protect both sides of the debt, all of this will amount to footnote in history. Otherwise, it’ll be the second worldwide recession in this generation.