
It’s official. We’re now in the post-pandemic phase. So what’s the real scoop on local real estate? Follow along as we review the May statistics and tease you with a little early June data.
Putting Statistics in Perspective
The first thing we want to do is remind everyone that in the first three months of the pandemic, the number of sales in the Los Angeles South Bay had dropped to approximately 50% of 2019 activity. So, when we say sales are up 100% from last year, what we’re really saying is that sales volume is pretty much back to normal. That is, “normal” in 2019.
Similarly, the fact all areas show higher sales prices than 2020 is relatively meaningless. We can only look to recent months or pre-pandemic statistics for market indications. We’ll get into more detail below, but remember that comparisons of 2020 to the Great Recession can be misleading.
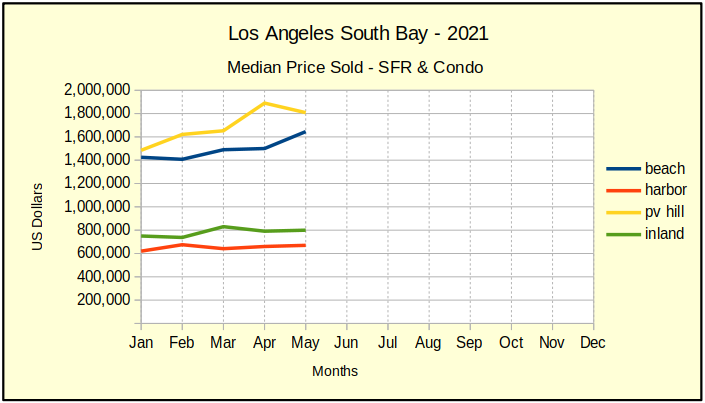
Median Price Climbs: Everywhere
The median price in May of this year is shown in the chart below. Because 2020 wasn’t very meaningful in terms of normal real estate activity, we pulled up 2019 statistics. Respectively, the median price is up from 2019 by 25% at the Beach, 20% in the Harbor, 18% in PV and 16% Inland. That’s more than a healthy increase in prices for two years of appreciation. We can see from the charts there was some rapid inflation the first quarter of the year. More so at the Beach and in PV than elsewhere. Probably we’ll see some of that taken back as the market cools.
What we’re not talking about is what part of the market is selling? High? Low? Let’s look at the sales volume to find the hot spot in the market.
Sales Volume Starting to Smooth
The number of home sales per month across the South Bay has just about returned to normal. Sales in May 2020 were off by 45%-55% across the board from 2019. Now, comparing May of 2021 to 2019 we find that the Harbor cities have had virtually zero change in the number of sales. By contrast, the Beach shows 2% more sales, the Inland cities 5% growth in sales, and Palos Verdes 19% growth.
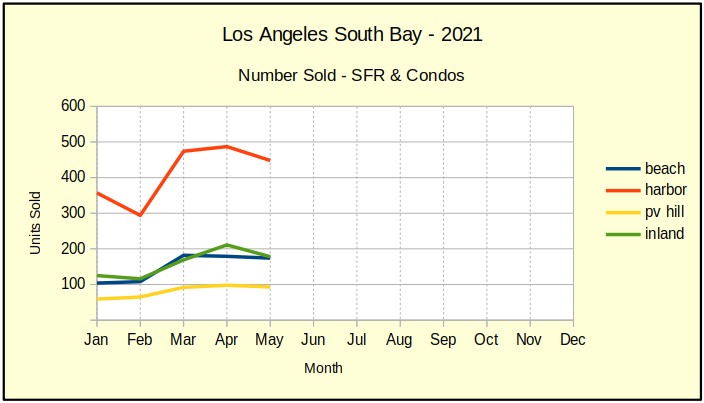
Two things stand out for me. The two year lack of growth in sales volume for the Harbor cities tells me the pandemic hit those cities the hardest. The recovery there will lag behind the rest of the South Bay offering some opportunity for those ready to buy now.
The second hot spot is 19% growth in sales volume on the Palos Verdes peninsula. Looking over the actual sales, I’ve concluded it’s simply that there are far fewer homes on the Hill, so minor change in sales statistics can look like a major fluctuation.
Total Sales Down Across the South Bay
Our chart below shows the total sales dollars climbing out of a winter slowdown that was accentuated by the pandemic. All areas rose uniformly in March and April of this year ending in May just about where they were the prior fall. June results will give us a better picture, but we expect a gradual leveling as inventories grow.
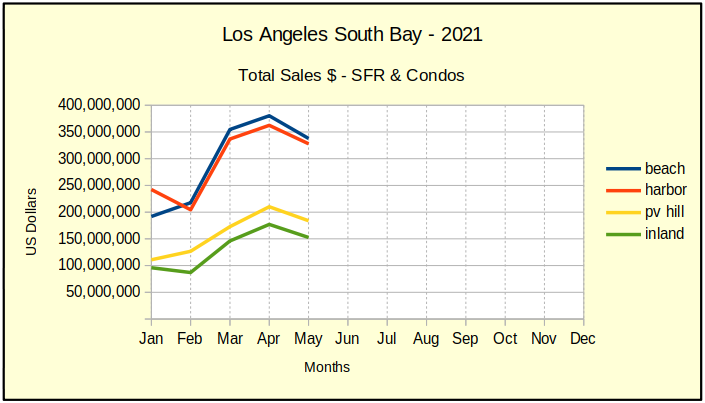
As of now, activity indicates that the peak of recovery from the pandemic is passing by us right now. Things should level out over the summer leaving us with a statistically somewhat normal sales year.
South Bay Summary
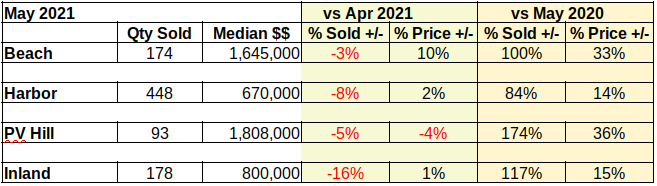
Across the South Bay we’re seeing a moderation of the wide swings and extreme numbers generated throughout the pandemic. For example, monthly March sales volume for all areas was up 57% over the prior month. By the end of April volume was only up by 6%. For May it was down -8%. Taking a peek at sales to date in June, it should be at -2% next month.
What we’re watching is the panic leaving the marketplace and stability returning. Pent-up demand earlier this year pushed property prices up as much as 14% on a month-to-month basis. While still steep, the high for May was 10%. Our forecast for June price increases in SoBay is a high of 9%, with a low of 0%.
At the moment there is little indication prices will move into negative territory beyond losing some of the rapid inflation of recent months. That may change as moratoriums on eviction and foreclosure dissipate. Currently slated to end September 30, 2021, some fear that the end of local moratoriums will release a flood of foreclosures and cause prices to plummet.
Locally, Los Angeles county and city have offered several alternative plans to minimize the impact. In some cases the entire debt may be covered by combined State, Federal and local government funds, completely rescuing both the tenant and the landlord from housing loss. As a result, many in the industry expect prices and activity levels to return to approximately where they were prior to the pandemic.
We believe the level of inventory will be nearly normal by this fall. Already we see offer prices declining and Average Days On Market (ADOM) stretching past 30 days for 15-20% of available homes. Following the usual slowdown for the holiday season, we predict a robust January in 2022 as the pandemic becomes a fading memory.
Judging from the downturn in May, we’re now returning to a more normal market. So, logically speaking, homes listed in June and later should come on the market at slightly lower prices. Our expectation is for area median sales to fall back by approximately $175K in the Beach and Harbor areas, with a decline of about $100K for PV and Inland area sales.
Cover photo by Martin Sanchez on Unsplash