It seems paradoxical to think stability and adaptability can both be important simultaneously — perhaps they’re two different strategies, but how can they come together? The reality is that sticking to what you’re used to doesn’t work in a constantly shifting industry, and adapting to changes doesn’t get you ahead unless there’s some baseline of predictability. Neither strategy works on its own, so the industry needs both.
For a long time, the multiple listing service has been the rock that agents rely on for cold, hard data. While this is still true, buyers and sellers also increasingly have access to this data. This shifts the narrative — buyers and sellers now rely less on agents for data, and more for the things that the MLS doesn’t tell you. This includes regulations, local trends, and insights drawn from experience.
This doesn’t mean the MLS isn’t important anymore. It’s still the source of all that data, and without it, agents, buyers, and sellers would all be lost. What it does mean is that success in the real estate industry — for both agents and their clients — relies more than ever on a deep understanding of local expertise. In also means communication between agent and client is both more important and also easier. A smaller gap in knowledge means the process is less of a black box for clients.
Last year, Google began partnering with HouseCanary — an AI driven real estate brokerage — for a pilot program to deliver real estate listings directly to viewers via simple Google searches. The pilot program was initially only available in eight major markets, but this summer, will be expanding to all fifty states.
Unlike standard Google searches, which take data from wherever they can be found, this data will be sourced directly from a multiple listing services to ensure as much accuracy as possible and comply with regulations. Not all MLSes are participating, though, so only data from participating MLSes will be available. Currently, these are My State MLS, California Regional MLS, and San Diego MLS, but Google and HouseCanary are hoping to get more on board.
The goal of this program is to increase discoverability. Right now, potential clients looking to buy or sell can find information about homes for sale via sites such as Zillow or Trulia, but these sites don’t direct them to an agent — or if they do, it’s an agent that paid these companies to promote them, not necessarily the agent with the relevant listing. With this program, there will a button allowing searchers to directly contact the listing agents.
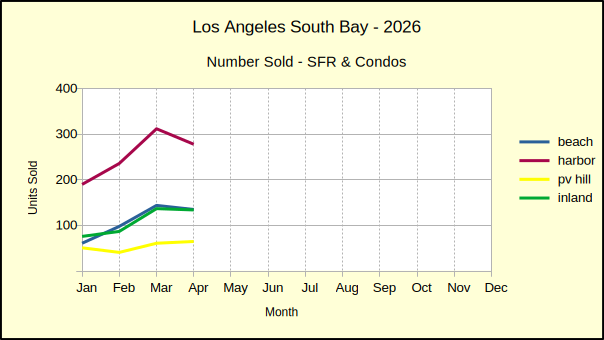
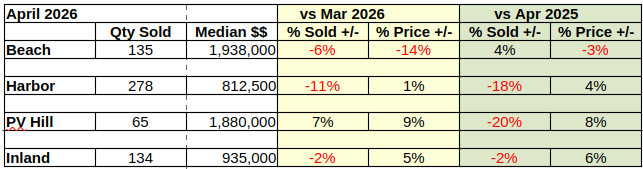
The number of homes sold across the South Bay during April fell 6% below March sales. The only growth occurred on the Palos Verdes Hill where 7% more homes were sold than closed escrow in March. The Harbor area took the hardest hit with a decline of 11% in home sales.
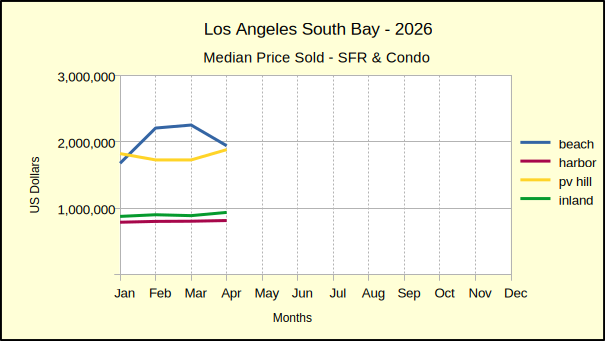
While the monthly median price is still mostly positive, April saw a 14% drop in median price for the Beach Cities. That significant fall for an area that is traditionally strong indicates prices may soon follow volume on the way down.
April 2026 vs April 2025
Comparing this April to the same month last year finds the number of homes sold in the South Bay dropped 10% over the past 12 months. The Harbor and Hill areas took the worst beating, losing 18% and 20% respectively. Only the Beach area came in positive, with a mere 4% increase in sales—a collapse from the 31% growth the prior month.
On an annual basis, the median price was much like the monthly. Once again, only the Beach Cities showed red ink. This time with just a 3% loss in value. Median prices have had far ranging swings since the first of the year. The year started with a 40% decline in the median for the Beach area. The highest increase in median price was 10%, also at the Beach.
2026 Year to Date vs 2025
For the first four months of the year, sales volume has slipped by 6% across the region. In the same time frame, median prices have dropped modestly everywhere except the Harbor area, where prices are maintaining a 3% boost over the first four months of 2025.
Year to date sales and prices likewise show the negative impact of inflation. Price resistance is showing up both in purchases and in leases.
The Outlook for May
Sales volume has been negative three months out of four so far this year. March countered in all areas, but April took back the increases everywhere except the Beach. A quick look at the number of homes sold already in May does nothing to improve the outlook. At this point the best to be hoped for is going from double digit losses to single digit losses, with maybe an occasional positive.
Median prices are treading a borderline. If sales volume continues to slip, as everything indicates, prices will suffer. The market is essentially in stasis, and fewer active buyers will force price reductions from sellers who often have no choice but to sell.
On the other hand, all the wars could end and we could go back to building and selling homes for people.
Beach=Manhattan Beach, Hermosa Beach, Redondo Beach, El Segundo Harbor=Carson, Long Beach, San Pedro, Wilmington, Harbor City PV Hill=Palos Verdes Estates, Rancho Palos Verdes, Rolling Hills, Rolling Hills Estates Inland=Torrance, Lomita, Gardena
If this is your first time buying a home, you may be surprised to find out that there are actually distinct terms for several different types of homes. You’ll want to know what these terms mean, so that you can look for the right type of home for you.
Single-Family Home: Your standard traditional “house,” often with a backyard and possibly a garage.
Duplex: A single building divided into two separate homes, each with its own entrance. A duplex usually has one owner owning both units.
Townhouse: A multifloor house that shares walls with adjacent houses but has its own entrance. The adjacent houses typically do not have the same owner.
Accessory Dwelling Unit (ADU): A secondary house or apartment on the same lot as a larger “main house.” ADUs can be attached or detached.
Mansion: A huge, impressive house, often with high-end amenities and lots of private land. There is no single legal definition, so there is some subjectivity.
Apartment: A private residence within a building or complex of other residences, often rented from a landlord or company. If one needs to disambiguate, a single residence could be called an apartment unit, while all residences taken together are called an apartment complex.
Condo(minium): As above, but a condo is owned rather than rented.
Cabin: A small, simple house, often in a remote location and typically built from natural materials like wood.
Tiny Home: A very small, cozy, minimalist dwelling that maximizes efficiency in a small space.
Co-Op: This is more of an ownership arrangement rather than a type of home in which residents own shares in a corporation that owns the building rather than owning it themselves.
Modular Home: A house built in sections in a factory and then transported to a site for final assembly. This could be several of the other types as well.
Mobile Home: A portable house with wheels, such as a caravan or trailer.
When a buyer and an agent enter into an agreement for the agent to represent the buyer in the purchase of a home, that agreement is called a buyer agency agreement. A buyer agency agreement usually spells out the duties the agent has towards the buyer in finding and closing on a home.
It is important for the buyer to make sure the right conditions are outlined in the agreement. The buyer can participate in negotiating the terms of the agreement, and the buyer has no obligation to continue working with the agent if the agent is not performing per the agreement.
Buyer agency agreements have typical term lengths of 90 days but can be negotiated for any length. A buyer can specify the kind of property being sought so the agent keeps on track during their search. The terms of the agent responsibilities should also include negotiating on behalf of the buyer and making sure the sales transaction successfully closes.
The day of the month that you close on the purchase of your home is important and should be part of your contract negotiations. Whether you want to close early or late in the month depends whether you want to save money or ensure the process goes smoothly.
Mortgage interest is paid in arrears. The amount of prorated interest that you will pay at closing will be determined by the day of the month you close. A later date in the month means less interest paid as part of your closing costs. For example, if you were to close on May 30, then you would only pay two days of interest plus the interest due for June. Your first payment wouldn’t be due until July 1.
Because of these savings, 95% of closings occur at the end of the month. What this also means is that title and escrow companies are not as busy near the beginning of the month, and the closing process tends to go a bit more smoothly.
Selling your home isn’t just about highlighting its best features. It’s also about removing the things that turn buyers off. Even small details can make a big difference in whether your property feels move-in ready or neglected.
The biggest thing to avoid is out of date, worn, or unmaintained home features. Maintaining your yard is a big boost to curb appeal, and ignoring it is a big downgrade. Worn out carpets signal a lack of maintenance, so your floors should be recarpeted or replaced with wood or tile. Buyers may even notice out of fashion styles for doorknobs, faucets, or cabinets.
You should also avoid making your home look too personalized. You want your buyer to be able to imagine themselves living in the space, not glimpse how you are living there. Keep personal effects out of view and remove clutter. Some staging is useful, but it should be neutral, not overly personal or polarizing. The same goes for paint colors — many buyers will repaint anyway, but you want them to be able to focus on the home itself, not your design choices.
We’re not going to spend a lot of effort talking about month to month real estate activity in this issue. February invariably has more closed sales than January, because the escrows that close in January are for deals that were negotiated in December, when most people were partying instead of buying a home.
The one monthly anomaly screaming for clarity is the 72% increase in monthly sales in the Beach area, while the total increase in sales for the South Bay is only 20%. That’s a real outlier, and we didn’t have an explanation last year when the numbers were nearly the same. In February of 2025 the Beach came in with a 70% increase in the number of sales closed while the total South Bay monthly increase was 24%. The other three areas are normal and the raw totals are normal, except for sales skyrocketing at the Beach for one month. Perhaps there’s a new tax “loophole” happening?
Overall, home sales are still off about 20% from pre-pandemic years. Activity has been gradually catching up, but the projection is for several years of improvement before sales volume is back to what used to be normal. The big surprise in sales volume comes in comparing last month to February of 2025, Last year had shown a solid growth of 19% over February of 2024, with positive numbers in all four areas. This year shows plummetting sales in all four areas, with a drop of 19% across the South Bay.
With that thought in mind, and looking at the year to date, for just January and February, 2024 showed 2% sales growth, and 2025 4% growth. In what appears a total reversal, 2026 is dropping by 18%. It’s still early in the year, so the direction may change. At this point it looks as though economic and war worries may be slowing the number of transactions closing. There was evidence of increased buyer risistance over the last half of 2025. The first quarter figures next month will give a more thorough picture of what to anticipate for the year.
Median Price:
Shifting gear and looking at the median price, shows a similar theme. Once again, the Beach area is showing a super-charged increase in comparison to the balance of the South Bay. The Harbor area was up 1%, the Inland area up 5%, PV down 5%, and the Beach was up 31%!
On one hand, it could be said “Money is migrating to the Beach at an increasing rate.” Or perhaps, “Owners are dumping the Beach for huge profits.” It’s conceivable both are correct. In any event it’s an interesting phenomenon.
Year over year, where the chance to look ahead comes alive, things look much more restrained. The Beach is up 1% in median price, which is significant change from being down 29% in January. At the same time, the Harbor is up 5% and the Inland area is up 2% — all very tame.
Median prices on the Hill dropped by 16%. One needs to remember there is a comparatively small number of homes selling in the PV area on a monthly basis, so one or two unique transactions show up as huge blips in the charts.
Year to date, median prices are more constrained than last year. The Harbor area, the largest of the markets in the South Bay, is up 5% over the same period for 2025. The Inland area is flat, while the Hill is down 10% and the Beach is up 15%.
Continuing on the vein we started at the beginning, the sales being reported now were negotiated in January, before the crisis in West Asia bloomed. This shows a tempered market with pullback in both the number of homes sold and in the median price of those homes. The day to day feel of the South Bay real estate market seems to be continuing on a roughly similar pace, but it will be another month before we can really see the statistical impact. Let’s look again next month.
Beach:
M-m, vol: 91, 72%, med: 2,200,000, 31%
y-y, vol: -17%, med: 1%
ytd, vol: -17%, -13% from 2019, med: -15%, up 63% from 2019
Harbor:
M-m, vol: 220, 21%, med: 800,000, 1%
y-y, vol: -19%, med: 5%
ytd, vol: -22%, -27% from 2019, med: 5%, up 49% from 2019
Hill:
M-m, vol: 36, -27%, med: 1,722,500, -5%
y-y, vol: -22%, med: -16%
ytd, vol: 9%, 10% from 2019, med: -10%, up 36% from 2019
Inland:
M-m, vol: 84, 14%, med: 920,000, 5%
y-y, vol: -18%, med: 2%
ytd, vol: -17, -21% from 2019, med: -0%, up 40% from 2019
Beach=Manhattan Beach, Hermosa Beach, Redondo Beach, El Segundo Harbor=Carson, Long Beach, San Pedro, Wilmington, Harbor City PV Hill=Palos Verdes Estates, Rancho Palos Verdes, Rolling Hills, Rolling Hills Estates Inland=Torrance, Lomita, Gardena
An Earthship home is a home built around sustainability. These types of homes are built to work with nature rather than against it. The concept dates back to the 1970s, born during the early environmental movement. They’re often made using recycled and natural materials, be it old tires, glass bottles or reclaimed wood, combined in clever ways to create a strong insulating house.
Anyone can pile up tires and wood in a vague house shape, but what sets Earthships apart is how they function day to day. They’re designed to collect their own energy using solar or wind power, harvest rainwater and naturally regulate indoor temperatures through smart design rather than relying on heating or air conditioning. Many even include indoor growing spaces, allowing homeowners to grow herbs, fruit or vegetables year-round.
Sustainability sounds great, but Earthship homes aren’t for everyone. You can’t build an Earthship home just anywhere — they work best in moderate climates. Tropical or arctic conditions can just be too much of a strain on the house. Also, they can take a lot of work to keep them functioning, so you’d need to be able to expend the time and energy to keep them running.
Buying your first home can feel overwhelming without the right preparation. It doesn’t need to be, though. If you do your research and manage your expectations, you’ll be able to make better choices. All you need is a good plan.
Start by figuring out what you need and what you can afford. Consider what you really need not just in a home, but in a neighborhood, and plan ahead for the future. For example, good schools might be more important if you’re planning to have kids soon, even if you don’t have any right now. Look at your income, savings and ongoing expenses to determine a comfortable budget. This includes not just the purchase but also life after moving in. Homeownership comes with regular costs such as utilities, maintenance and repairs, so it’s wise to leave room for the unexpected.
A professional support network can help you every step of the way. They’re not just here to sign the legal documents and be done with it. Your real estate agent can guide you through viewings, offers and negotiations, while professionals such as inspectors and appraisers can help uncover potential issues before you commit. Ask about local housing markets, typical prices and how competitive things are. You can also visit neighborhoods yourself to reveal details you won’t see in listings alone.
It’s also important to stay grounded. Yes, you should be excited about the home you’re about to buy, but you need to temper your expectations as well. Your first home doesn’t need to be perfect; it needs to work for your life right now while setting you up well for the future.
Many sellers skip staging their home, either because they think it’s not worth the time or money, or because they want their home to feel lived in. This might be sound logic if the staging is bad, but if you get your staging done well, it’s definitely worth it.
A competitively priced home that has also been staged to appear move-in ready will help justify its listing price. A positive first impression will motivate agents, who will put your home at the top of their list when showing properties to their clients. Successful staging will give your home an edge over the competition without having to compromise on price. It can sometimes feel like it’s just an added cost, but it’s actually an advertising investment.
It’s true that when you stage your home, it’s marketed in a more neutral way. This can feel like it’s lost its personality. But a properly staged home should actually help buyers more easily visualize themselves living in your home. It does this by helping define spaces and room sizes and giving every room a purpose. Remember that the buyer isn’t you — they want to imagine themselves living there, not you living there.
As we enter spring cleaning season, consider cleaning up not just the inside of your home, but the outdoor space as well. It’s easy to forget that a few smart landscaping updates can go beyond just transforming your outdoor space; it can also add value to your home. Here are some ideas to improve both the look and the value of your home.
Native plants, especially trees, are an excellent addition. Plants that naturally thrive in your local climate will need less nurturing, attract pollinating wildlife and blend seamlessly into the natural landscape, creating a low-maintenance, visually appealing space. Trees in particular have a significant impact on home value for many reasons. It helps to create a sense of privacy, allows for shaded areas in the hot summer months, and can make the outdoor space feel generally more interesting and intriguing to potential buyers.
Think about all the various ways you use your outdoor space, and considerbreaking up large spaces in your garden into defined spaces. A gravel dining area, a paved fire pit corner, or a shady hammock nook are clear examples of usability that help buyers imagine themselves in the space. Installing edging between the lawn and flower beds helps keep the garden looking neat and well cared for.
Consider upgrades that are both functional and visually appealing. If the concrete is starting to crack, replace it with stepping stones, gravel, or reclaimed brick. Artistic arrangement of these features can also serve as a guide for buyers.Outdoor lighting helps to make the space feel usable beyond daylight hours as well as creating a sense of safety and security.
The secret to making sure you are buying the house that is best for you is knowing what your basic needs are before you proceed, and what are simply things that would be nice to have. In order to do this, remember that many wants can be achieved later if basic needs are met. Once you decide what you can live with and without, you can budget accordingly.
Basic needs include health and safety items, which should be your first priority. A solid foundation and floors and walls without defects are important features for safety and are difficult or costly to fix later. The condition of your HVAC is also a health concern, though that can be repaired. Good location is also a priority, despite not necessarily being a safety concern, since that can’t be changed later. Anything else on your list would be want-to-haves rather than need-to-haves. For example, you can later change paint, countertops, and fixtures or do remodeling.
First glance at the month to month December numbers: A 12% increase in December sales brought smiles to a lot of faces, until they realized this only corrected half of the 23% drop in November sales volume. This past year saw a lot of one-step-forward-two-steps-back. The annual numbers make it look like that will continue to be the pattern into 2026. Median prices found gains for the Beach and the Hill, while prices slid in the Harbor and Inland areas.
Year over year, December sales were mixed, with sales volume dropping at the Beach and on the Hill. At the same time, the Harbor and Inland areas experienced solid increases in sales. Median prices for December showed a reverse pattern, with the median increasing at the Beach and on the Hill, while it dropped in the Harbor and Inland areas. This has all the earmarks of being a market peak.
Without getting into details about the monthly statistics, those are covered below, let’s move on to what the year over year data reveals. In the end, 2025 showed a solid 4% growth in sales over 2024. This broke down as: Beach 10%, Harbor 3%, Hill 6% and Inland 1%. It’s important to note the sales volume over the final four months of 2025 were nearly all lower than the same month in the preceding year, showing a persistent drop in sales. Where the early months of the year were overall positive, despite choppy performance, across the board, there has been a slow decline in comparison to last year.
The year began with double digit increases in sales volume across the South Bay, registering 11% in January and 19% in February. The number of homes sold bounced around a lot during the year and ended with a mere 4% increase in sales volume over 2024, with three months out of 2025 being negative.
A slowing in the sales volume doesn’t necessarily dictate a slowing in the median price, although this year it did. The 2025 median for each area showed a 1-2% increase in price everywhere except the Beach were the median trebled to an astounding 6%. One might suspect a bit of investment fever in pricier neighborhoods. Several decades after being a disreputable neighborhood of the displaced and homeless, the Beach areas have become the place to invest extravagantly.
Interestingly, this aligns neatly with a statement in the Federal Reserve’s Beige Report of 1/14/26. “Several Districts also noted that spending was stronger among higher-income consumers with increased spending on luxury goods, travel, tourism, and experiential activities. Meanwhile, low to moderate income consumers were seen to be increasingly price sensitive and hesitant to spend on nonessential goods and services.”
Note, this is not yet a reversal in price increases, like that seen in 2023, but is a distinct slowing of the increase. The rate of increase has fallen from the double digits of 2021 and 2022 to barely remaining positive at about half the rate of 2024. One could easily envision median prices going negative again in 2026.
Such an event might be readily termed “a correction” given that current median pricing is showing roughly 40% above the median from 2019, the last year prior to the Covid pandemic and associated market disruption. That 40% calculates out to about a 6% annual increase, three times greater inflation than the 2% sought by the Federal Reserve.
It has been said the only reason median prices are still climbing at all is the shortage of homes available on the market. Inventory figures appear to be off about 15% from the peak in 2019, just before the pandemic. When the Fed responded to the frozen market and interest rates plummeted, inventory levels fell equally rapidly. By 2022 inventory had dropped to 50% of the 2019 levels. Those home sales, and the huge refinance boom that accompanied them put roughly 40% of the homes in California on a 3%+/- mortgage interest rate. Those homeowners are only selling if absolutely necessary, which is keeping the inventory artificially low and simultaneously keeping median sales prices artificially high.
Beach:
In December, home sales at the Beach increased to 90 units, or 11% greater than November. As noted above, that did not erase the 23% decrease in sales from October to November. At the same time, the median price increased by 4% to $1,825,500.
Compared to December of 2024, the number of residential sales has declined by 16% while the median price increased 1%.
For the year 2025, the number of homes sold at the Beach increased by 10% over 2024. Versus sales for 2019, the market remains depressed by 19%. Sales volume is increasing slightly, but it feels depressingly slow.
For the same period, the median price increased by 6%, which has inflated 45% since 2019.
Harbor:
By virtue of mathematical probability, the Harbor area is the most stable of the four demographic areas in the South Bay. December home sales at the Harbor rose 14% to 298 units, very much in line with the total South Bay increase of 12% over November numbers. At the same time, the median price fell by $779,275, for 4% drop.
On a year over year basis, home sales this December exceeded sales in December of 2024 by 19%. Opposing the volume gain, the median price declined by 3% for the same period.
Looking at the full year, 2025 saw more homes sold by 3%, with the median price increasing by 1%. The bump up in sales volume can be viewed as positive recovery from over-exuberant financing of the Covid years. The median price increase is simply an aggressive response to the low inventory.
Sales for last year fall 22% the volume in 2019, and median prices are currently 40% above those of 2019.
Hill:
November versus December sales on the Hill brought in a zero change for the 45 units sold. The median price showed an increase of 1% to $2 million even for the final month of the year.
Year over year, December ended at a 10% decline in the number of homes sold in 2025, while jumping up for a 14% rise in the median values of those homes. As always, the small sample size of PV sales may lead to extreme results, so feel free to call if you have a specific question.
For the year as a whole, compared to 2024, 6% more homes were sold on the Peninsula in 2025 and the median price was 2% greater. Compared to 2019, sales volume was down by 17% while the median price was up 46%.
Inland:
The number of homes sold in the Inland area for December jumped 14%, to 116, from November, while the median price fell by 3% to $838,500.
Annually, December 2025 gained 9% in sales volume over the same month in 2024. Median price for that period fell by 6%.
Inland sales enjoyed a 1% increase year over year in 2025, while also seeing a 1% increase in median price. Compared to 2019, sales volume remained suppressed by 19%, while median price ended 2025 with a 33% increase.
Beach=Manhattan Beach, Hermosa Beach, Redondo Beach, El Segundo Harbor=Carson, Long Beach, San Pedro, Wilmington, Harbor City PV Hill=Palos Verdes Estates, Rancho Palos Verdes, Rolling Hills, Rolling Hills Estates Inland=Torrance, Lomita, Gardena
Virtual tours and showings are a great way to speed up home viewing, but because you are not physically in the space, there are a lot of negatives. A virtual tour guides you through the best features of a home that has been properly staged with touched-up photos. This makes it look good, but doesn’t show how it actually looks. Camera angles and zoom levels can avoid defects or distort room sizes. The tour may even completely ignore some walls, rooms, or the ceiling or floors.
Find out exactly what you are seeing and what is not being shown. If something is missing from a virtual tour, it may be because it doesn’t look good, or the tour wasn’t done very professionally and might misrepresent the home. Virtual tours don’t always include the basement, so be sure to check if there is one and what its condition is like. Even if you use virtual showings as a preliminary screening, you should also check out the home in person before purchasing. If you can’t view the home in person for whatever reason, have your agent be your eyes in your absence by checking for any defects, such as wall cracks, evidence of past water issues and any other flaws.
President Donald Trump recently announced a plan to purchase $200 billion in mortgage bonds, also known as mortgage-backed securities (MBS). Trump intends to use cash reserves from Freddie Mac and Fannie Mae to fund the purchase. But what are MBS, and what does that mean for the economy?
The first question has a definite answer. MBS are investment packages consisting of many home loans. This is not unusual; Freddie Mac and Fannie Mae already package together the individual loans sold to them and resell them to investors as MBS. What is not as common is using cash reserves from Freddie Mac and Fannie Mae to purchase already packaged MBS on the secondary market, as Trump is planning to do. This does not mean it never happens — it’s a standard tactic for intervention during financial crises.
So if it’s a strategy for improving the economy during financial crises, that makes it a good thing, right? Well, not necessarily. What’s most important is the signal being sent. The expectation is that purchasing MBS signals higher demand, which would likely result in increased prices on MBS. With increased prices, MBS yield is lower. With mortgage rates being influenced by MBS yield, this theoretically also reduces mortgage rates for homebuyers. But notice that this involves multiple steps, and not all of them are certain. Supply and demand are often treated like immutable laws, but at their core, they are probabilistic models. And when the model doesn’t conform to reality, there can be disastrous effects, such as the 2008 recession that resulted from purchasing subprime mortgages.
So what we need to know is what sort of signal Trump’s $200 billion MBS purchase is likely to send. According to economists at Realtor.com, probably not much of one. $200 billion may sound like a lot of money, but it’s very little in comparison to the trillions of dollars spent on MBS for financial intervention during the Covid-19 pandemic. While many months of significant MBS purchases certainly had a strong positive impact in 2020-2022, a single low-value purchase doesn’t necessarily signal increasing demand, merely a one-time spike. At most, this could cause a small temporary decrease in mortgage rates. This is especially true because investors are humans, not calculators. They may barely notice the small spike in demand, or they may consider it an uncertain investment, since they’re aware it’s a one-time event. All in all, Trump’s $200 MBS purchase probably won’t have a significant effect on the economy.
After a big 7% dive in October sales, annual real estate sales flattened out in November. Compared to November of 2024, the numbers are showing zero change for the Los Angeles South Bay. Sales were mixed across the areas. Median prices were mostly increased, though modestly compared to early in the year.
Downward pressure has increased in both sales and prices from month to month throughout the year. While 2025 continues to exceed 2024 in all metrics for all areas, the margin has grown smaller continually. Anecdotally, the real estate market has been slow and is slowing. This time of year slower sales are expected, though the seasonal slowdown this year seems to be a bit faster than usual. Median prices are not necessarily affected by the season, so the shift in pricing is one more indicator of a slowing real estate market.
Even two decreases in the prime rate by the Federal Reserve has done nothing to help. The most recent drop of .25% actually saw a .125% increase in the mortgage rate the next day.
In a couple weeks the year will be closing out and 2025 will become history. We’ll get the annual wrap-up out to you with a forecast for 2026 as early in January as possible. Enjoy your holidays!
Beach:
The number of homes sold in November in the Beach area plummeted in comparison to October. Sales dropped 30%, coming in at a mere 81 units. At the same time, the median price dropped to $1,750,000 to register an 8% decline. This is the sixth time this year Beach Cities sales have fallen compared to the prior month, and the eighth time the median prices have done likewise.
November of this year compared to November of 2024 showed mixed results. The volume of sales dropped 2%, while the median price rose 6%. This is the third month in a row annual sales have declined at the Beach. The annual median started in January at 32% increase, and has steadily dropped, falling below 0% four separate months.
With only one month remaining, the year to date numbers show a strong 12% growth in sales and 6% increase in the median price. The sales volume remains 17% below the number of homes sold during the same period in 2019. The median price at the end of November was higher than that of 2019 by 45%, significantly above the Federal Reserve System’s ideal of 2% inflation per annum.
Harbor:
November real estate was good for the Harbor area. At 262 homes, monthly sales volume looked horrible–down 19%–but that seemed really good next to the South Bay wide drop of 23% in home sales. A median price of $812,000, an increase of 3% above October figures, was impressive compared to an approximate drop of 6% in most of the South Bay.
On an annual basis, this November came in with a modest 2% increase over last year. Again, this was a marked improvement over the 0% increase of the South Bay as a whole. Year over year median price was the only market statistic for November home sales the Harbor area didn’t dominate. Both the Beach and the Hill areas showed greater increases, at 6% and 10%, respectively.
Year to date, the Harbor area gives a classic display of capital growth, with a 2% increase in sales volume and a matching 2% increase in median price. Sales have fallen to 21% below 2019 levels, while the median price remains at 40% above 2019.
Hill:
Like the Harbor area, the Palos Verdes peninsula slipped in the number of homes sold compared to last month. With only 45 properties sold in November, the Hill dropped 18% in sales. The median price of $1,990,000 gave an 8% increase over the October median sales price.
Year over year, November residential sales rose 13% above 2024. This was the highest increase in sales volume of the four areas, far exceeding the total South Bay number, which was 0% growth. The Hill also came in with the greatest median price, jumping by 10%.
Looking at the combined activity of January through November, compared to the same period last year, sales volume was up 7%. Median price for the period was up by 1%. Compared to pre-pandemic statistics from 2019, PV home sales were down by 15% year to date, and the median price was up 45%.
Inland:
For November the Inland area dropped in all four metrics, sales volume and median price, for month over month and year over year. The number of homes sold dropped 28% on 102 units. The median price fell 6% to $865,000.
Annually, volume fell 8%, the steepest decline in the South Bay. Compared to last November, the median price was off by 3%.
Year to date remained in positive territory with 0% change in number of sales and a 1% increase in median price. Sales volume continues to be off from 2019, showing a 19% decline. Median price compared to pre-pandemic pricing remains up by 33%.
Beach=Manhattan Beach, Hermosa Beach, Redondo Beach, El Segundo Harbor=Carson, Long Beach, San Pedro, Wilmington, Harbor City PV Hill=Palos Verdes Estates, Rancho Palos Verdes, Rolling Hills, Rolling Hills Estates Inland=Torrance, Lomita, Gardena
Most real estate transactions involve a preliminary title report. This report has details relating to the condition of title for each parcel of real estate. It will verify ownership, reveal any liens and encumbrances and identify easements. These title search elements are found in county property records. Once the information is gathered, it sets forth the conditions for which the title insurance company will issue a title insurance policy. A preliminary title insurance report is usually run once a real property sale opens escrow.
The preliminary report will also outline exclusions that would not be covered under the title insurance policy. The exclusions section of the report is important because it informs all parties of problems before a sale will close. Unpaid taxes, liens, unrecorded easements and judgements will be “clouds on the title” that will have to be resolved prior to change of ownership and before a title insurance policy can be issued.
In the winter, there’s less real estate activity, but that also means that the most motivated buyers will have fewer options — which might just include your home. So, if you’re planning to sell in the winter, it’s important to not get lazy, even if demand is low. Good maintenance is important this time of year, whether you’re selling or not. This is especially true in areas that get snow. Drafts, fogged windows or heating that struggles to keep up can raise concerns quickly. Before listing, service your heating system, seal any gaps around doors and windows and address any lingering repairs.
Once you’re ready to list, make sure prospective buyers actually want to look at your home. Snow or no snow, first impressions matter. Keep walkways clear, salt any icy areas and trim dead branches or leftover fall debris. If you have outdoor lighting, use it to brighten the pathways and highlight your entryway, as shorter days mean buyers may be arriving after dark. Be sure to keep everything clean and clutter free. Winter boots and coats can multiply fast at this time of year, so create a neat entry space and hang any winter clothing out of the way. Fresh rugs, clean floors and organized storage areas will go a long way toward improving your home’s appearance.
Make the inside of your home comfortable as well. Warm temperatures, soft lighting, and subtle seasonal scents help buyers imagine themselves settling in. If you have a fireplace, showcase it. Consider layering throws, arranging comfortable seating and ensuring windows are spotless to maximize natural winter light.
Ten months of data tell a story of Los Angeles South Bay real estate market that has bounced from strong monthly volume increases one month to devastating decreases the following month and back again. Likewise, monthly median prices have ranged from double digit positives to double digit declines.
Both sales volume and median prices suffered the same wild swings early in 2025. As the year progressed, sales statistics have begun to stabilize. For the most part volume and price are now differing from last year predominately in single digits.
Most of those changes are now ending as declines. For the first time this year, October sales volume was down in all four market areas, for a total decline of 7%. Last month volume was down in three of the four, and down across the South Bay, though by a statistically insignificant amount.
Year over year median prices slipped in October for the high end of the market. Homes in the Beach and Hill areas fell slightly. Those in the Harbor and Inland areas rose slightly. With the notable exception of the Beach area, median prices have been falling all year. At this point it looks entirely possible to see the final median price for 2025 fall below that for 2024.
Forecasts from the Federal Reserve hint at another .25% decrease in the prime rate during the December meeting. While such a move has a “feel good” quality, some Fed leaders have said the real problem is a weakening in the employment market. Estimates made earlier in the year are already being revised to show increased unemployment and decreased purchasing power. Either of those alone will impact real estate. Both together could kick off the recession major banks are preparing to face.
Beach:
Compared to September business, home sales at the Beach jumped up 18% in October. For perspective, it should be noted that sales volume was down by 9% in September, after falling 17% in August. While volume increased for the month, the median price dropped 3%, coming in at $1.899,000.
This close to the end of the year, annual comparisons are more meaningful than month to month. The 118 homes sold in October was a 9% reduction from the same month in 2024. Similarly, the median price took a hit, ending a mere $1,000 below last year.
Year to date, both the sales volume and the median price are still up from the first 10 months of 2024. Sales volume is up 14% and the median sales price is up 8%. Both metrics have been deteriorating since the end of the first quarter and are expected to continue downward.
Harbor:
With 322 homes sold in October, the Harbor area experienced a 5% increase in sales volume over September. The area simultaneously registered an inconsequential $2,250 decrease in median price from $795,000 to $792,500.
Sales volume fell 7% from last October after having dropped 3% in September. Sales have declined in four out of the last five months. Despite the lower number of sales, the median price increased by 2% for the month, following a 5% increase in the prior month.
Year to date, home sales in 2025 have lessened each successive month in comparison to 2024. As of October, sales volume this year was 2% higher than it was in 2024. Continued declining sales threaten to shift the market into negative range. The median price for the first ten months stood at 1%. That number too appears to be faltering.
Hill:
October left little question about the real estate market on the Hill. Nearly everything was down—monthly and annual—volume and prices. On sales of 55 homes, volume dropped by 31% from September. The median price of $1,840,000 was 14% below the prior month.
Looking at the same month in 2024 shows 17% drop in the number of homes sold on the Palos Verdes Peninsula, the largest decline among the four areas for the month of October. The median price for the month was likewise the largest decline of the month, dropping 4%.
Through October, sales volume in the Hill area brought a bit of relief with a 6% gain over the same period in 2024. The median price took that respite away as it dropped 1%.
Inland:
Monthly statistics for the Inland area showed the most positive results of the four areas, though they ended mixed. With 142 homes sold, the area had a 20% gain in sales. The volatility of the monthly data came through with a decline of 9%, as the median price fell to $919,000.
Comparing the month of October from 2024 to that of 2025 shows the opposite mix with the number of sales down 1% while the median price rose by 5%.
With 2025 nearing its end, the year to date number is most important. As the year has passed by the outlook for the total year has looked increasingly negative. Each successive month the sales volume has moved toward negative growth, as has the median price. The Inland area was the closest to negative for October with 1% more sales for the period than were recorded in 2024. For the same period, median price in the Inland area has remained 2% above the median for 2024.
Beach=Manhattan Beach, Hermosa Beach, Redondo Beach, El Segundo Harbor=Carson, Long Beach, San Pedro, Wilmington, Harbor City PV Hill=Palos Verdes Estates, Rancho Palos Verdes, Rolling Hills, Rolling Hills Estates Inland=Torrance, Lomita, Gardena