Bœuf a la Bourguignon

First, how does one pronounce that impossible looking name? “Bœuf,” French for “beef,” sounds like a cross between “bif” and “buff.” Say it quickly and you’ll be close enough. “Bourguignon” is bu̇r-gēn-ˈyȯn. Just remember that the letters “g-n” are pronounced in French as though they were “n-y.”

But, you don’t need to pronounce it to love it. This is the dish Julia Child described as”…certainly one of the most delicious beef dishes concocted by man.” This version is considerably simpler than that in Julia’s landmark book, “Mastering the Art of French Cooking.”

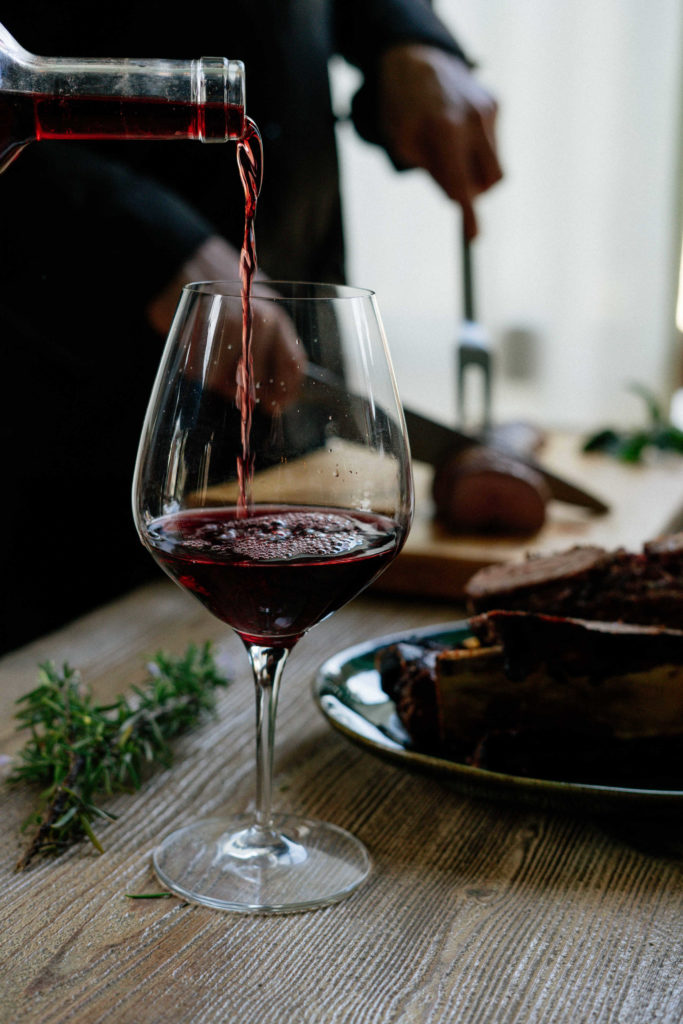
Remember to use a good wine—a bad wine doesn’t improve with cooking.

This recipe can be adapted for a slow-cooker. Before loading up the pot, be sure to brown the ingredients as noted here. All ingredients can be added at the beginning except the mushrooms, which should be added at the end.

Ingredients

  • 3 tablespoons olive oil
  • 3 pounds boneless beef rump roast, cut into 1-inch pieces
  • 12 ounces button mushrooms (trimmed), halved or quartered if large
  • Coarse salt and ground pepper
  • 5 strips bacon, cut into 1/2-inch pieces
  • 1 white onion, coarsely chopped
  • 1 tablespoon tomato paste
  • 2 tablespoons all-purpose flour
  • 3 cups dry red wine
  • 2 cups beef stock
  • 2 bay leaves
  • 4 garlic cloves, smashed and peeled
  • 4 carrots, peeled and cut into 1-inch pieces
  • 10 ounces pearl onions, peeled
  • 1 tablespoon butter, cut into pieces
  • 2 tablespoons fresh parsley, chopped (optional)

Process

  1. Preheat oven to 350 degrees.
  2. In a large Dutch oven or oven-safe pot with a tight fitting lid, heat 2 tablespoons oil over medium-high. Add mushrooms and pearl onions. Cook until browned, about 10 minutes, then set aside.
  3. Season beef generously with salt and pepper and add to pot. In batches, brown beef on all sides, 2 to 3 minutes per batch (adding up to 1 tablespoon oil per batch, if needed); transfer to plate.
  4. Pour off all but 1 tablespoon fat from pot. Add bacon and chopped onion. Cook over medium heat until brown, about 5 minutes.
  5. Add tomato paste; cook, stirring, for about 30 seconds.
  6. Add flour and cook, stirring, 30 seconds.
  7. Return beef to pot; add wine, broth, bay leaf, and garlic. Bring to a boil, cover, and transfer pot to oven; cook 1 1/2 hours.
  8. Add carrots and cook until meat is very tender, 1 to 1 1/2 hours more, adding mushrooms 15 minutes before end of cooking.
  9. Stir butter into stew and serve topped with parsley.

Serve spooned over noodles, rice or mashed potatoes, or even a baguette.

Adapted from Martha Stewart’ version of Julia Child’s quintessential recipe. Wine photo by Lefteris kallergis on Unsplash. Food photo by unknown.

ADUs and Rent Control

We had a call recently asking how California’s new statewide rent cap laws impact homeowners who are supplementing their income by renting out an Accessory Dwelling Unit (ADU). The primary concern was, “Is the owner forced to keep a tenant or pay relocation if they decide to quit renting?”

The question stems from what is called the “just cause requirements” of the new rent control law. Our client was concerned about a decision to evict the current tenant and allow a grandchild to occupy the ADU while attending school locally. If “just cause” applied, it would require they provide relocation assistance to their current tenant.

Renting a part of your home, whether a single room or an entire “guest cottage” may be excluded from the law.

To answer the question, we reviewed the rent cap legislation with an eye to what terms would control should a homeowner need to evict tenants from an ADU.

Applicability of “just cause” relocation assistance, and the rent cap of 5% plus the local Consumer Price Index (CPI) both rely on the same tests.

The first of those tests is the type of property. Multi-family dwellings, i.e., everything from apartment buildings down to duplexes are included in the scope of the law. SFRs though, are excluded, and most importantly, an SFR with an ADU qualifies as an SFR and may be excluded if the second test is also met.

The second test relates to the owner of the property. The following owner types are always included within the scope of the law:
A real estate investment trust, as defined in Section 856 of the Internal Revenue Code.
A corporation.
A limited liability company in which at least one member is a corporation.

The bottom line is that “mom and pop” operations do not fall under the rent cap or the just cause eviction sections of the new laws. There is a caveat! You must notify your tenants!

At the time the lease is signed, tenants should be provided written notice that the residential real property is exempt from this section using the following statement: “This property is not subject to the rent limits imposed by Section 1947.12 of the Civil Code and is not subject to the just cause requirements of Section 1946.2 of the Civil Code. This property meets the requirements of Sections 1947.12 (c)(5) and 1946.2 (e)(7) of the Civil Code and the owner is not any of the following: (1) a real estate investment trust, as defined by Section 856 of the Internal Revenue Code; (2) a corporation; or (3) a limited liability company in which at least one member is a corporation.”

Here is a link to the legislation in question:
https://leginfo.legislature.ca.gov/faces/billCompareClient.xhtml?bill_id=201920200AB1482

Prices Soften in South Bay

Here we wrap up 2019 and prepare for 2020, with a tumultuous election at hand and threats of an economic slowdown rearing in the local news. Our first thought is to look for a baseline from which to measure all the changes. So we did some research and assembled actual sales data from the last few years here in LA’s South Bay. Let’s walk, quickly, past some history.

Through 2015 nearly all real estate only became more expensive. Regardless of where you were in the country, or what kind of property you were considering, prices were only going one direction–up. Then, in 2016 the real estate world started changing. Our little corner of the the west coast is no exception. While some areas stand out as successes, others are showing signs of stress.

Torrance prices in the selected zip codes were varied, ranging from a low of 0% in 90505 for 2018 up to a high of 10.2% in 90503 for 2017. You read that correctly–Torrance prices have not gone negative yet! North Redondo Beach has also run positive every year, though 2019 looks like it will end with a mere .7% increase for the current year.

Hermosa Beach dropped a bit of value last year and is projected to lose again this year.

Manhattan Beach is a star performer, with average sales prices consistently above $2,000,000. Surprisingly, the city with the largest average increases is Hermosa Beach, with a price increase of 27.6% in 2015 and another huge price jump 0f 14% in 2017. Both cities declined in 2018 and 2019. Manhattan Beach was down by -1.7% and -2.6%, respectively. Hermosa Beach dropped by -1.6% and -1.0%, respectively.

Manhattan Beach showed exceptionally strong sales only in 2017, with 7 sales on The Strand. In 2018, prices declined slightly, and are projected to decline slightly in 2019.

While Manhattan and Hermosa were making one or two big jumps, south Redondo plugged away with annual increases between 8% and 10% until 2019. Unless something big happens in the final quarter of the year, 90277 will drop by about -6% this year.

After 4 years of increases, south Redondo Beach is slated to lose ~6% this year.

San Pedro has turned in a solidly positive set of numbers, too. The 90731 zip code is poised to show a 2.0% increase for 2019, down from a high of 7.5% in 2015. The 90732 zip code has slipped into negative territory with a forecast drop of -1.5% this year. Prior years have been over 8% increases, demonstrating the desirability of those harbor and ocean views.

San Pedro‘s 90731 has remained in positive increases to date.

The Palos Verdes Peninsula has proven to be quite a “mixed bag” of ups and downs in average sales prices. Rancho Palos Verdes followed a predictable path of gradual increases up to 6.2% in 2018, with a projected decrease of -2.0% this year. The 90274 zip code was all over the map though. It started with an 8.4% increase in 2015, dropped into negative territory the following year with a -4.7%, then dropped another -.8% in 2017, only to jump up by 8.7% in 2018. We’re currently forecasting a 1.5% increase in those prices for 2019.

five_year_avg_price_movement_percent_90274.jpg
The ups and downs of 90274

If you live in the 90274 zip, and are interested in values, give us a call. We are working on a more detailed analysis of where and why distinct PV neighborhoods are seeing values shift on a differing pace. It’s very possible the age of homes in parts of the 90274 zip has pushed them into a “sweet spot” for upgrade or redevelopment. Alternatively, there could pockets not impacted by the economics of the greater community.

Check your city on the chart above. Are your property values still climbing? Or have they already hit the top and started back down?

Market Analysis – October

We’re here in the final quarter of 2019, looking back and comparing this year to 2018. It’s amazing how similar they have been so far in the year. Let’s take a look at the charts and numbers for the South Bay. Keep in mind these are very small movements, in a market that is about as normal and “middle of the road” as we’ve seen in a long time. I’ve shown the charts in large format, specifically so you can see the monthly movement.

Market trend chart for the year of  2018.

Here we see the movement in listings and sales for the year of 2018. Notice the year starts off just below the center line, showing that overall activity is just barely leaning toward favoring buyers. Activity bumps up once in May, again in July and again a bit higher in August.

Note the chart shows a big jump in activity in December. These numbers are not seasonally adjusted, so these properties did actually move off the market. However, they didn’t sell. At the end of nearly every year the local market drops a big piece of the inventory. Listings that have been sitting for months without selling, and similar year-end cleanups, inflate the number of homes leaving the inventory.

Market trend chart for first nine months of 2019.

Compared to last year, 2019 took off the same, running essentially flat until May, when there is a bump up that matches almost identically the May increase from 2018. Slowing down again in June and ramping up a bit for July then August repeats the activity from last year. As fall comes along, sales slow again for September, just like 2018.

It’s important to remember trend data is designed to point in a direction, as opposed to reporting history. I’ve removed the red trend line from these charts so you can more easily see the individual month changes. If you have questions, or would like to know specifics, don’t hesitate to call.