We’re here in the final quarter of 2019, looking back and comparing this year to 2018. It’s amazing how similar they have been so far in the year. Let’s take a look at the charts and numbers for the South Bay. Keep in mind these are very small movements, in a market that is about as normal and “middle of the road” as we’ve seen in a long time. I’ve shown the charts in large format, specifically so you can see the monthly movement.
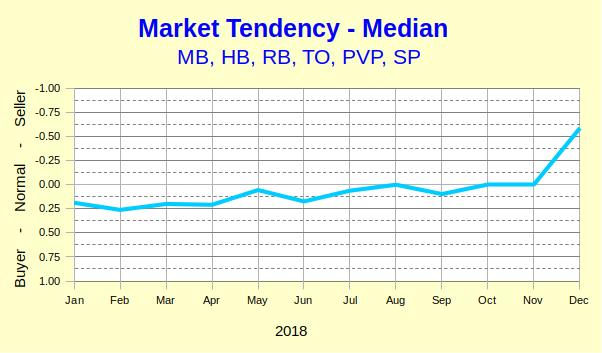
Here we see the movement in listings and sales for the year of 2018. Notice the year starts off just below the center line, showing that overall activity is just barely leaning toward favoring buyers. Activity bumps up once in May, again in July and again a bit higher in August.
Note the chart shows a big jump in activity in December. These numbers are not seasonally adjusted, so these properties did actually move off the market. However, they didn’t sell. At the end of nearly every year the local market drops a big piece of the inventory. Listings that have been sitting for months without selling, and similar year-end cleanups, inflate the number of homes leaving the inventory.
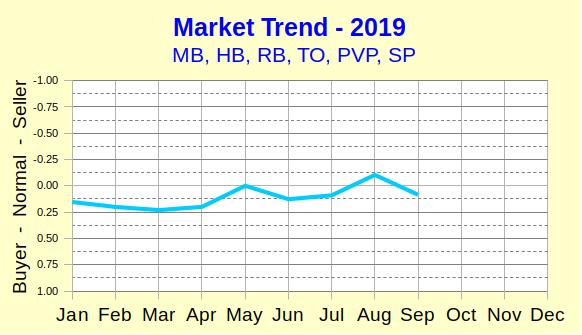
Compared to last year, 2019 took off the same, running essentially flat until May, when there is a bump up that matches almost identically the May increase from 2018. Slowing down again in June and ramping up a bit for July then August repeats the activity from last year. As fall comes along, sales slow again for September, just like 2018.
It’s important to remember trend data is designed to point in a direction, as opposed to reporting history. I’ve removed the red trend line from these charts so you can more easily see the individual month changes. If you have questions, or would like to know specifics, don’t hesitate to call.