South Bay Median Prices Still Climbing

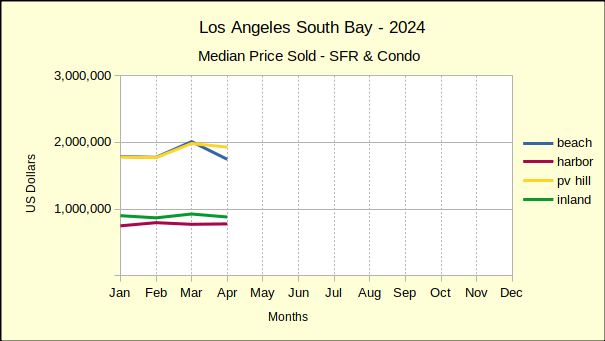
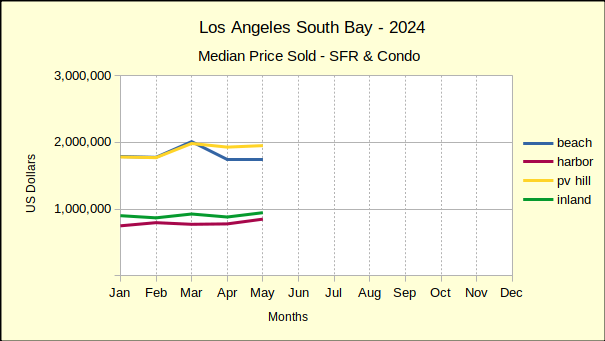
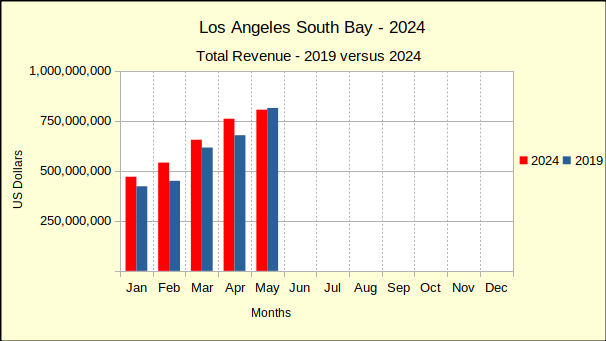
South Bay median home prices are continuing to climb! May versus April showed increases as high as 9% for the month. Comparing May of this year to last May gave increases as high as 18% for the year. Year to date statistics for the first five months of the year came in with increases as high as 11%. Looking at the same five month period from five years ago shows median prices have climbed by nearly 45%.

Mortgage interest rates have roughly doubled from two years ago. The Federal Reserve Bank kept raising rates, hoping to drive inflation down. Unfortunately, it doesn’t seem to be working in the real estate world.

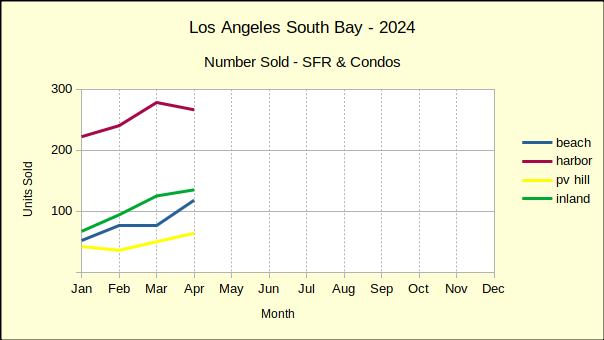
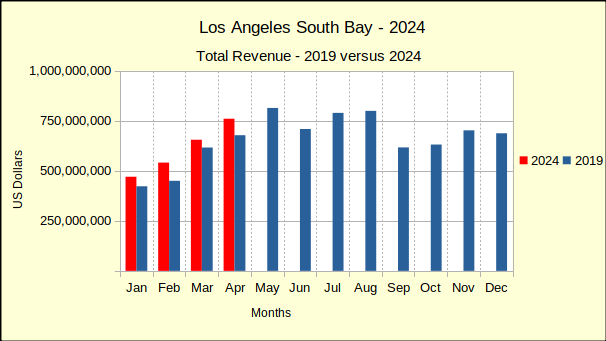
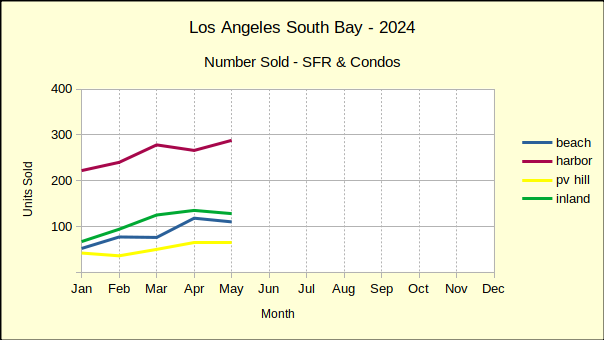
So far this year the interest rate increases have only modestly slowed purchases in month to month data. The number of homes sold in April was 10% higher than in March. May shows a 2% increase in the number of homes sold compared to April. Year over year sales volume shows a greater impact, with an 8% drop from May of 2023 to May this year. Most of that decline was lost this year as home sales for the year to date are up 1% from last year.

Once again looking back five years shows sales are off by 22% across the board from pre-pandemic sales volume. All while median prices are up 45%! But, there are very few homes on the market, and the shortage of inventory is driving price increases, contrary to the Fed goal of slowing inflation.

So why are there so few homes for sale today compared to 2019? And why are prices climbing in the face of mortgage interest rates that have doubled?

One possible factor: During the pandemic mortgage interest rates were at and below 3%. A significant number of existing mortgages were refinanced during the 18 months of the pandemic. Another 17% of currently existing mortgages were purchases at those rates. In summary, about 50% of the current mortgage market is now holding a note with an interest rate that is a fraction of today’s rates. There is essentially no reason for those folks to ever move.

Since about 80% of California homeowners carry a mortgage, and about half of those have an historically low interest rate, about 40% of homeowners have an incentive to stay where they are now, rather than trade up, as would be normal. Given the financial benefits, those homeowners are not likely to put their home on the market and increase the inventory thereby relieving some of the supply and demand imbalance.

Forty percent is a huge piece of the available housing stock to be removed from the market in a time of a housing shortage. Work-related re-locations would have once smoothed this out, but the “work from home” movement has also contributing to the slowing real estate market. The current outlook is for several years of low inventory, further exacerbating the increase in housing costs.

Eventually the inflation of housing prices will come under control and annual increases will get down to something less than 6%. There’ll be no attempt to “dial back” the inflation and return to a prior point in time. So the short term question is, “How do we adjust to the new reality of higher prices, fewer homeowners, and more renters?”

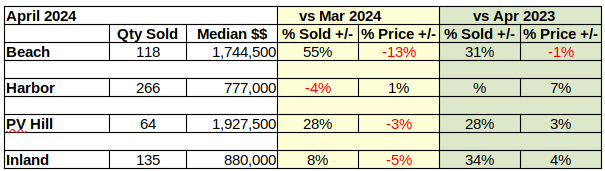
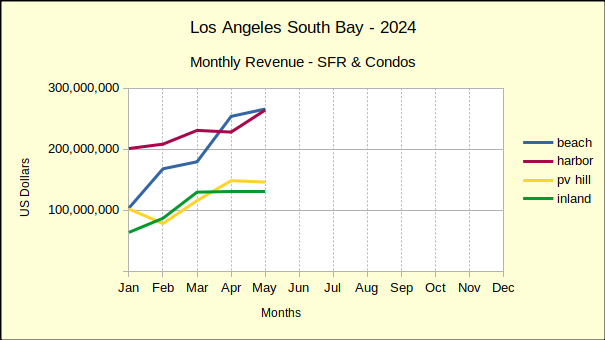
Beach: Anticipate Fewer Sales & Higher Prices

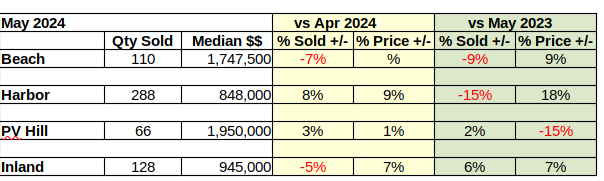
Monthly statistics have been misleading in recent months in all the areas. May activity at the Beach is a great example of the disparities. Compared to April, 7% fewer homes were sold in May with no change in the median price. Contrast that with the annual numbers where sales in May of this year are down 9% from 2023 but the median prices are up 9%.

By looking at data for the year to date, the sporadic ups and downs can be smoothed a bit. This shows a more complete picture of what the market is doing in comparison to last year. In summary, the first five months of the year show a 10% growth in sales for the Beach cities, accompanied by a 6% increase in the median price.

Early projections for June indicate an annual decline from the same month last year sales of over 15% and a price increase of nearly 20% in the Beach area. If these preliminary estimates hold true, there will be some serious hand-wringing among the financial community.

Harbor: More of the Same

Like the Beach area, month to month statistics for the Harbor area have been very volatile this year. The number of sales in May climbed 8%, after falling 4% in April. May’s median price was up 9% following a 1% increase for April.

Year over year, sales volume was down 15% compared to May of last year, while the median price jumped 18%. This follows the general trend of declining sales and increasing prices. Theoretically, the declining sales will induce sellers to reduce their asking price, which will then translate to a reduction in the current inflation rate.

With the year to date sales volume dropping by 5% the interest rate increases would appear to be working. But the increase in median price by 8% for the first five months of 2024 throws cold water on the idea that inflation in real estate is going away.

More of the same is projected for June with a drop of 15% in sales and an increase of 5.5% in median price.

Hill: Sales Volume and Median Prices Up

Only 66 homes sold on the PV peninsula in May, compared to 64 in April, so the 3% increase in sales volume is not terribly consequential. Likewise the 1% growth in median price from $1.93M to $1.95M.

As mentioned in previous articles, activity levels on the Hill are small, so it only takes a minor change to look statistically important. For example, 65 home sales in May of 2023 versus 66 in May of 2024 is only one more home sold, but represents a 2% growth in volume. Even more so, the $2.3M median price from May of 2023, which is an exceptionally high monthly median price in PV under any circumstances, makes the 15% decline to $1.95M look huge in 2024.

In reality, the May median price is actually higher than the year to date median of $1.93M and higher than all but the March median of $1.98M. January through May sales volume is up 4% and the median price is up 11%, very much like the rest of the South Bay.

June sales are projected to decline slightly with a modestly elevated median price.

Inland: Sales Up and Prices Up

From April to May the number of homes sold in the Inland area declined by 5%, much as the Beach area sales volume transacted. Unlike the Beach and PV, where median prices ended barely positive, the median increased by 7% in the Inland area. That hefty increase mirrored the Harbor area lift of 9% month over month in the median price.

A 6% increase in the volume of homes sold and a 7% rise in the median price from May of 2023 to this May deviated from the other areas. It displayed a stronger than expected sales volume, especially considering the Beach and Harbor areas were deeply negative. At the same time the median price showed a slower increase than either the Beach or the Harbor.

Year to date for the first five months of 2024, the Inland area showed an increase of 8% in the number of homes sold, and a solid 6% increase in the median price. All in all, an investment in one of the inland cities would have been a good performer in May.

That investment is projected to still be sound in June, with a small decrease in the number of homes sold and a similar increase in the median price.

Beach=Manhattan Beach, Hermosa Beach, Redondo Beach, El Segundo
Harbor=Carson, Long Beach, San Pedro, Wilmington, Harbor City
PV Hill=Palos Verdes Estates, Rancho Palos Verdes, Rolling Hills, Rolling Hills Estates
Inland=Torrance, Lomita, Gardena

Photo by Tim Cook on Unsplash

The Law of Supply and Demand

South Bay:

Could it be that after several years of insanely steep ups and downs in the real estate market, we’re finally starting to see normal sales levels and prices? One could draw that conclusion after looking at the year to date statistics for the first four months of 2024 compared to last year. Instead of crazy double digit increases and decreases the rate of change has slowed to single digits almost everywhere.

The Beach cities have been the exception with a 19% growth in the number of homes sold through April compared to 2023. That compares to an average across the South Bay of 4% growth. That’s a good sign, but sales are still off by about 20% compared to the same period in 2019, the last year of “normal business” prior to the economic turmoil of the pandemic.

Median pricing continues to escalate also, though at a much reduced pace. For the first four months of 2024, year to date median prices increased in the 5%-9% range. This is a considerable drop from price jumps of as much as 29% seen just a few months ago.

Looking back at the historical data shows that when the pandemic first hit median prices were operating on a relatively normal upward path. Monthly gains were modest fractions of a percent. Then the Federal Reserve slashed the interest rates to keep the economy moving, and the median price shot through the ceiling with monthly increases frequently topping 30%.

August of 2022 saw a price peak and median prices have been falling since. There’s a lot of resistance on the part of sellers, of course. But the sales volume remains low by historical standards, and buyers are demanding price cuts to compensate for the higher mortgage interest rates, if nothing else.

Expect to see mixed results over the coming months as prices and interest rates ebb and flow around a fluctuating political scene, both nationally and internationally.

Beach:

Monthly sales volume took an insane 55% leap at the Beach in April, after having fallen 1% in March. Seeing the median price plummet by 13% for the same period helps to explain the shift. It’s an isolated example of the push and pull of prices and interest rates. Buyers will remain constrained in their ability to purchase, either by rates, or by artificially inflated prices, until sellers reach a “need to move” point where they are willing to reduce asking prices.

Year over year sales show a similar response in the comparison to last April—a 31% growth in number of homes sold against a 1% decline in the median price.

Trends are better demonstrated in the year to date statistics. Looking at the first four months of 2024 and comparing to the same period in 2023 shows the sales volume increased by 19% while the median price increased 5%

Making the same comparison between 2019 and 2024 shows a 32% decline in the number of homes sold this year. Median price is sharply higher by 43%.

Harbor:

The Harbor area appears to be stabilizing ahead of the other South Bay areas. April sales volume declined at the Harbor by 4% versus sales in March, while median prices increased 1%. Smaller monthly movement, especially in price, is essential to reduce inflation and put the real estate economy back on a solid footing. It’s hard to argue that inflation is near 2% annually, while real estate prices are escalating at several times that goal.

Clearly there’s still a ways to go considering the April 2024 volume had zero growth compared to last April, and is still 24% below April of 2019. The median price has a similar issue being up 7% over April 2023, while holding at 44% above April of 2019.

Year to date, 2024 versus 2023, the number of home sales is off by 1% and the median price is up 8%. The elephant in the room is the constantly increasing median price, which is pushing up hard against the Fed’s inflation battle. The price keeps going up because the inventory is exceptionally limited. There were 18% fewer homes sold year to date in 2024 than in 2019. The limited selection compared to the pent up demand pushed the median up some more.

Anecdotally, many pundits point to the extremely low interest rates of the pandemic years as a big driver for the low inventory and bidding wars. Home owners who refinanced to rates well below 5% are reluctant to sell those properties and take up new loans at often double the interest rate. Consequently, homes that would have gone on the market are now artificially being held off the market.

Hill:

As usual, home sales on the Palos Verdes peninsula have been all over the map in recent months. The number of homes sold in April climbed 28% compared to March, when it jumped 39% versus February, when sales dropped 14%. The median price started with 0% change in January and has yo-yoed it’s way through the first four months, ending down 3% in April from March.

While monthly sales statistics are often sporadic on the Hill, comparing April this year to the same month last year, shows a 28% increase in the number of sales and a corresponding 3% increase in the median price.

Year to date numbers for Palos Verdes were more mundane, with the number of sales for the first four months up 5%. In the same time frame, median prices were up by 9%.

Compared to year to date 2019, PV sales volume was down 9% while prices were up 42%.

Inland:

Business in the Inland cities looks very much like business on the Peninsula right now. Month over month sales volume is growing at 8%—that’s positive because the market needs more inventory! At the same time monthly median prices are dropping by 5%—also positive because interest rates are not going back down to the record-breaking levels of the pandemic! Many of the transactions in the Inland area are entry level buyers embarking on their first home purchase. High prices and steep interest rates work against success for both sellers and buyers in that market.

Year over year sales volume increased at 34%, the kind of activity needed to stabilize the local market. Even with that increase in business, the median price pushed upward by 4%, double the Fed target.

Year to date sales volume is up 9% and median price is up 6%.

Wrapping it Up

It’s going to take some juggling to get more sellers onto the marketplace. And it’s going to require coordination with having able buyers there at the same time. Pundits are betting the Fed will engage in “brake-tapping” until after the Federal election. In the months just before the election interest rates will drop enough to encourage sellers to trade up, and allow buyers to qualify for financing. Those steps would enhance the increasing inventory being seen now. Then in the new year the brakes will be applied again to prevent inflation in the spring buying season. Of course, the outcome of the election promises to influence the market under any circumstance.

Beach=Manhattan Beach, Hermosa Beach, Redondo Beach, El Segundo
Harbor=Carson, Long Beach, San Pedro, Wilmington, Harbor City
PV Hill=Palos Verdes Estates, Rancho Palos Verdes, Rolling Hills, Rolling Hills Estates
Inland=Torrance, Lomita, Gardena

Photo by Dez Hester, https://unsplash.com/@dezhester

LA South Bay Gets Hotter!

From the Beach to the Harbor, from Inland to the Hill, the month of March brought an average of 57% more home sales than February! This, after February fell 10% from January, and January was down 30% from December! It’s almost as though spring’s sunlight is breaking through a crack in the Covid wall.

Last March we were seeing healthy spring growth ranging from 8% to 29% in sales volume over the prior month. By comparison this March is in a range of from 42% to 69%. That’s a tremendous jump in sales, and it corresponds nicely with the 35% to 70% annual increase in sales over March of 2020. Rarely do we see year over year sales growth above 35% in any given area, so that level of growth across the South Bay is a strong indicator that we are coming out of the erratic market of the past year.

We need to remember that home sales recorded in March of last year were transactions initiated in February for a Close of Escrow 30 days later. The comparison we’re looking at is the last normal March sales, pre-pandemic, compared to the most recent March sales as we roll into vaccinations en masse. That means they were the final set of “normal” transactions before the Covid pandemic was declared. It also means comparing statistics for this April to last April won’t be terribly useful.

That spike in sales is the “pent up demand” we’ve been hearing about. Circumstances that create a need for people to relocate have continued throughout the pandemic. Simultaneously, sellers have been very reluctant to put their homes on the market and take a chance on contracting Covid-19 from a visiting buyer. Now that threat has diminished, so buyers and sellers are making up for lost time.

We anticipate continued froth in the form of increased prices and bidding wars for the balance of 2021. Gradually everyone will catch up with their real estate goals and things will settle down. There is a good chance most of the price increases will stay with us. That’s a plus for sellers, while buyers will only be hurt by the higher prices.

Prices Skyrocket with Pent-Up Demand

Switching our attention from sales volume to median value, let’s look at how prices have been changing. Year-over-year, the median price came in above last March in the range of 8% to 18%. This is stubbornly high compared to the Consumer Price Index (CPI) of 4.7% for increased housing costs in the Greater LA area during 2020. The last time annual price increases were this dramatic was just before the Great Recession.

When we look a little closer, we’re seeing some weakness in the more current sales prices. Beach and Inland areas both showed big month-to-month improvement over February of this year. The Hill had a more modest 2% increase. The single negative showing in the first quarter, Harbor prices are down -5% for March, despite rising 1% in January and another 9% in February.

As the pandemic ends, we’re seeing a lot of people trying to escape the lease trap (rental prices are going up even faster than sales prices) by taking advantage of historically low interest rates. However, rising sales prices are meeting resistance on the part of some buyers. Possibly because interest rates have starting climbing again. Possibly because the employment picture is still untenable for many.

2021_mar_med_price_chart-1

As the chart above shows, prices for the first quarter are wobbly–a little up and a little down. The Fed is trying to stimulate financial activity to pull our nation through the pandemic by keeping the overnight bank loan rate at near zero. Meantime, the investor market is smelling money and gradually hiking mortgage rates. As the mortgage interest rate edges up, more and more potential buyers are priced out of the market. The first place this shows up is in the entry level market, which is predominately found in the Harbor and Inland areas.

Real Estate for Spring / Summer??

So what’s the forecast for the hottest selling months of the year? The pundits are split about 50/50 on whether the stimulus funding will turn this into a booming economy, or when we emerge from the pandemic, we’ll run smack into a wall of recession.

There is definitely money flowing. The Beach and the Harbor areas show the steepest growth, both adding about $135M in overall sales from February to March.

Anecdotally, there’s a significant percentage of first-time buyers who are now able to qualify for a loan, because of the interest rate. That group is looking at entry level homes throughout the area. Another set of buyers is now able to buy an additional investment property to rent out, because of the interest rate. First time buyers and investors are looking at the same properties and bidding against each other.

As mentioned earlier, April 2020 is when the pandemic blew holes in the economy. Whatever April brings this year, we’ll have to find a new way of looking at it. April and May last year plummeted with drops ranging from 25% to over 50%. Comparisons to last year could be interesting, but most likely uninformative.

Main photo by Barthelemy de Mazenod on Unsplash

55+ Options: Palos Verdes

The four cities of the Palos Verdes Peninsula have two unique senior condominium communities.  Rolling Hills Villas, built circa 2008, has occasional resales.  The newest project on the hill, Sol y Mar in Rancho Palos Verdes, has sold out the first phase and is working on phase 2. If you’ve been considering a move to a 55+ community, give us a call.  We’d love to sit down with you and discuss the pros and cons of down-sizing, and buying versus leasing.  In either case, we show you what’s available to fit your needs in the south bay.


Rolling Hills Villas
901 Deep Valley Dr
Rolling Hills Estates, California 90274

Close to the “top of the hill,” Rolling Hills Villas has 40 condominium units for active seniors, 55 and older.  The association maintains a secure building, with subterranean parking, a rooftop patio lounge and bbq facilities.   Nearby are pharmacies, medical, the Post Office, library, restaurants, cafes, grocery shopping, Norris Theatre, banks & more.

Sales during the past six months totaled two units, ranging in price from $679,000 to $875,000.  At publication time, there were none available, however, that can change at any time.  If we know you’re looking, we can keep you updated on new and future listings.


Sol y Sol y Mar
5601 Crestridge Rd.
Rancho Palos Verdes, CA 90275

In phase two of construction now, Sol y Mar, a 55+ luxury community of ultimately 60 new homes in Rancho Palos Verdes is perched atop the Palos Verdes hill. Spectacular coastal views, great weather throughout the year, an engaging lifestyle, and beautiful homes designed for quality and comfort make Sol y Mar an incomparable place to call home.  Amenities (complete or planned) include: Clubhouse, Fitness Center, Conference Room, Meeting Room, Catering Kitchen, Jacuzzi, Outdoor Patio, Fire Pit, Bocce Ball Courts, and a Dog Park.

Every two-story residence features an elevator; a one-story floor plan is also available.  Plans range from 1,550 to 2,352 square feet.  Each residence includes two bedrooms, up to three baths, a study or flex room and a two-car garage.  Prices vary considerably, based on size, floor plan, selected options, and the view.

MLS sales during the past six months totaled four units, ranging in price from $840,000 to $1,146,000.  At publication time, two units were in escrow in the $825,000-$850,000 price range.  Three units are currently available in the range between $975,000 and $1,700,000.