South Bay Real Estate, Third Quarter Report

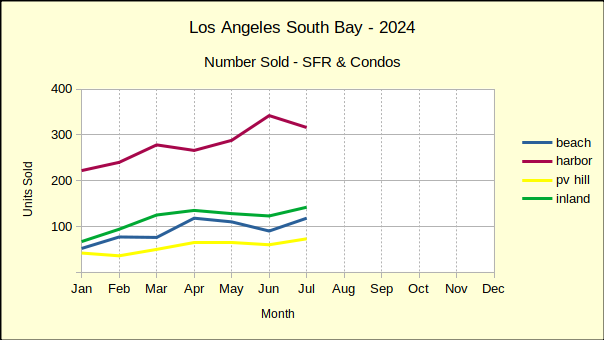
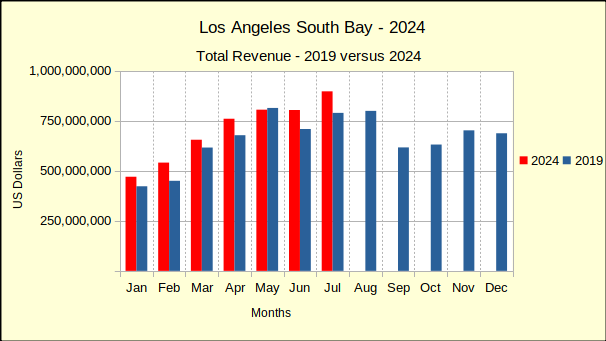
In real estate, sales volume is always a good indicator of market direction, of what buyers are focused on. Looking across this year in the Los Angeles South Bay, with September in the mirror, the number of homes sold each month in comparison to last year, tells a story. The tale starts in January with a healthy 11% increase over January of 2024. In February that number nearly doubled to a 19% increase.

In March the comparison dropped into single digits and through May increases were 2%. 9% and 7%. Buyers were not responding to the homes on the market. Sales were slowing. Then June hit with a zero change and July followed with a -1%—even more slowing. August showed a 10% rebound in sales, frequently attributed to the ‘back to school’ rush of sales closures. For September homes sales dropped back to 0% versus September of 2024.

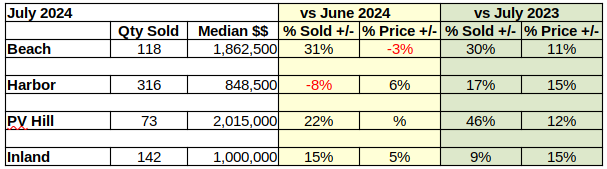
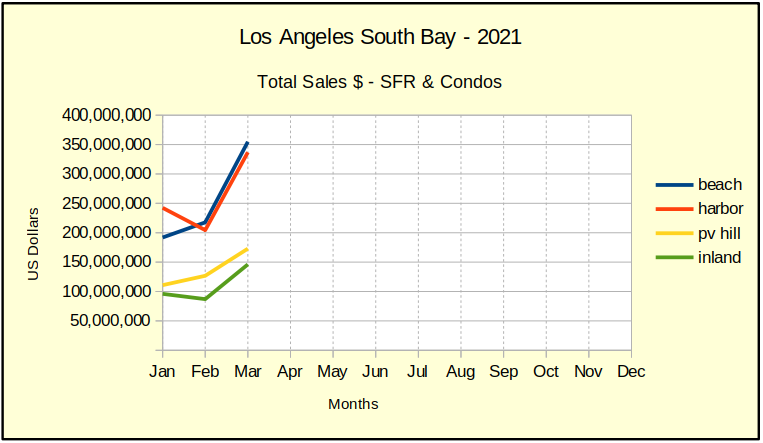
Essentially much of the annualized increase in the first quarter of the year has evaporated. What was a 30% annual growth is now a 6% growth rate. Delving a little deeper into where in the South Bay changes are occurring shows sales declining in the Beach area (detail below) as well as in the Harbor and Inland areas. Last month sales on the Hill were the only positive influence on the broader South Bay sales statistics (detail below).

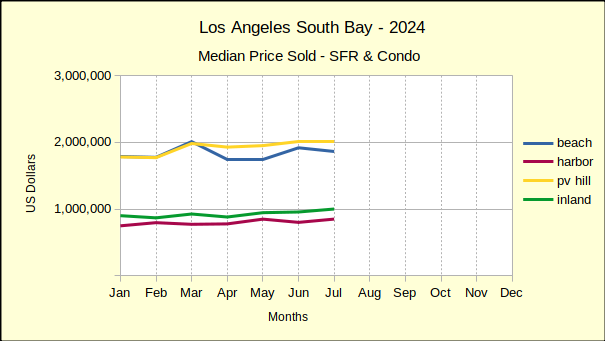
The impact of the slowing homes sales across the South Bay can be seen in the falling prices across the region. September is the first month since January where median prices rose in all four areas. The year started with increases across the board and immediately started losing ground in February with a price decline in the Harbor area. For the next six months median prices slid in more than half the sales recorded, see-sawing back and forth across the four areas.

As of now, with the third quarter of the year complete, median prices are up appreciably only at the Beach. Year to date, compared to the same period in 2024, prices of Beach area homes were 9% higher than last year. However, keep in mind, the other three areas are essentially at zero growth versus 2024. Price appreciation at the Beach has remained stronger than the rest of the South Bay, but appears to be faltering as the year goes on.

So, what should one expect for the balance of the year? Sales are 15%-20% below pre-pandemic levels, while median prices are 30%-50% above. Based on the supposed ideal of 2% inflation, those prices should be around 12.5%, or roughly one third of the increase we’re seeing. At least a few financial CEOs are referring to the current environment as an “asset bubble” in the nature of the 2008 collapse.

A good deal of the price appreciation is a result of lower inventory levels which are not expected to recover until the end of the decade. It remains as a reminder of when interest rates were hovering around 3% and home prices were easily inflated. While many are still riding the wave of inflationary increases, many buyers are balking.

At the same time the economy in general is squeezing the typical home buyer with stubborn mortgage interest rates, an increasing cost of living and shrinking paychecks. It seems apparent something is going to give. Jamie Dimon, of JP Morgan Chase, is reported to have said the market could implode within six months, or could last another two years.

Confining the discussion to local real estate, the market appears to be on course to a point where price resistance causes inventory levels to drop enough to compel sellers to lower prices. Extending the spreadsheet out to the end of the year, while continuing the current trend shows homes sales continuing to decline, slipping to about 4% over 2024 levels for the South Bay as a whole. Median prices at the end of 2025 should be slightly lower than they were in 2024. Probably not by a statistically significant margin, but lower.

Beach:

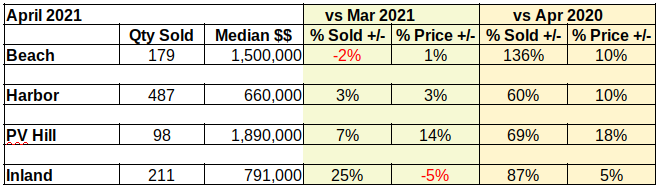
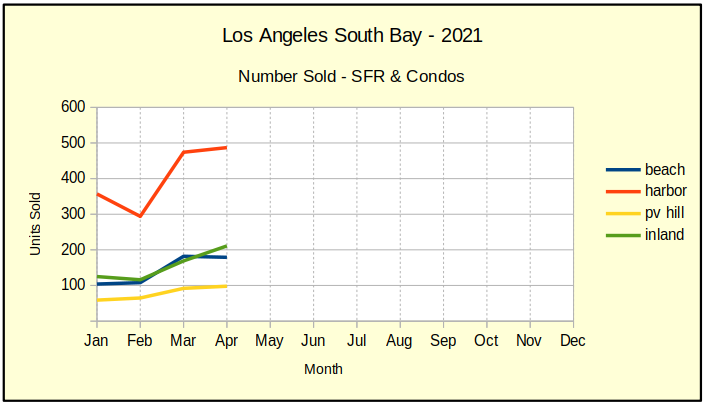
Monthly home sales at the Beach took a 9% hit in September, dropping to 98 units sold. Month to month sales volume has been up and down throughout the first three quarters. While there have been some dramatic swings—like a 40% drop in January, followed by a 70% increase in February—most of the ups and downs have been confined to a much narrower range.

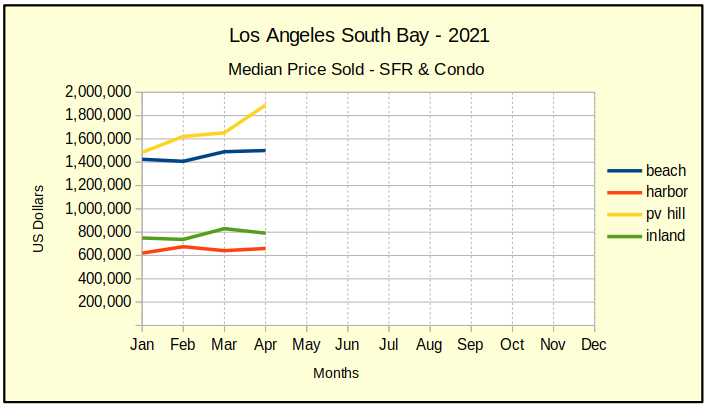
Looking at monthly median prices, September was $1,962,915, up from last month by 5%, the highest gain since it rose 30% in January. Six of the seven intervening months were negative with August being the only other positive month, and that with only a 1% increase.

On an annual basis, September is the first time in 2025 the number of homes sold in the Beach Cities has dropped below same month sales for 2024. Sales volume has dropped several times in month to prior month sales, but this is the first annual decline.

The Beach had been having an unbelievable year, with sales volume increases in the double digits most months. Then, September plummeted from a 15% increase in August to a 14% decline in annual sales. At the same time, median prices repeated the 10% increase experienced in August.

Year to date, through the third quarter, the number of sales stands dramatically higher than the rest of the South Bay. The 17% increase in volume is nearly three times the 6% found across the region. Similarly, the median price at the Beach came in with a 9% increase, while the median across rest of South Bay was 0%. Will the Beach cities continue the out-size performance seen to date? Probably not, but we have three more months to find out.

Harbor:

Monthly sales in the Harbor area dropped 1% in September, falling to 308 homes sold. This follows a 1% increase the prior month. These small monthly swings indicate a stable market, as opposed to the broad double digit sweeps during the early months of the year.

The median price last month was $795,000 up 2% from August. Since the beginning of the year the month to month price changes have all been in single digits and mostly positive. This contrasts sharply with the Beach area, where monthly prices have fallen nearly every month this year.

Year over year, September home sales in the Harbor area dropped 3%. This is effectively a return to the pattern started in June when sales volume began to slide. August was the outlier, up by 7%, similar to the rest of the South Bay in the month before school starts.

Median prices for this September were 5% above last September. It was also the first increase in the median price since June. The median is beginning to look rather flat at the Harbor.

With three fourths of the year gone, the Harbor area appears to be setting the pace for the South Bay. Sales volume has been shifting down since before the summer buying season and currently rests at a 3% increase in the number of homes sold compared to the same period in 2024. Median prices have been moderating, with a year to date increase of 1% over last year at the third quarter.

As an interesting side note, compared to the same period in 2019, sales volume is down 21% (that ten year Covid deficit), and median prices are up 41% (the Covid bubble?).

Hill:

Any conversation about statistics and the Palos Verdes Peninsula needs to start with an understanding that this is a statistically tiny sample and one or two unusual sales can dramatically skew the results. September of this year is a classic example.

Contravening the direction of the rest of the region, September sales on the Hill skyrocketed 36% over August for a total of 80 homes sold. The median price likewise showed a significant increase, jumping 19% to hit $2,143,000.

Comparing this year to last September shows a phenomenal sales volume increase of 70%. This is nearly three times any similar percentage recorded this year. That same upward leap carried across to the median price which came in at a 26% increase; nearly three times any other increase in the region.

Looking at the detail of this anomaly one finds that in a typical September there are somewhere around 60 units sold on the PV Peninsula. Last year there were only 47 homes sold—this year there were 80. Nothing special, just two successive years going opposite directions in a tiny sample.

Despite the scorching monthly numbers, for the first nine months of the the year, Palos Verdes shows a 10% increase over 2024 sales volume. Still a healthy increase, but much more in line with reality. Median price for the year to date is actually a 1% decrease even though the September statistics show increases in the median. Out of nine months, four have been increases while five have been decreases.

Looking back at 2019, the last ‘normal’ year before the pandemic, reveals sales volume is currently 11% above that of 2019 and the median price is up 45%.

Inland:

The Inland cities experienced an 11% sales decline in September, falling to 188 homes sold, after an anemic August increase of only 2%. Yet another indication the residential real estate market is on a downward trajectory. That fall was accompanied by a surprisingly strong 14% increase in the median price, jumping up to $1,006,000. Month to month sales data for the Inland has been relatively consistent so far this year, with ranges often in the double digits.

Looking back to the same month last year shows an 8% drop in the number of Inland area homes sold. This is consistent with the rest of the South Bay, excepting the fluctuating numbers on the hill (see above). The median price, like the South Bay overall, was strongly positive with a 14% increase.

Looking at the Inland area longer term, comparing the first three quarters of 2024 to the first three of 2025 shows a modest increase of 1% in the number of home sales. This is the lowest increase of the four areas in LA’s South Bay. Year to date across the region is a 6% increase in volume. Sjifting focus to the median price, the record shows 0% change, or at best a rounding error in the 2024 versus 2025 median prices.

Once again, looking back to the 2019 baseline, Inland area home sales volume in down 18% from 2019 and the median price is up 33% from 2019.

Beach=Manhattan Beach, Hermosa Beach, Redondo Beach, El Segundo
Harbor=Carson, Long Beach, San Pedro, Wilmington, Harbor City
PV Hill=Palos Verdes Estates, Rancho Palos Verdes, Rolling Hills, Rolling Hills Estates
Inland=Torrance, Lomita, Gardena

Photo by Paul Hanaoka on Unsplash

South Bay Real Estate Bonanza

July brought a bonanza—of sorts—to real estate in the Los Angeles South Bay. Sales volume, which had been falling below last year for three of the last four months jumped up 20%. Granted, July was an unusually slow month in 2023, compared to most years including 2024.

Month over month showed a comparable increase. Total sales volume was up 6% from June to July. The only negative for monthly sales was in the Harbor area where activity was off by 8%.

More importantly, year to date through July, sales volume was up 1% across the South Bay compared to the same period in 2023. With over half the year past already, some growth is a positive sign. This close to November on a presidential election year, one would expect the market to be looking better than it has been.

In fact, The number of homes being sold has still not recovered from the pandemic. Sales this July were 22% fewer than they were in July of 2019! As discussed previously, because the mortgage interest rates were temporarily at rock bottom, about 40% of the homeowners in California currently are “trapped in a mortgage they can’t afford to leave.” This promises to maintain downward pressure on home sales for the better part of a decade. Paradoxically, the reduced inventory is contributing to rising prices.

More homes were being sold in July, and they were being sold for greater prices. Annual increases in the median price were up 15% in entry level neighborhoods. At the Beach and on the Hill median prices didn’t reach quite as high, but were still more than 10% above July of 2023.

Monthly pricing showed the contrast between high end and entry level homes more clearly. In the Beach area the median dropped 3% from June, while on the Peninsula, there was no change in the median price. In contrast, the Harbor and Inland areas rose 6% and 5% respectively over June numbers.

Comparing the first seven months of this year to last year shows inflation continues to plague the real estate economy. Median prices rose in a range between 6% and 9% in the South Bay during the period.

Beach: Highest YTD Sales Volume Increase

Sales in the Beach cities jumped from 90 homes in June to 118 in July for a massive 31% monthly increase. This was matched by a 30% annual increase over July of 2023. Month to month statistics, as well as same month last year comparisons have shown tremendous variability this year.

The rapid fire changes precipitated by the pandemic, and subsequently by the Federal Reserve in an effort to keep the economy under control, created wild swings in the number of homes sold. At the same time the shifts in median price were less frequent and considerably less wide-ranging.

Today, looking at the year to date summaries for both, sales volume and median price, the numbers have moderated greatly. Sales volume at the Beach measured against last year has ranged from negative 27% to positive 33%. That huge range smoothed out to 6% growth in the year to date view.

Likewise, the median price, which has been a bouncing ball, declined 3% from June and increased by 11% over July of last year. Comparing the year to date from 2023 to 2024, the median settled in with a 6% increase for the longer term perspective.

Harbor: Highest YTD Median Price Growth

Monthly sales volume in the Harbor area fell 8% to a total of 316 homes sold in July compared to 342 sold in June. Annual sales moved the opposite direction, rising 17% from July of 2023 to July this year. For the first seven months of 2024 sales have fallen 1% compared to the same period last year.

Median prices had fallen 6% in June and have reclaimed that loss with a 6% growth in July. The new median, $848,500, is a 15% improvement over July of 2023. Year to date the median price is up by 9% in the Harbor area over the same seven month period in 2023.

Interestingly, every month this year has been a growth month for the year over year median price at the Harbor. The lowest increase has been 4% in March and again in June. The highest has been 18% in both February and May.

Hill: Highest Median Price In South Bay

Monthly data for the PV Peninsula came in with 73 homes sold for a 22% increase in volume over June. Annually, sales showed a 46% increase over July of 2023, a welcome change from the 24% drop in June vs June numbers. Year to date sales posted a 4% increase in volume over the same seven months in 2023.

PV registered a 12% annual increase in median price to $2,015,000 in July, so far the highest median in the South Bay for 2024. It doesn’t quite reach the $2,300,000 of May, 2023, but is one of the more impressive months in recent years. The monthly increase from June was negligible, but the timing in 2023 coincided with a downward shift in median sales prices. So, the change shows up as a 8% increase in the year to date median.

Inland: Median Price Hits $1,000,000 First Time

Sales volume for the Inland area jumped in July—up 15% month to month for a total of 142 homes sold, and up 9% since July of last year. Being past the halfway point of the year boosts the value of the the year to date statistics which come in at a mere 2% through July.

At the same time, the July median sales price for the Inland cities climbed 15% above July 2023 and hit $1,000,000 for the first time! Last year’s number was pretty run-of-the-mill so lends some import to this year’s improvement. The 2024 year to date median price calculation supports the strength shown by the monthly and annual numbers with a solid 7% increase over 2023.

Why Use Median?

A brief comment on median price and why it’s often used in real estate: Averages are used for a great many things in making comparisons, and for things that change frequently, averages do a great job. Medians, on the other hand, minimize the ‘jerky’ nature of averages and show directional movement better than a lot of up and down action.

A median is exactly the middle of a group of numbers, so that half are higher and half are lower. So the impact of a single outlier number shows less distortion on the longer term trend line of the values. In other words, it’s easier to see what your investment will likely be worth in 10 years.

Most of us don’t buy houses often enough to care about movement over the last 30 days. We’re interested in staying put for 10 years, plus or minus. The median trend will show us the most likely path.

Beach=Manhattan Beach, Hermosa Beach, Redondo Beach, El Segundo
Harbor=Carson, Long Beach, San Pedro, Wilmington, Harbor City
PV Hill=Palos Verdes Estates, Rancho Palos Verdes, Rolling Hills, Rolling Hills Estates
Inland=Torrance, Lomita, Gardena

Photo catalina_from_wayfarers_chapel.jpg by Carl Clark

April 2021 Real Estate Surprises

As we discussed in this column last month, comparative analysis of real estate between “the year of Covid” and any other year will be relatively meaningless. Starting in August we may have something approaching useful data in the year-over-year category. Until then, the best guidance will come from the month-to-month numbers and paying close attention to buyers and sellers.

The Beach cities is a great example. A 2020-to-2021 comparison of March sales shows an increase of 136%. Compare that to the March-to-April decrease of 2% and we immediately see the dramatic difference. The table below shows how huge the difference is. The year-0ver-year statistics are all skewed way to the high side because there were significantly fewer sales in 2020 than in a normal year.

April 2021 LA So Bay residential sales stats

Moving on to the monthly statistics, let’s look at how the year is shaping up. There was a minor decrease of-2% in the quantity sold at the Beach last month. The rest of the South Bay showed increased sales, with the inland cities showing a big bump up, in addition to a lower median sales price.

Entry level buyers who can now afford to become home owners, due to pandemic stimulus interest rates, make up a big part of those added sales. Another sizable component is made up of investors who can make cash offers, then leverage their investment to do it again.

Slowdown in Volume of Sales

The chart below shows steep growth in the number of homes sold in all areas for March. Sales in the Harbor cities were especially strong. It looked like the bright light at the end of the Covid tunnel. But, in April we see sales level off everywhere except the inland cities. The pent up demand we spoke of last month seems to be easing already.

April 2021 LA So Bay residential sales volume chart

When the volume of sales drops off, there is typically a decline in the price point, too. So far prices have been on the ascendant. The low interest rates kept buyers in the market, and the shortage of homes drove the prices up.

Home buyers are typically most active in the months surrounding school vacation for students. No parent wants to change schools during a regular session. We’re in the month of May, and the sales stats coming out next month will give us a better picture of how much recovery we will see this summer.

Prices Level Out Across South Bay

Like the number of sales, the median prices have flattened and in some cases turned down this month. Palos Verdes homes seem to have taken a strong upward trend with a 14% jump in price. However, looking a little deeper we find there were two exceptionally large sales which combined to create an illusion in the charts. That yellow line should drop back down around $1.6M next month.

April 2021 LA So Bay residential sales median price chart

Considering the rate at which prices have been increasing over the 2020 prices, leveling off is a necessary thing. In each of the first four months of this year, home prices have escalated as much as they would in a normal year. Continuing at this rate threatens us with another “bubble” coming on the tail of Covid-19.

Total Sales Dollars Still Climbing

April 2021 LA So Bay residential total sales $$ chart

Elevated prices combined with increased sales last month to push total monthly sales dollars way up. The chart looks like everything is hunky-dory. If only we didn’t know this is growing out of the disaster we lived through in 2020.

Actually, we’ll be quite lucky if some excessive price increases are the only fallout from the pandemic. We’ve written a number of articles recently on the probability for a rash of foreclosures coming after June 30, when the prohibition of eviction and foreclosure come to an end. Stay tuned and we’ll keep you abreast of the situation as it develops.

LA South Bay Gets Hotter!

From the Beach to the Harbor, from Inland to the Hill, the month of March brought an average of 57% more home sales than February! This, after February fell 10% from January, and January was down 30% from December! It’s almost as though spring’s sunlight is breaking through a crack in the Covid wall.

Last March we were seeing healthy spring growth ranging from 8% to 29% in sales volume over the prior month. By comparison this March is in a range of from 42% to 69%. That’s a tremendous jump in sales, and it corresponds nicely with the 35% to 70% annual increase in sales over March of 2020. Rarely do we see year over year sales growth above 35% in any given area, so that level of growth across the South Bay is a strong indicator that we are coming out of the erratic market of the past year.

We need to remember that home sales recorded in March of last year were transactions initiated in February for a Close of Escrow 30 days later. The comparison we’re looking at is the last normal March sales, pre-pandemic, compared to the most recent March sales as we roll into vaccinations en masse. That means they were the final set of “normal” transactions before the Covid pandemic was declared. It also means comparing statistics for this April to last April won’t be terribly useful.

That spike in sales is the “pent up demand” we’ve been hearing about. Circumstances that create a need for people to relocate have continued throughout the pandemic. Simultaneously, sellers have been very reluctant to put their homes on the market and take a chance on contracting Covid-19 from a visiting buyer. Now that threat has diminished, so buyers and sellers are making up for lost time.

We anticipate continued froth in the form of increased prices and bidding wars for the balance of 2021. Gradually everyone will catch up with their real estate goals and things will settle down. There is a good chance most of the price increases will stay with us. That’s a plus for sellers, while buyers will only be hurt by the higher prices.

Prices Skyrocket with Pent-Up Demand

Switching our attention from sales volume to median value, let’s look at how prices have been changing. Year-over-year, the median price came in above last March in the range of 8% to 18%. This is stubbornly high compared to the Consumer Price Index (CPI) of 4.7% for increased housing costs in the Greater LA area during 2020. The last time annual price increases were this dramatic was just before the Great Recession.

When we look a little closer, we’re seeing some weakness in the more current sales prices. Beach and Inland areas both showed big month-to-month improvement over February of this year. The Hill had a more modest 2% increase. The single negative showing in the first quarter, Harbor prices are down -5% for March, despite rising 1% in January and another 9% in February.

As the pandemic ends, we’re seeing a lot of people trying to escape the lease trap (rental prices are going up even faster than sales prices) by taking advantage of historically low interest rates. However, rising sales prices are meeting resistance on the part of some buyers. Possibly because interest rates have starting climbing again. Possibly because the employment picture is still untenable for many.

2021_mar_med_price_chart-1

As the chart above shows, prices for the first quarter are wobbly–a little up and a little down. The Fed is trying to stimulate financial activity to pull our nation through the pandemic by keeping the overnight bank loan rate at near zero. Meantime, the investor market is smelling money and gradually hiking mortgage rates. As the mortgage interest rate edges up, more and more potential buyers are priced out of the market. The first place this shows up is in the entry level market, which is predominately found in the Harbor and Inland areas.

Real Estate for Spring / Summer??

So what’s the forecast for the hottest selling months of the year? The pundits are split about 50/50 on whether the stimulus funding will turn this into a booming economy, or when we emerge from the pandemic, we’ll run smack into a wall of recession.

There is definitely money flowing. The Beach and the Harbor areas show the steepest growth, both adding about $135M in overall sales from February to March.

Anecdotally, there’s a significant percentage of first-time buyers who are now able to qualify for a loan, because of the interest rate. That group is looking at entry level homes throughout the area. Another set of buyers is now able to buy an additional investment property to rent out, because of the interest rate. First time buyers and investors are looking at the same properties and bidding against each other.

As mentioned earlier, April 2020 is when the pandemic blew holes in the economy. Whatever April brings this year, we’ll have to find a new way of looking at it. April and May last year plummeted with drops ranging from 25% to over 50%. Comparisons to last year could be interesting, but most likely uninformative.

Main photo by Barthelemy de Mazenod on Unsplash