Total Assessed Value = $1.76 Trillion
Before we get into the run-of-the-mill analysis of real estate, let’s look at the real estate market in South Bay from a different perspective. We’ve been using a microscope to zoom in on the details of sales volume and median price in various locations, etc. Pretty traditional stuff.
For a couple paragraphs, let’s zoom out and look back at what has happened to the LA South Bay market over the past few years. I want to take a moment to acknowledge my friend James Allen for prompting me to do some research and analysis along this vein. James is editor and publisher of Random Lengths News in the Harbor area. We trade thoughts occasionally about one aspect or another of local real estate and economy. Earlier this month he asked me what I thought about the recently announced 2021 property rolls for Los Angeles County.
Thank you for asking, James.
Let’s start by saying the primary task of the County Tax Assessor is to establish every year a value for all the property subject to tax in the county. This year the Assessor has given the total value of LA County property as $1.76 trillion.
Not knowing what to expect, first I pulled in the immediately available data from the Los Angeles County Assessor’s new web site. (I noted a couple of inconsistencies along the way, but given the relative size I decided to consider them rounding errors.) I pulled data back to 2006, which includes the “Great Recession.” The result is shown here and discussed below.
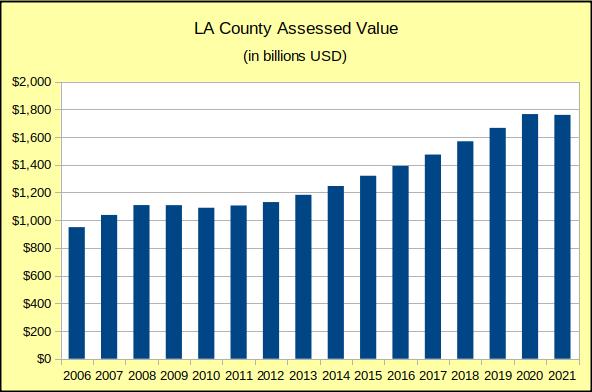
This chart shows the total assessed value, before exemptions, of all property assessed in Los Angeles county. It’s a snapshot in time, taken mid-year corresponding with the tax assessment year. The county has had a steady upward climb with the exception of a flat spot and a shallow trough following the Great Recession during 2007-2008. Taxes are paid in arrears, so the losses didn’t show up until about 18 months later. It took that long to work through the system and show up as a $20B drop in 2010, and then stretch into 2011 and 2012.
The loss of property values following the lending collapse is appears surprisingly shallow. Looking closer at the detail, we see that two of the three primary property value categories offset much of the decline in Single Family Residential (SFR) category. Residential Income (ResInc) values increased .3% and Commercial/Industrial (Comm) values increased .7%, while SFR decreased 1%.
The pattern since 1975 has been that each year the Residential Income category (that’s 5 or more residences in one complex) is stable and brings in about 14% of real property tax revenue. In 1975 ResInc represented 13.5% of real estate values in the County. In 2020 it represented 13.9% of the County value.
The Commercial/Industrial category, which deals in the sale/manufacture of products, has a slightly decreasing percentage of the tax revenue each year. In 1975 Comm property represented 46.6% of taxable real estate value in the County. By 2020 it had declined to 29.2%, about a 17% tax savings for business.
The Residential category represents single family homes and residential complexes of 2-4 units. Commonly termed Residential 1-4, this category has borne an increasing share of the tax burden since 1978. In 1975 SFRs represented 39.9% of taxable real estate in the county. By 2020 homeowners were paying 56.9% of the County’s real property taxes, about a 17% tax increase for homeowners.
Another interesting thing is the strong similarity between 2009 and 2021 relative to the surrounding history. Both years show the market rolling up to the top of the chart, and then taking a slight dip. If 2022 follows the same pattern we should be looking at 12-18 months of flat market followed by several years of steady appreciation.
We do want to be careful here to recognize that there will be adjustments after the fact. Some of these numbers may be changing for years as errors are discovered. Historically, those late changes seldom have a measurable impact.
June 2021 Total Dollars Sold
Continuing the trend of recent months, total sales dollars for residential real estate in the Los Angeles South Bay went up in every area. We saw the slowest growth in the Inland Cities which remained nearly level with dollar volume from May.
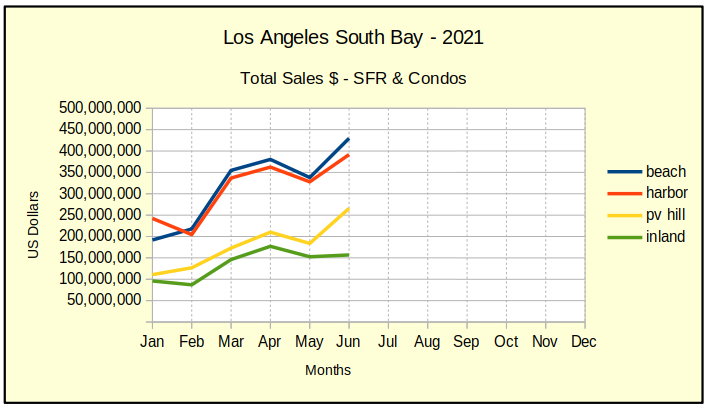
As usual, the Beach and the Hill had the steepest growth incline on the charts. Overall sales activity has been showing strength in the harbor area. Smart money would consider the future potential from both a residential perspective, which is the primary zoning of both San Pedro and Long Beach, but also from the Commercial/Industrial perspective. The Harbor area has one of the largest concentrations of manufacturing in Southern California.
June 2021 Inventory is Rising
June enjoyed a larger inventory of available homes in the South Bay than we’ve seen recently. Earlier this year the shortage of property on the market had reduced listings to as little as two weeks of inventory in some areas.
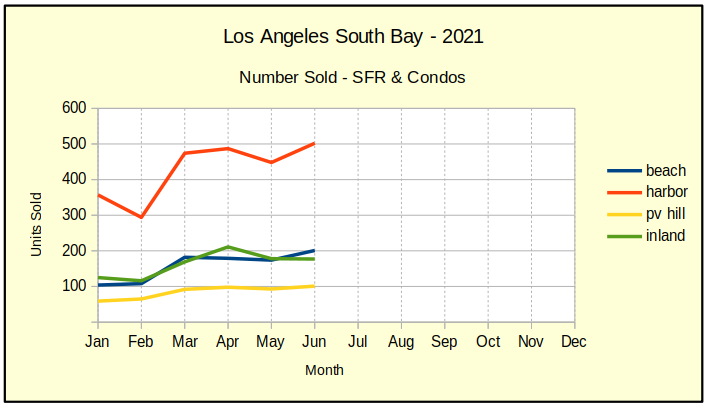
Active listings right now show that if we stopped listing homes today, all available properties in the Inland cities would be sold within 21 days. That’s a far cry from a normal inventory of 5-6 months, but is better than the 1-2 weeks we’ve been seeing. Similarly, inventory levels are up to 24 days in the Harbor area, 30 days in the Beach Cities and 32 days on the peninsula.
As the inventory climbed, June saw a sizable increase in sales. Back in May, every area recorded declining sales, not because no one wanted to buy, but because not enough people wanted to sell. The chart below shows a healthy increase in volume nearly everywhere. Sales dropped a mere 1% in the Inland cities and were up as much as 16% at the Beach.
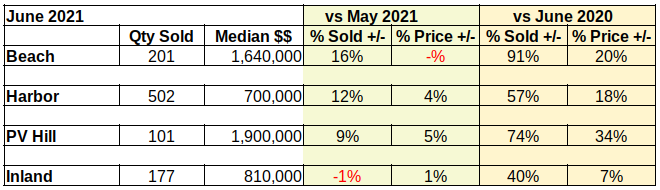
Median Prices are Stabilizing
Let’s face it. Society cannot afford prices that climb 10+ percent in a month. Those are numbers that bespeak failing economies. So, watching South Bay prices level off on the chart below is a good thing. To put perspective on the matter, housing prices traditionally tend to rise at about 4% per year.
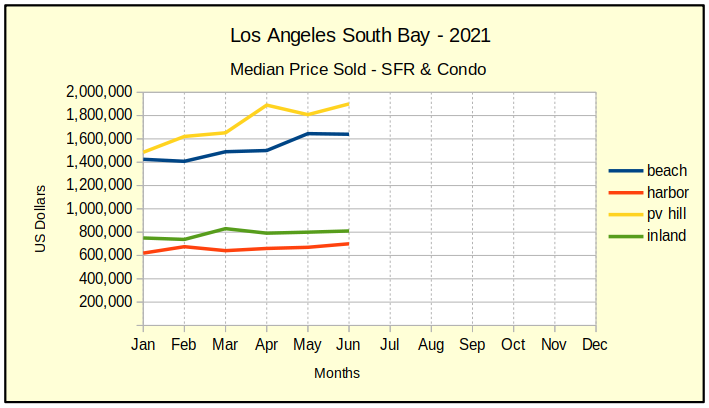
June brought some relief in that the steepest price increase was 5% on the Hill, closely followed by the Harbor area at 4%. (Keep in mind that the Palos Verdes peninsula is a very small market area and subject to more vacillation than the other, larger markets.) The Beach came in with no increase in prices and the Inland cities showed a restrained 1% increase.
Photo by Jingming Pan on Unsplash