The day of the month that you close on the purchase of your home is important and should be part of your contract negotiations. Whether you want to close early or late in the month depends whether you want to save money or ensure the process goes smoothly.
Mortgage interest is paid in arrears. The amount of prorated interest that you will pay at closing will be determined by the day of the month you close. A later date in the month means less interest paid as part of your closing costs. For example, if you were to close on May 30, then you would only pay two days of interest plus the interest due for June. Your first payment wouldn’t be due until July 1.
Because of these savings, 95% of closings occur at the end of the month. What this also means is that title and escrow companies are not as busy near the beginning of the month, and the closing process tends to go a bit more smoothly.
President Donald Trump recently announced a plan to purchase $200 billion in mortgage bonds, also known as mortgage-backed securities (MBS). Trump intends to use cash reserves from Freddie Mac and Fannie Mae to fund the purchase. But what are MBS, and what does that mean for the economy?
The first question has a definite answer. MBS are investment packages consisting of many home loans. This is not unusual; Freddie Mac and Fannie Mae already package together the individual loans sold to them and resell them to investors as MBS. What is not as common is using cash reserves from Freddie Mac and Fannie Mae to purchase already packaged MBS on the secondary market, as Trump is planning to do. This does not mean it never happens — it’s a standard tactic for intervention during financial crises.
So if it’s a strategy for improving the economy during financial crises, that makes it a good thing, right? Well, not necessarily. What’s most important is the signal being sent. The expectation is that purchasing MBS signals higher demand, which would likely result in increased prices on MBS. With increased prices, MBS yield is lower. With mortgage rates being influenced by MBS yield, this theoretically also reduces mortgage rates for homebuyers. But notice that this involves multiple steps, and not all of them are certain. Supply and demand are often treated like immutable laws, but at their core, they are probabilistic models. And when the model doesn’t conform to reality, there can be disastrous effects, such as the 2008 recession that resulted from purchasing subprime mortgages.
So what we need to know is what sort of signal Trump’s $200 billion MBS purchase is likely to send. According to economists at Realtor.com, probably not much of one. $200 billion may sound like a lot of money, but it’s very little in comparison to the trillions of dollars spent on MBS for financial intervention during the Covid-19 pandemic. While many months of significant MBS purchases certainly had a strong positive impact in 2020-2022, a single low-value purchase doesn’t necessarily signal increasing demand, merely a one-time spike. At most, this could cause a small temporary decrease in mortgage rates. This is especially true because investors are humans, not calculators. They may barely notice the small spike in demand, or they may consider it an uncertain investment, since they’re aware it’s a one-time event. All in all, Trump’s $200 MBS purchase probably won’t have a significant effect on the economy.
After a big 7% dive in October sales, annual real estate sales flattened out in November. Compared to November of 2024, the numbers are showing zero change for the Los Angeles South Bay. Sales were mixed across the areas. Median prices were mostly increased, though modestly compared to early in the year.
Downward pressure has increased in both sales and prices from month to month throughout the year. While 2025 continues to exceed 2024 in all metrics for all areas, the margin has grown smaller continually. Anecdotally, the real estate market has been slow and is slowing. This time of year slower sales are expected, though the seasonal slowdown this year seems to be a bit faster than usual. Median prices are not necessarily affected by the season, so the shift in pricing is one more indicator of a slowing real estate market.
Even two decreases in the prime rate by the Federal Reserve has done nothing to help. The most recent drop of .25% actually saw a .125% increase in the mortgage rate the next day.
In a couple weeks the year will be closing out and 2025 will become history. We’ll get the annual wrap-up out to you with a forecast for 2026 as early in January as possible. Enjoy your holidays!
Beach:
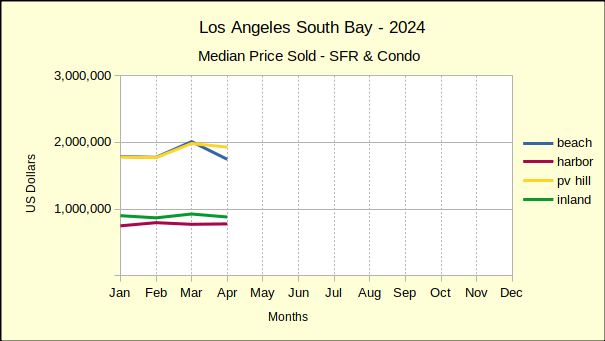
The number of homes sold in November in the Beach area plummeted in comparison to October. Sales dropped 30%, coming in at a mere 81 units. At the same time, the median price dropped to $1,750,000 to register an 8% decline. This is the sixth time this year Beach Cities sales have fallen compared to the prior month, and the eighth time the median prices have done likewise.
November of this year compared to November of 2024 showed mixed results. The volume of sales dropped 2%, while the median price rose 6%. This is the third month in a row annual sales have declined at the Beach. The annual median started in January at 32% increase, and has steadily dropped, falling below 0% four separate months.
With only one month remaining, the year to date numbers show a strong 12% growth in sales and 6% increase in the median price. The sales volume remains 17% below the number of homes sold during the same period in 2019. The median price at the end of November was higher than that of 2019 by 45%, significantly above the Federal Reserve System’s ideal of 2% inflation per annum.
Harbor:
November real estate was good for the Harbor area. At 262 homes, monthly sales volume looked horrible–down 19%–but that seemed really good next to the South Bay wide drop of 23% in home sales. A median price of $812,000, an increase of 3% above October figures, was impressive compared to an approximate drop of 6% in most of the South Bay.
On an annual basis, this November came in with a modest 2% increase over last year. Again, this was a marked improvement over the 0% increase of the South Bay as a whole. Year over year median price was the only market statistic for November home sales the Harbor area didn’t dominate. Both the Beach and the Hill areas showed greater increases, at 6% and 10%, respectively.
Year to date, the Harbor area gives a classic display of capital growth, with a 2% increase in sales volume and a matching 2% increase in median price. Sales have fallen to 21% below 2019 levels, while the median price remains at 40% above 2019.
Hill:
Like the Harbor area, the Palos Verdes peninsula slipped in the number of homes sold compared to last month. With only 45 properties sold in November, the Hill dropped 18% in sales. The median price of $1,990,000 gave an 8% increase over the October median sales price.
Year over year, November residential sales rose 13% above 2024. This was the highest increase in sales volume of the four areas, far exceeding the total South Bay number, which was 0% growth. The Hill also came in with the greatest median price, jumping by 10%.
Looking at the combined activity of January through November, compared to the same period last year, sales volume was up 7%. Median price for the period was up by 1%. Compared to pre-pandemic statistics from 2019, PV home sales were down by 15% year to date, and the median price was up 45%.
Inland:
For November the Inland area dropped in all four metrics, sales volume and median price, for month over month and year over year. The number of homes sold dropped 28% on 102 units. The median price fell 6% to $865,000.
Annually, volume fell 8%, the steepest decline in the South Bay. Compared to last November, the median price was off by 3%.
Year to date remained in positive territory with 0% change in number of sales and a 1% increase in median price. Sales volume continues to be off from 2019, showing a 19% decline. Median price compared to pre-pandemic pricing remains up by 33%.
Beach=Manhattan Beach, Hermosa Beach, Redondo Beach, El Segundo Harbor=Carson, Long Beach, San Pedro, Wilmington, Harbor City PV Hill=Palos Verdes Estates, Rancho Palos Verdes, Rolling Hills, Rolling Hills Estates Inland=Torrance, Lomita, Gardena
Some people sell their houses before buying others, giving them clear budgets for their next places. It makes financial sense, but there’s the risk that you might end up couch surfing or having to rent somewhere in the meantime. Others buy first, locking in their dream homes before they’re snatched up, but that can mean carrying two mortgages at once. So is there a way to eliminate both issues, by both buying and selling simultaneously?
Absolutely. It will take some planning and help from an agent, but you can definitely buy and sell at the same time. The key is timing. Your agent will help align your sale with your purchase. You may have to negotiate a rent-back deal or a flexible closing date. It’s also smart to get preapproved for a mortgage early so you know what’s realistic. And if you need a financial cushion, options like bridge loans or home equity lines of credit can help you cover gaps between buying and selling. It’s something that requires both planning and flexibility on the part of both you and your agent, but it’s certainly a viable option. As an added bonus, it’s also faster than finishing out two separate deals.
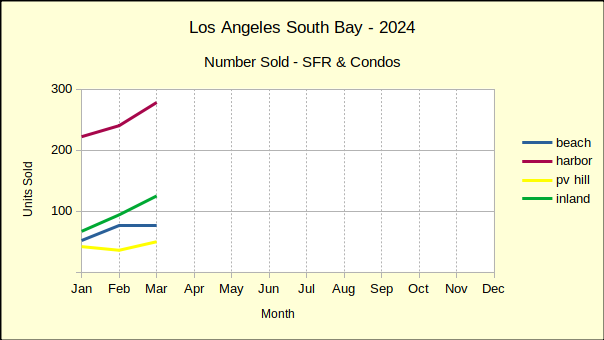
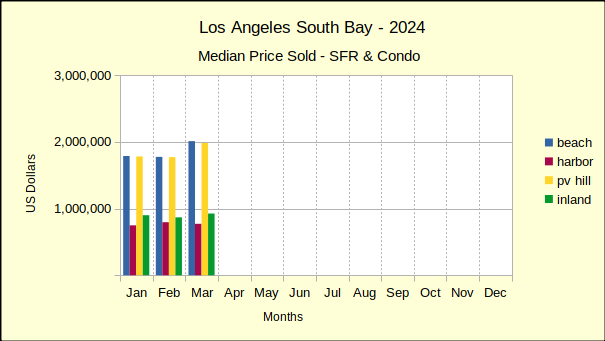
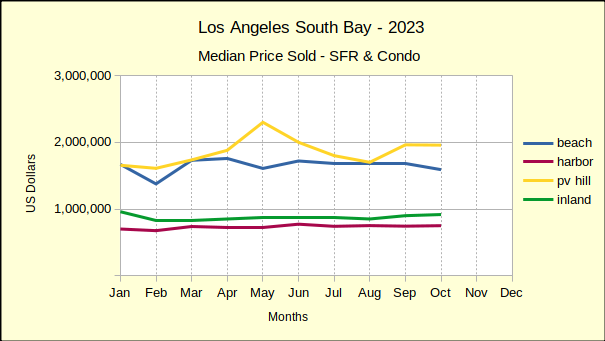
The real estate market in the Los Angeles South Bay kicked off 2025 with an 11% increase in the number of residences sold for January. That increase in sales volume was accompanied by median price bumps that ranged from 0% in the Inland area to 32% in the Beach cities.
Fast forward to May, almost halfway through the year, and the sales volume has dropped to a 7% increase over May of last year. With the number of homes selling declining, the median prices have likewise moved from the positive side to the negative. Comparing the median prices to May of last year shows prices falling in three of the four South Bay areas. Only the Beach cities managed to stay positive with a 9% increase, albeit compared to 32% in January. The other three areas dropped by as much as 8%. (See below for more detail.)
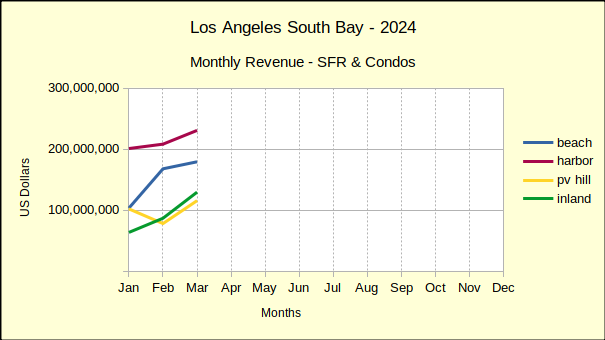
This South Bay Market Snapshot shows where the market is shifting and by how much. It’s designed to help clients understand the direction of the market. Those who watch the market trend will see increasing larger chunks of real estate market are sliding toward recession either in the number of homes sold for a given period, or correspondingly dropping in median price. The mid-year report next month should provide a more definitive comment on the future of local real estate.
Beach: Still Up, but …?
May was not a good month for real estate in the Beach cities, but it was better than last May. The month over month statistics are red ink, with the number of homes sold dropping by 2% and the median price falling 3% from April. Sales volume came in at 122 units, compared to 125 in April. The median price was $1,900,000 down from $1,955,000 last month.
Annual sales volume was more impressive at 11% increase in the number of homes sold. Similarly, the median price at the Beach escalated by a relatively high 9%, compared to the other areas of the South Bay.
Year to date, 541 homes have sold in the Beach area, 25% greater than the first five months of 2024. At $2,000,000 the median price surprises, since the median month to month is only $1,900,000. How could the median for the year to date, be higher? Well, looking at the past few months shows Beach area prices started the year much higher than they are now. In fact, the median in January was $2,355,000—almost $400,000 higher than May. Beach area median prices have been falling every month this year.
Harbor: Sales Slipping, Prices Down
Month over month, sales volume in the Harbor area dropped by 5%, from 310 homes in April to 293 in May. Surprisingly, the median price climbed from $785,000 to $815,000, for a boost of 4%.
Comparing this May to the same month last year gives similarly mixed results, though in reverse. While monthly home sales found May lower than April, annual sales were up 2% from May of 2024. In the same time frame, median prices fell 4% across the year.
For January through May of 2025 the number of home sold rose 6% from last year, for a total of 1373 properties closing escrow. During the same period of time the median price rose 1%, ending at $785,000.
Hill: Sales Solid, Prices Down
Home sales on the Palos Verdes Peninsula for the month of May delivered an increase of 1%, totaling 74 homes. In May, the median price likewise went up, reaching $1,850,000, or 4% more than those sold in April.
Looking at sales volume year over year shows a more varied picture. Last month compared to May of 2024 offers a 12% increase in the number of homes sold. At the same time, the median price tumbled by 5%. One should always be cautioned that with the small number of transactions in peninsula homes, percentages often seem exaggerated, thus it’s important to look at the year to date statistics, too.
For the first five months of 2025 275 homes were sold on the Hill, boosting sales volume by 7% over that of 2024. While the volume came up, the median price went down. At $1,897,000 the median dropped by 2%. It would seem a correction was in the making, though that’s based on memory of other financial “compressions” in recent years.
Inland: Median Prices Continue Down
Monthly sales statistics brought a 12% jump in homes sold in the Inland area. This increase is easily the steepest in the South Bay for May. The next closest rise in sales was the Palos Verdes area with a 1% bump over April volume. The 143 homes sold at a median price of $870,000, a 1% drop from the April median.
The Inland area joined the Hill in yearly sales increases. Both areas registered a 12% jump in volume, coming in at the top, with the South Bay as a whole rising by only 7%. Continuing a trend started in March, Inland median prices once again fell, this time registering the steepest drop across the South Bay, falling 8% below last year’s May numbers.
As the calendar barrels toward mid-year Inland sales volume for the year to date has climbed 5% over 2024 to 575 homes sold. Median prices for the same period rose a very modest $10, settling at $900,000, effectively a 0% increase.
Beach=Manhattan Beach, Hermosa Beach, Redondo Beach, El Segundo Harbor=Carson, Long Beach, San Pedro, Wilmington, Harbor City PV Hill=Palos Verdes Estates, Rancho Palos Verdes, Rolling Hills, Rolling Hills Estates Inland=Torrance, Lomita, Gardena
It looks like the real estate market is finally climbing out of the Covid trough. Each passing month this year has shown red ink, mostly on sales volume, and a lot on median price as well. October brought some relief in that the number of homes sold is up in every area, and median prices are only down in half the South Bay.
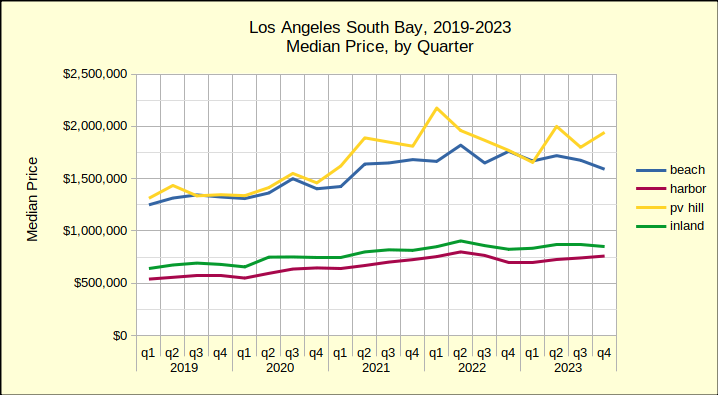
The number of South Bay homes changing hands has varied considerably since 2019. Sales staggered briefly after the spring shutdown in 2020, then recovered mid-year as the interest rate continued down. Rock bottom interest rates pulled in buyers and homes flew off the market with bidding wars. In the final quarter of 2022 sales plummeted and the buying spree ended.
Year
Homes Sold
2019
7,100
2020
8,581
2021
10,279
2022
7,616
2023
6,481
2024proj
6,636
If this is indeed the beginning of a normal real estate market again, it’s possible to see reaching the pre-pandemic sales volume in 2025, but more likely in 2026.
The median price is another story. Interest rates were hovering around 3.5% in spring of 2020. The Federal Reserve opened the money spigot to keep the economy flowing while everyone was locked down. For about 15 months mortgage interest rates were below 3%. Historical data sourced from Freddie Mac shows that rates dropped below 4% starting in June of 2019 and lasting until March of 2022. Nearly three years of sub 4% rates makes the current +/-7% a significant deterrent to buying a new home or trading up.
During that period, buyers took advantage of the low rates to boost their offering prices for homes, creating a sellers’ market and bidding wars. The median price sky-rocketed in 2021 and continued through the first of the next year. In summer of 2022, median prices started falling and dropped until late in 2023. Across the board, median prices have been modestly positive since the beginning of 2024.
Certainly it’s all relative, and the market is adjusting, both on the side of higher prices and higher interest rates. But, with today’s median prices roughly 40% above 2019, the number of buyers who can qualify for the necessary loan is way down. A 2024 Q3 estimate from the California Association of Realtors shows only 15% of households in Los Angeles County can afford the median priced home. That compares to 56% in 2012, which leaves a lot of buyers on the sidelines.
The election is over and the incoming administration is clearly pro-corporate. Over the next couple months the dynamics of the shifting markets will become clearer. By the new year we should have a better understanding of the impact to our local real estate. As of October, declines are leveling off and sales are starting to pick up.
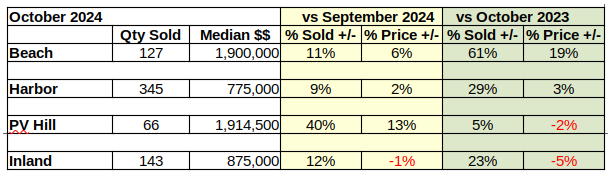
Beach: YTD Sales Up 6%, Prices Up 7%
The number of homes sold in the Beach cities increased by 11% in October, rising from 114 in September to 127. The median price of Beach properties went up from $1,790,000 to $1,900,000, a 6% jump in monthly figures.
Annually, October this year showed a whopping 61% increase in sales over October of 2023, climbing to 127 homes this year versus 79 last year. Over the same one year span, the median price rose 19%.
In view of the huge increase, it’s important to note that October of 2023 is the month mortgage interest rates started toying with 8%, which the buying public simply wasn’t accepting. While lenders and the Fed worked to lower rates, real estate was “in the tank” for last quarter of the year. After the beginning of 2025 the year over year percentages should level out.
January through October, the number of homes sold this year hit 976, 6% more than were sold in the same time period of 2023. Median price at the Beach climbed to $1,788,750 for a 7% increase over last year.
Harbor: YTD Sales Up 3%, Prices Up 4%
October sales in the Harbor area came in at 345 homes for a 9% increase over September. The median price was $775,000, up 2% from the prior month.
Looking at year over year for the same month, this October showed a 29% improvement over the 267 homes sold last year. As noted earlier, home sales took a significant drop in the last quarter of 2023 due to mortgage interest rate hikes. The year over year median price was a much more reasonable 3% increase.
For the first ten months of the year, sales volume has gone up by 3%, to a total of 2,904 homes sold. Over the same period, the median price has jumped up 5% to $778,500.
Hill: YTD Sales Up 2%, Prices Up 5%
On the PV Peninsula, October sales outpaced September by 40%, coming in with 66 homes sold versus 47 the preceding month. It’s important to remember that the Palos Verdes market is the smallest of the South Bay, so a handful of transactions can make a huge difference in either, the sales volume or the median price. The steep increase in sales was accompanied by a more modest increase of 13% in median price, ending the month at $1,914,000.
Comparing October to the same month last year reveals a 5% boost to the number of homes sold. On the other hand, the median price took a fall, dropping by 2%.
Year to date, home sales on the Hill have increased 2%, from 544 in 2023 to 557 this year. For the same ten months, the median price went up 5% to $1,938,750.
Inland: YTD Sales Up 1%, Prices Up 2%
Home sales in the Inland area have been stable, with an increase of 12% in the number of transactions, from 128 properties sold in September to 143 in October. A 1% drop in the median price from last month to this brought the median down from $882,500 to $875,000.
Annual sales in October of this year ended 23% higher than October of 2023. The median price, going the opposite direction, fell 5% from $917,000 last year.
Continuing the relatively modest numbers, the Inland area has risen 1% in the number of homes sold year to date, The 1202 sales reported so far, compare to 1195 sold in 2023. Similarly, the median price is up 2%, having risen from $871,250 last year to $891,245 this year.
Beach=Manhattan Beach, Hermosa Beach, Redondo Beach, El Segundo Harbor=Carson, Long Beach, San Pedro, Wilmington, Harbor City PV Hill=Palos Verdes Estates, Rancho Palos Verdes, Rolling Hills, Rolling Hills Estates Inland=Torrance, Lomita, Gardena
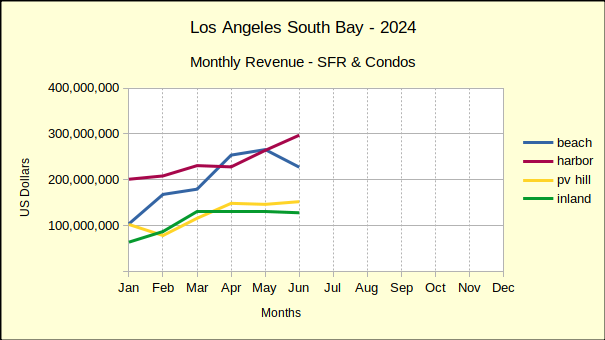
Median prices for real estate around the Los Angeles South Bay have risen over 40% since 2019, the year before the corona-virus pandemic. Comparing the median prices and sales activity for the first half of 2024 shows increases approaching 50% for the five year period in all areas across the South Bay.
Over the same time period, sales volume has plummeted by 22%, falling from 4,022 in 2019 to 3,149 in 2024. The Beach cities have been particularly hard hit with a 34% drop in the number of homes sold during the first six months of the year.
Looking at 2024 versus 2023 shows a similar pattern with median prices up nearly 10% from the first half of last year. The Beach area showed the lowest increases, coming in at 5% above the 2023 median.
Sales volume was off by 2% across the area with the only positive being the Beach at a mere 1% above 2023 numbers. As the 2024 year has progressed, the number of sales has declined in total. Simultaneously, more and more parts of the South Bay have fallen into negative growth.
As of the end of June, 2024 sales figures for all areas were negative in comparison to June of 2023. While the number of homes sold has consistently declined through the first half of the year, median prices have been equally persistent at increasing over last year. Most experts are attributing the increasing prices and decreasing sales to the shift from an ultra-low mortgage interest rate during the pandemic, to a comparatively high rate currently.
When rates were at the lowest, many homeowners took advantage of the opportunity to refinance at the incredible rates. Those folks are now in a position where they would incur a painful increase in monthly living costs if they were to move. That has resulted in about a 40% reduction in the number of homes typically available on the Multiple Listing Services (MLSs).
At the same time, the increased mortgage interest rates have pushed a significant number of potential sellers out of the market because they no longer qualify for the loan they would need to trade up to a larger or newer home. That reduced the available inventory of resale homes even further and became another contributing factor to the bidding wars among the few buyers still in the market.
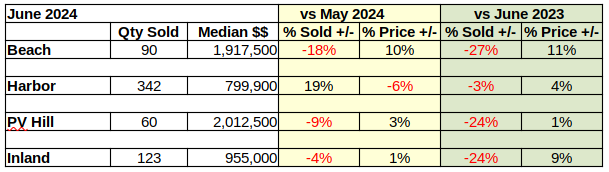
Beach: Down 18% in Sales May to June
Monthly sales volume fell from 110 units in May to 90 homes in June, for an 18% drop. Median price jumped 10% in one month to end at $1,917,500.
Year over year, the number of homes sold declined from 124 in June of last year to 90 this year for a loss of 27%. Median price for the Beach climbed 11% over the year.
Year to date for the first half of 2024 versus the first six months of 2023 shows a modest increase of 1% in sales volume along with a increase of 5% in median price.
Harbor: June Median Price Off by 6%
The Harbor area was the outlier for June. While month over month sales collapsed and pricing jumped for the other three areas, Harbor sales of 342 homes boosted sales by 19%, coming in well above the 288 homes sold in May. Meanwhile, median price went the other direction, dropping from $848K in May to $799,900 in June, for a decline of 6%.
Year over year statistics went the opposite direction, following the rest of the South Bay. Sales volume fell by 3%, dropping from 124 in 2023 to 90 in June of this year. Meanwhile the median price was up 4% for the year, rising from $772,000 last June to nearly $800,000 this year.
The first six months of 2024 brought a year to date sales drop of 4%. The median price in the same period climbed 9%.
Short term changes, as from month to month, have been unpredictable since the pandemic. Looking at the longer term, there is consistency in the declining sales volume and increasing median price. With 2024 a presidential election year, it will be interesting to see how long this direction holds.
Hill: Year Over Year Sales Fell 24%
With a reputation for wildly shifting statistics, the Palos Verdes Peninsula came in with relatively modest decline of 9% from May sales. Similarly, the increase in median price was very tempered at only 3%.
The sales volume for same month last year was anything but mild. June of 2023 reported 79 homes sold versus 60 homes in June of 2024. That’s a 24% drop in volume from last year. While a fourth of the 2023 sales disappeared, the median price eked out a 1% increase, going from $2,000,000 last June to $2,912,500 in June of 2024.
In what is becoming a familiar trend, the year to date sales volume is down 2%, and the median price for the first six months of the year is up 7%.
Inland: June 2024 Sales Drop 24% From 2023
The Inland area showed the smallest month to month change of the South Bay. The 4% drop in sales volume from 128 homes sold in May to 123 in June was minor. Likewise the 1% increase in median price from $945,000 to $955,000.
Like the Hill, the Inland area had a radical drop in sales from June of 2023 to June of 2024. Falling from 161 homes sold last June to 123 sold this June resulted in a 24% drop in transactions. Median price in the same period rose 9%, from $875,000 to $955,000.
Interestingly, there has been no statistically significant change in the sales volume for the first six months of the 2023 and 2024 years. It actually increased by three units from 669 homes sold in 2023 to 672 homes sold in the first half of 2024. For the same time periods, the median price climbed by 6%.
Beach=Manhattan Beach, Hermosa Beach, Redondo Beach, El Segundo Harbor=Carson, Long Beach, San Pedro, Wilmington, Harbor City PV Hill=Palos Verdes Estates, Rancho Palos Verdes, Rolling Hills, Rolling Hills Estates Inland=Torrance, Lomita, Gardena
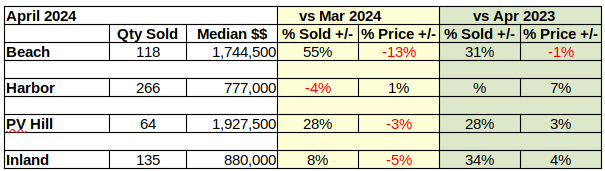
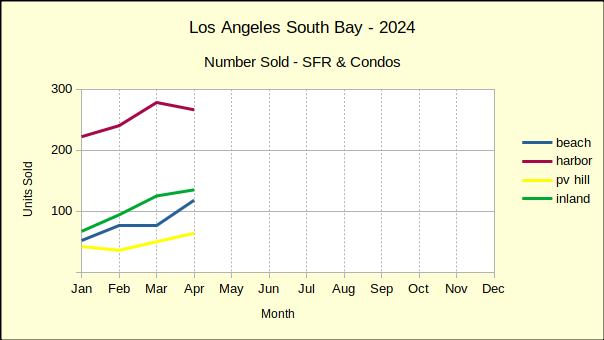
Could it be that after several years of insanely steep ups and downs in the real estate market, we’re finally starting to see normal sales levels and prices? One could draw that conclusion after looking at the year to date statistics for the first four months of 2024 compared to last year. Instead of crazy double digit increases and decreases the rate of change has slowed to single digits almost everywhere.
The Beach cities have been the exception with a 19% growth in the number of homes sold through April compared to 2023. That compares to an average across the South Bay of 4% growth. That’s a good sign, but sales are still off by about 20% compared to the same period in 2019, the last year of “normal business” prior to the economic turmoil of the pandemic.
Median pricing continues to escalate also, though at a much reduced pace. For the first four months of 2024, year to date median prices increased in the 5%-9% range. This is a considerable drop from price jumps of as much as 29% seen just a few months ago.
Looking back at the historical data shows that when the pandemic first hit median prices were operating on a relatively normal upward path. Monthly gains were modest fractions of a percent. Then the Federal Reserve slashed the interest rates to keep the economy moving, and the median price shot through the ceiling with monthly increases frequently topping 30%.
August of 2022 saw a price peak and median prices have been falling since. There’s a lot of resistance on the part of sellers, of course. But the sales volume remains low by historical standards, and buyers are demanding price cuts to compensate for the higher mortgage interest rates, if nothing else.
Expect to see mixed results over the coming months as prices and interest rates ebb and flow around a fluctuating political scene, both nationally and internationally.
Beach:
Monthly sales volume took an insane 55% leap at the Beach in April, after having fallen 1% in March. Seeing the median price plummet by 13% for the same period helps to explain the shift. It’s an isolated example of the push and pull of prices and interest rates. Buyers will remain constrained in their ability to purchase, either by rates, or by artificially inflated prices, until sellers reach a “need to move” point where they are willing to reduce asking prices.
Year over year sales show a similar response in the comparison to last April—a 31% growth in number of homes sold against a 1% decline in the median price.
Trends are better demonstrated in the year to date statistics. Looking at the first four months of 2024 and comparing to the same period in 2023 shows the sales volume increased by 19% while the median price increased 5%
Making the same comparison between 2019 and 2024 shows a 32% decline in the number of homes sold this year. Median price is sharply higher by 43%.
Harbor:
The Harbor area appears to be stabilizing ahead of the other South Bay areas. April sales volume declined at the Harbor by 4% versus sales in March, while median prices increased 1%. Smaller monthly movement, especially in price, is essential to reduce inflation and put the real estate economy back on a solid footing. It’s hard to argue that inflation is near 2% annually, while real estate prices are escalating at several times that goal.
Clearly there’s still a ways to go considering the April 2024 volume had zero growth compared to last April, and is still 24% below April of 2019. The median price has a similar issue being up 7% over April 2023, while holding at 44% above April of 2019.
Year to date, 2024 versus 2023, the number of home sales is off by 1% and the median price is up 8%. The elephant in the room is the constantly increasing median price, which is pushing up hard against the Fed’s inflation battle. The price keeps going up because the inventory is exceptionally limited. There were 18% fewer homes sold year to date in 2024 than in 2019. The limited selection compared to the pent up demand pushed the median up some more.
Anecdotally, many pundits point to the extremely low interest rates of the pandemic years as a big driver for the low inventory and bidding wars. Home owners who refinanced to rates well below 5% are reluctant to sell those properties and take up new loans at often double the interest rate. Consequently, homes that would have gone on the market are now artificially being held off the market.
Hill:
As usual, home sales on the Palos Verdes peninsula have been all over the map in recent months. The number of homes sold in April climbed 28% compared to March, when it jumped 39% versus February, when sales dropped 14%. The median price started with 0% change in January and has yo-yoed it’s way through the first four months, ending down 3% in April from March.
While monthly sales statistics are often sporadic on the Hill, comparing April this year to the same month last year, shows a 28% increase in the number of sales and a corresponding 3% increase in the median price.
Year to date numbers for Palos Verdes were more mundane, with the number of sales for the first four months up 5%. In the same time frame, median prices were up by 9%.
Compared to year to date 2019, PV sales volume was down 9% while prices were up 42%.
Inland:
Business in the Inland cities looks very much like business on the Peninsula right now. Month over month sales volume is growing at 8%—that’s positive because the market needs more inventory! At the same time monthly median prices are dropping by 5%—also positive because interest rates are not going back down to the record-breaking levels of the pandemic! Many of the transactions in the Inland area are entry level buyers embarking on their first home purchase. High prices and steep interest rates work against success for both sellers and buyers in that market.
Year over year sales volume increased at 34%, the kind of activity needed to stabilize the local market. Even with that increase in business, the median price pushed upward by 4%, double the Fed target.
Year to date sales volume is up 9% and median price is up 6%.
Wrapping it Up
It’s going to take some juggling to get more sellers onto the marketplace. And it’s going to require coordination with having able buyers there at the same time. Pundits are betting the Fed will engage in “brake-tapping” until after the Federal election. In the months just before the election interest rates will drop enough to encourage sellers to trade up, and allow buyers to qualify for financing. Those steps would enhance the increasing inventory being seen now. Then in the new year the brakes will be applied again to prevent inflation in the spring buying season. Of course, the outcome of the election promises to influence the market under any circumstance.
Beach=Manhattan Beach, Hermosa Beach, Redondo Beach, El Segundo Harbor=Carson, Long Beach, San Pedro, Wilmington, Harbor City PV Hill=Palos Verdes Estates, Rancho Palos Verdes, Rolling Hills, Rolling Hills Estates Inland=Torrance, Lomita, Gardena
In the first quarter of 2021 buyers and sellers were taking advantage of the artificially low interest rates. Sales were robust and the demand pushed prices up along with the increase in sales volume. By first quarter 2022 sales volume was waning, but sellers were still attached to the higher prices so we saw sales dropping off dramatically. The first three months of 2023 gave us even deeper cuts in the number of South Bay homes sold and brought some corresponding declines in median prices. Today, looking at the South Bay market for the first quarter of 2024, prices are still “sticky” with sellers hoping to hang onto the gains from the Covid years.
It’s not working real well. January gave sellers hope with a strong growth in sales volume and modest increases in median price. February showed returning median price increases and buyers backing off again in response. March is back to the drawing boards as buyers have balked at the price increases in the face of continuing elevated interest rates.
This is coupled with news trickling out of the Federal Reserve Board about how mortgage interest rates are probably not going to see the three rate decreases predicted at the beginning of the year. The latest announcement confirmed that if rate decreases come at all, it won’t be until late in the year and it won’t be significant.
To gain perspective on the impact to the real estate market, it must be noted that the number of South Bay homes sold during the first quarter of 2024 is nearly identical to last year, and is still 19% lower than the first quarter of 2019, the last year of normal business before the pandemic. At the same time the median price of those homes is up almost 10% over last year and is 40% higher than it was in 2019.
Somehow a 40% increase in cost within five years, with a negative demand, seems to be a violation of general economic principles. It appears the post-pandemic adjustment back to normality has digressed somewhere along the path. Of course, all this has been further impacted by the fact 2024 is a presidential election year, and simultaneously the world is in extreme turmoil both economically and physically.
Month by month performance has been unusually erratic for quite some time. So far this year the comparison of this month to the same month last year is the most stable view of the real estate market. According to that view, the number of homes sold has gradually slid into negative territory. January kicked off the year with a blanket increase in the sales volume. February flipped that showing for about half the South Bay. which slid below the sales of last February. March has furthered that negative sales volume to all areas of the South Bay.
Median prices are managing to stay above those of 2023. With sales down across the area and mortgage interest rates stubbornly increasing, that may be changing soon.
Beach: Home Sales Erratic
The Beach cities truly exemplified the erratic nature of month over month statistics during the first quarter. Compared to the prior month, sales in January were down 46%, in February up 48% and in March down 1%. Using the same metrics, monthly median prices were up 13%, down 1% and up 13%.
Looking at the same three months in a year over year method, the statistical movement is much less dramatic. Compared to the same month last year, January sales volume was up 30%, February up 33% and in a surprise drop, March was down 8%. By the same token, median prices were up 7%, up 29% and up 16%.
Disconcertingly, it’s been two years since the pandemic ended and the market is still seeing double digit movement monthly in both volume and pricing. This lack of stability results from several different influences on the real estate market. Among them the continued increase in mortgage interest rates, a corresponding relaxation of qualification requirements by lenders, a public perception of good economic conditions and a continued shortage of homes on the market.
Year to date sales volume for homes at the Beach has increased 13% while median prices have risen by 7% over 2023. Compared to 2019, sales are off by 35% with median prices 43% higher.
Harbor: Up, Then Down, Then Up
Month to month activity for the first quarter in the Harbor area has followed an equally irrational pattern to that of the Beach. January saw sales and prices drop by 13% and 4% respectively. Then February brought increases in both numbers, volume going up 8% and the median price by 6%. March came in mixed with sales volume up 16% while the median slipped by 3%.
Annually, homes in the Harbor area started the year on a positive note with 9% growth in number of homes sold and an accompanying 7% growth in median price. February saw sales decline 3% with an increase in median price of 18%. Sales volume continued to fall in March, decreasing by 8%, albeit with a 4% increase in median price.
Year to date for the first quarter shows the number of homes sold declined by 2%, while the median price increased by 10%. Compared to 2019, sales are off by 16% with median prices 43% higher.
Hill: Sales and Prices Up; Sorta
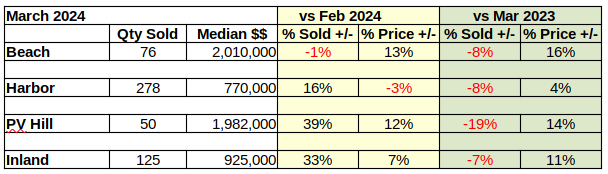
After two months of negative sales volume and falling median prices, home sales on the Hill perked up in March. Volume was up 39% with 50 properties sold and median prices took a 12% jump to $1.982M. As mentioned in the past, properties on the Palos Verdes peninsula, much like those in the Beach cities, represent a smaller segment of the marketplace and often one or two outsize transactions will create a major shift in the statistics.
Of course, that “perkiness” is relative. While the number of homes sold was 39% higher than February, it was still 19% lower than March of 2023 and 25% below March of 2019, the last year prior to the upsets of the corona virus pandemic.
The 19% drop in sales was accompanied by a 14% increase in median price, a contradiction seen around the South Bay and generally across the State. The typically accepted explanation is that many home owners took advantage of the low mortgage interest rates offered during the pandemic. Those people are now unwilling to take on a new mortgage with an interest rate two to three times higher than they are currently paying. This is leaving a much smaller selection of available homes and has created an inventory shortage which encourages competitive bidding among the few buyers active in the market.
The first quarter of the year brought a 3% decline in homes sold on the Hill and an 8% increase in median price. Compared to the first three months of 2019, sales are currently off by 11% and the median is up 36%.
Inland: One Good March
The number of homes sold in the Inland area for March jumped by 33% to 125 closed escrows. Median prices increased a more modest 7% to $925K. Like the Harbor area, there is a comparatively large number homes in the Inland area and they offer a diverse range of prices. As an example, the low sale for this March was $371K while the high was $2.525M. Mathematics is a great tool for analyzing trends in real estate, but if one is planning to buy or sell in this environment, you should call a professional rather than simply applying these statistics.
Compared to the same month last year, March sales volume was down 7%, while the median price was up 11%. Year to date, the sales volume for the Inland area was unchanged, and the median price was up 8%. Similarly, comparing to 2019, sales were down 12% and prices up 40%
As discussed earlier, there’s a tendency for buyer resistance to the combination of higher prices and higher interest rates. Three months into the year, that resistance seems to be growing. Since the most recent Federal Reserve announcement, mortgage interest rates have climbed about .375% (3/8ths of a point). Looking at the statistical trend in conjunction with the increasing interest rate, we anticipate continued slippage in volume and more declines in median price throughout the South Bay.
Beach=Manhattan Beach, Hermosa Beach, Redondo Beach, El Segundo Harbor=Carson, Long Beach, San Pedro, Wilmington, Harbor City PV Hill=Palos Verdes Estates, Rancho Palos Verdes, Rolling Hills, Rolling Hills Estates Inland=Torrance, Lomita, Gardena
In a normal year, the interest rate for a conventional mortgage loan would be lower than the rate quoted for a “high balance” loan, which would be slightly lower than a “jumbo” mortgage. (Here in Los Angeles jumbo is more common than not.) The theory behind the differing rates is one of risk management. Lenders generally consider larger loans to be more risky, thus jumbo costs more.
Guess what! It’s not a normal year. It’s a Presidential Election Year. In addition to the political strife, our nation is closely involved in a couple of economy-disrupting wars in other parts of the globe.
The end result is jumbo loans with fixed interest rates that are as low or lower than conventional loans. Despite headlines touting strength in the economy, interest rates have increased by approximately .5% since the first of the year. The most recent announcements from the Federal Reserve System are hinting that anticipated rate reductions aren’t happening at all in the first half of 2024, and the number of potential reductions is expected to be less than previously expected.
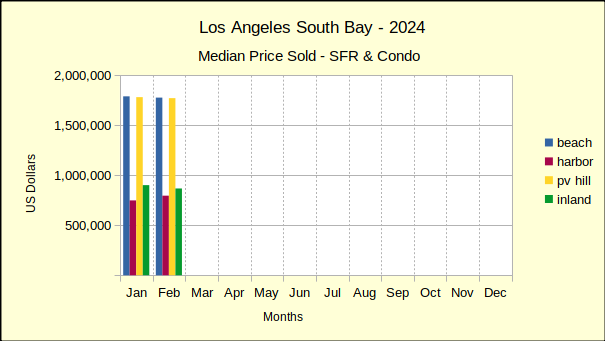
Last year saw median prices in the South Bay falling below 2022 prices through July. In August of last year price declines began to abate. By December of 2023 prices had started to stabilize. The new year continued that trend with only one negative median price result in January. Improving on that, February showed solid growth in prices across the South Bay. The real estate market seems to be reacting to what is touted as an improving economy.
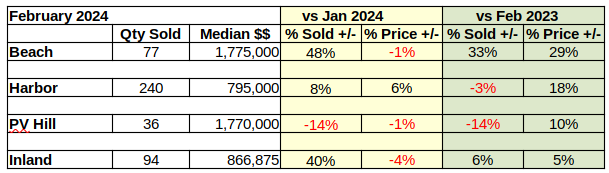
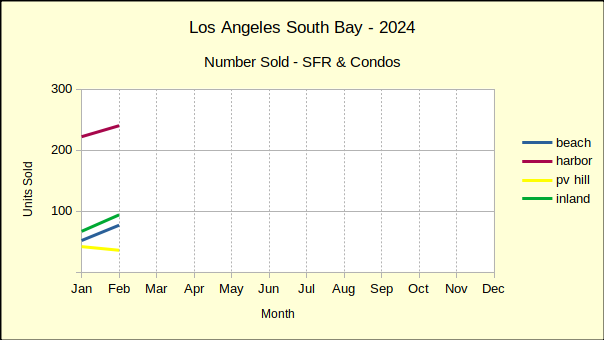
However, compared to last February, sales volume this February was a mixed bag with overall positive growth of 2% despite declines of 3% in the Harbor area and 14% on the Hill. These weaker sales figures follow a strong growth in the number of homes sold in January versus the same month in 2023.
Recent month to month history has shown that a decline in sales volume is typically followed by a decline in median price. This “tit for tat” resonance indicates a market where buyers are at the edge of their ability to buy and sellers are feeling the resistance. Indeed, following the upward movement of mortgage interest rate activity for the first two months of the year leads to the conclusion sales volume will drop, followed by more substantial price decreases in coming months.
Beach: Sales and Prices SeeSaw
On a month to month basis, the Beach area has seen serious ups and downs in the number of homes sold and in the median sales price. January started with a massive 46% drop in sales from December, then February showed up with a 48% increase in sales volume. By way of contrast, Palos Verdes sales were down 16% and down 14% for the same months. The median price for Beach homes slipped 1% in February versus a 13% increase in January.
February sales volume versus February of 2023 was also steeply higher at 33%, the largest increase of the South Bay areas. At $1.175M the median price was up 29% over the same month last year. This is a somewhat surprising median price increase in light of other annual increases around the South Bay falling in the range of 5-18%.
Looking at year to date for the first two months of 2024, the Beach area had positive sales volume of 32% with a median price increase of 17%.
Harbor: More Up and Down
Responding to the volatility of the economy, the Harbor area flipped from negative numbers in January to positive in February. The number of homes sold was up by 8% over the prior month, while the median price of those homes increased 6%. The largest of the South Bay areas, the Harbor area typically has less variability in both sales and prices than the other areas.
Annual figures, looking at change from one year to the next in the same month, is usually a predictor of long term direction. February home sales in the Harbor area seem to be close to the bottom of market. Volume dropped by 3% from 2023, the smallest annual decline since the end of the pandemic.
At the same time, the median price rose 18% above that of February 2023. It should be noted that the median price in the Harbor last February was exceptionally low at $675K. In contrast, the $795K for this year appears to be on the high side and should be expected to moderate as the year goes on.
Year to date, the number of homes sold has increased by 2% over 2023. The median price has gone up 12%.
Hill: Numbers Continue to Fall
Real estate on the Palos Verdes Peninsula was off more this month than last. Month to month sales volume dropped by 14%. Median price, which was flat last month, has fallen by 1% this month. This kind of back and forth jockeying in price and volume looks jerky in the month to month statistics.
When viewed against the backdrop of annual data one can more readily see the direction. Annually, residential sales dropped by 14%, roughly the average of the past few months. While sales volume was dropping, the annual median price rose a surprising 10%.
Combining January and February for year over year numbers shows the number of homes sold increasing by 11% and the median price increasing by 9%
Inland: A Mixed Bag for Sales and Prices
Like the Beach cities, the Inland area enjoyed a huge surge in the number of homes sold for February, after suffering a large drop in sales January. Volume was up by 40% for the month. Median price dropped 4% after an 11% jump last month. So far this year the market has been very unpredictable.
As mentioned early, the “same month, last year” perspective is starting to level out. Residential sales volume for February of 2024 increased by 6% compared to 2023. The median price was up 5% over for the same period. The annual percentage of change seems almost stable by comparison the the monthly.
Year to date, Inland sales have increased 7% while the median price has declined by 1%. So far in 2024, only the Inland median price has declined from the first two months of last year.
Beach=Manhattan Beach, Hermosa Beach, Redondo Beach, El Segundo
Harbor=Carson, Long Beach, San Pedro, Wilmington, Harbor City
PV Hill=Palos Verdes Estates, Rancho Palos Verdes, Rolling Hills, Rolling Hills Estates
There’s a strong tendency to want to pay off your mortgage as quickly as possible. There’s also a strong reason for lenders to not want you to do that — they get less money because you aren’t paying as much in interest. Because of this, they frequently use prepayment penalties. This is an extra fee for paying off your mortgage too quickly or before the term of the loan ends. If you’re simply paying the minimum amount anyway, this won’t affect you, but if you think you may want to pay off your loan early, you’ll want to know your options.
Different states have different laws regarding prepayment penalties, and some don’t allow them at all. In states where they are allowed, they come in two types: hard prepayment penalties, which are fixed fees regardless of the reason for prepayment and that are usually a percentage of the loan amount, and soft prepayment penalties, which are only charged if the borrower pays a large amount in a short time period. Even in states that allow prepayment penalties, not all loans will have them, and you may be able to negotiate with your lender for their removal. When shopping for loans, make sure to read all the terms of the agreement, and talk to a legal professional if there’s anything you don’t understand or want to learn how to negotiate.
You might think lenders would need to do a bunch of fancy calculations to determine how much money you can borrow. There are certainly several factors that go into the final calculation, but if you want a rough estimate, it’s actually relatively simple. Lenders tend to use one of two formulas, either mortgage payment as a percentage of gross monthly income, or debt to income ratio.
Both of these factors involve your gross monthly income — that is, the amount you were paid before deductions from social security and taxes and before making any payments or contributing to savings. Where they differ is what your gross monthly income is compared against. The first method calculates what your monthly mortgage payment would be based on actual interest rate and ensures that it doesn’t exceed 28% of your gross monthly income. The debt to income ratio method compares your gross monthly income against your debts, such as credit card debt and other loans. These existing debts plus your new loan payments should not exceed 36% of your gross monthly income. Both these methods do require knowing the interest rate, which is determined by several factors, but if you know about where interest rates are, you can make an educated guess.
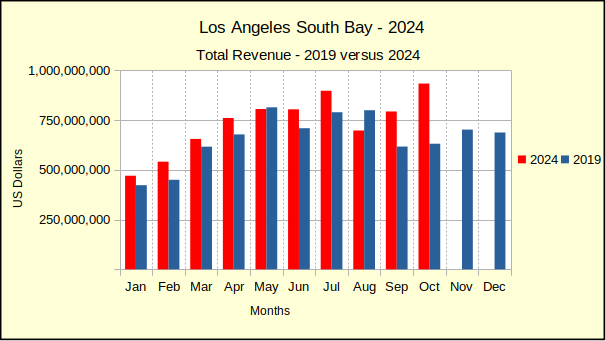
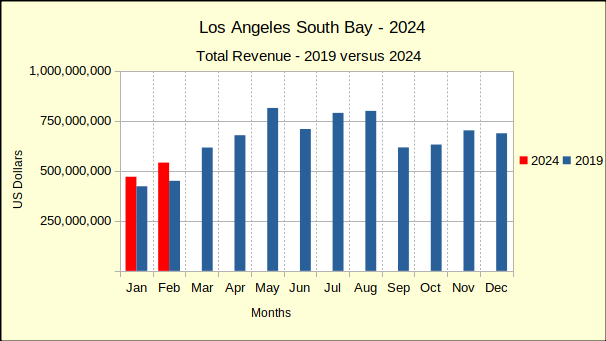
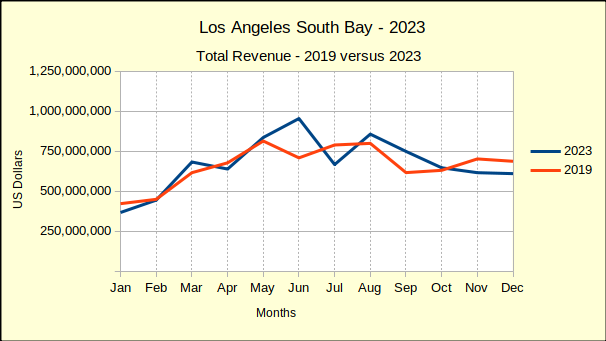
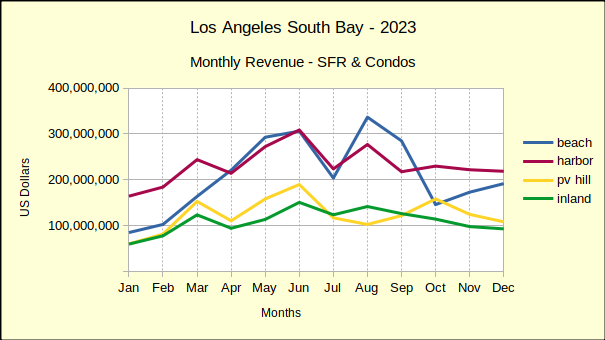
By every measure South Bay real estate failed last year. The volume was down from the prior year in every residential area, the median price fell from 2022 heights everywhere, and the double whammy of crashing sales and falling prices brought the total revenue down from 2022. Judging from early reports the same is true across most of the state.
Part of the story doesn’t read so poorly though. As we look back across the year, the second of half of 2023 was far better than the first half of the year. This in two respects: first, the month-over-month statistics for sales volume have improved. The median price is still falling, but that’s to be expected if we’re going to see a sales volume increase concurrent with continued high interest rates. The market is going to demand that some of the “overly enthusiastic” price increases come back down.
Second, the year-over-year decline in median price is slowing—not reversing—slowing. Roughly speaking, the number of homes sold for less than 2022 prices improved from 83% in the first half of the year to 45% in the second half of 2023. That signifies an approaching balance in the market. Buyers are still holding back, but some sellers are coming forth to meet them.
2024 South Bay Real Estate: Better Days Ahead
We expect to see continued slippage in the median price, accompanied by increased sales volume. The Los Angeles South Bay is somewhat insulated from the vagaries of national and international events, but 2024 is facing an active political climate. The continuing wars around the planet would be enough to rattle economic markets here. This year sellers and buyers also have to factor in a contentious national election.
While the Federal Reserve System is officially apolitical, history has shown a tendency for improved economic conditions during election years. The final quarter of 2023 saw a softening of the wild swings in home sales volume and pricing. With less than 10 months until the presidential elections we anticipate continued easing of interest rates and increased sales activity. Median prices have fallen by about 2% across the South Bay in 2023 and probably won’t drop a lot more in 2024.
Sales volume fell by 15% across the South Bay in 2023. Nearly all of that drop was in the first half of the year. The new year is expected to be positive with growth in sales across the board.
Beach: Strong Sales On Weak Prices
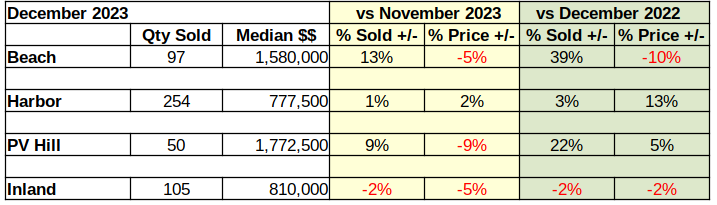
Comparing December to November, the number of homes sold at the Beach was up 13%. That increase in sales is on top of a 9% increase in November, a dramatic turnaround from the 27% drop in October. On the other hand, the month to month median price fell 5% in December.
December of 2023 was similarly mixed when compared to December of 2022. Year over year saw sales volume increase a staggering 39%. Looking back shows December of last year as the absolute slowest month of the year for home sales at the Beach. The median price plummeting by 10% certainly helped generate those December 2023 sales.
Year to date numbers, comparing all 12 months, showed the number of home sales off by 11%. At the same time the median price was down 4% for the year. Much of the annual decline in sales volume occurred in the first half of 2023, when monthly drops of 25%-35% put the brakes on prices. Beach area median prices have taken steep falls since February 2023. It may take a couple more months before the first stimulating news on the interest rate front, but it would appear we’re looking at the “bottom of the market” now. Regardless of whether you’re a buyer or a seller, this is time to reassess your options.
Harbor: Positive Across the Board
December versus November of 2023 saw sales volume go up 1%. During that time the median price went up 2%. Harbor area homes sales dropped precipitously through the third quarter when they suddenly found strength and were positve in the single digits for the last quarter. Monthly declines in median price have been the order until the final quarter when median prices appear to have leveled out.
Looking from the annual perspective, home sales in December 2023 were up 3% over the last month of 2022. Using the same comparison, median prices were up 13%. This suggests the Harbor area may already be seeing improved stability.
Summarizing 2022 versus 2023 for the Harbor area, overall home sales volume dropped 17% for the year. Looking from a longer term perspective, sales have fallen 26% from the ‘pre-Covid benchmark year’ of 2019. From 2022 to 2023 the median price fell 2%. Again over the longer term, median prices in the Harbor area are up 31% over 2019.
Hill: Median Price Down – Sales Up
December home sales increased on the Hill by 9% over November levels. For the same mnthly period, median prices were down 9%. This pattern is expected to shift over the first quarter of 2024 as prices stabilize and interest rates decline to allow more potential purchasers to enter the market.
Compared to December of 2022, December 2023 came in with sales of 22% more homes and a median price increase of 5%. A solid year over year growth for the Hill.
Taking a step back and looking at the full year, sales volume fell 17% from 2022. At the same time, median price fell only 1%.
Inland: Sales and Prices Still Sliding
The last month of the year brought no relief for the Inland area. The number of homes sold continued to decline with sales down 2% compared to November. The median price was down for the second month, this time 5% for the month.
Looking at the same month last year, gives year over year sales volume down 2%,and a median price that’s down 2%. The final quarter of the year has been a rough adjustment period for the Inland area.
In the broader year over year view, the Inland area again fell, with sales volume down 11%. Median price was flat for the period with a tendency toward negative. It’s a transitional period which should resolve into a firmer picture by the spring of the year.
Beach=Manhattan Beach, Hermosa Beach, Redondo Beach, El Segundo Harbor=Carson, Long Beach, San Pedro, Wilmington, Harbor City PV Hill=Palos Verdes Estates, Rancho Palos Verdes, Rolling Hills, Rolling Hills Estates Inland=Torrance, Lomita, Gardena
Every month we compare the level of home sales from the preceding month to the same month of the preceding year. For example, November of 2023 is compared to November of 2022 to determine whether the number of homes being sold is growing or shrinking. The year over year number of homes sold across the South Bay has been shrinking every month since October of 2021–until now. November of 2023 marked the first time since October of 2021 where the number of homes sold increased over the same month in the prior year.
Lest we become overly enthusiastic, we need to remember that at this time last year successful sales figures were plummeting, Closed escrows were shrinking at up to 50% below the prior year in fall of 2022. So a positive value could only mean we’re bouncing along the bottom.
Also on the positive side, there is some improvement in median price which has been shrinking most of this year. At least as of November, it’s looking like “scattered improvement” in the South Bay real estate market.
Beach: Home Sales Pull Out of Dive
After two successive months of declining sales volume and falling median prices November real estate activity brought positive news to the Beach Cities. Last month saw a 9% jump in sales volume over October, and a 4% increase in the median price. The number of homes sold climbed from 79 last month to 86 in November. Concurrently, the median price gained nearly $70K.
The downside was a 3% drop of the median price versus November of 2022. The sold median for last November was $1.700M compared to $1.656M this year. The year over year sales volume gained 8% with 86 sales versus last years 80 transactions.
Year to date remains in red ink with sales down 14% January through November. For the same time period, the median price has fallen by 2%.
Harbor: Volume and Prices Turn Upward
Compared to November of 2022, both sales volume and median price climbed by 7% last month. This is the second month of solid upward figures for residential home sales in the Harbor area. Sales figures for the area have been in red ink since the beginning of the year, so these are welcome statistics for home owners wishing to sell.
On a monthly basis, the number of homes sold in the Harbor area fell by 6%, dropping from 267 in October to 252 in November. despite a median price increase of 1%.
Looking at the longer term, median price for the first 11 months of the year has fallen from $756K in 2022 to $740K, for a decline of 2% in the year to date median price. Sales volume for the same 11 months went from 3,770 in 2022 to 3,076 this year, a decrease of 18%.
Hill: Sales Volume Down, Prices Up
Comparing November of 2023 to November from last year shows a 10% drop in sales from 51 units in 2022 to 46 units this year. Despite the decline in number of sales, the median price for November climbed 19%, going from $1.77M in 2022 to $1.94M this year.
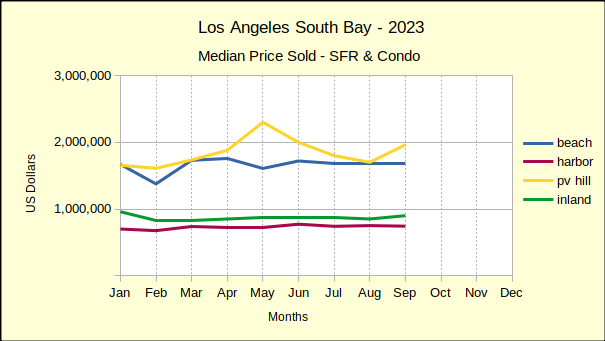
Monthly changes to the median price are much smaller and have been getting smaller as the year progresses. The November decrease was 1%, having dropped from $1.96M to $1.94M. The median price has varied monthly throughout the year. It ranged from a high of $2.3M in May of this year and fell as low as $1.6M in February. Year to date the median for the Hill is up 1% from 2022.
After having risen in September by 14% and in October by 13%, the number of homes sold on the Hill fell by 27% in November. Of course, part of the decline is seasonal. However, month to month sales volume for the first 11 months of 2023 was off by 19% in Palos Verdes with a similar drop of 16% overall for the South Bay.
Inland: Median Price Up from 2022
November 2023 was a good month for the Inland area compared to the same month last year. The number of homes sold climbed 11%, from 96 sold last year to 107 this year. Median price turned upward by 6%, ending the month at $851K, changed from $800K in 2022.
Compared to October of this year, Inland homes sales fell 8%, dropping from 116 homes to 107. That rate of change was slightly higher than the 6% drop across the South Bay. Median prices fell 7% for the month.
Year to date, the Inland area sales volume is off by 12% while the median price is up 1% from the same period in 2022.
Beach=Manhattan Beach, Hermosa Beach, Redondo Beach, El Segundo Harbor=Carson, Long Beach, San Pedro, Wilmington, Harbor City PV Hill=Palos Verdes Estates, Rancho Palos Verdes, Rolling Hills, Rolling Hills Estates Inland=Torrance, Lomita, Gardena
A mortgage buydown is an option to pay an extra upfront fee to reduce your mortgage interest rate. They come in two types: permanent or temporary. Permanent mortgage buydowns last for the entire length of the loan, resulting in decreased interest expenses at the cost of an upfront fee. Temporary buydowns last for a specified length of time, and typically are gradually phased out over the course of the buydown period. However, it’s possible for the upfront fee of a temporary buydown to exceed the interest reduction.
The decision of whether to take a permanent buydown or no buydown is relatively simple and only depends on whether you think you can afford the upfront payment. The decision of whether to take a temporary buydown or not is more complex. At first glance, those with a higher upfront fee than interest reduction can seem like a scam — paying more now in order to pay more over the course of the loan? Seems like a terrible idea. And it would be, if it were you as the buyer paying the upfront payment. However, with temporary buydowns, unlike with permanent buydowns, it’s most often something that the buyer requests that the seller pay for as part of the negotiation process. This way, the buyer gets to pay less in mortgage interest for a short time, and the seller pays extra to guarantee that the sale goes through. And if the upfront fee is less than the interest reduction, the buyer also has the option to pay for a temporary buydown themselves if the seller doesn’t want to.
It can be very attractive to pay off your mortgage early. The reason for this is both financial and psychological. Paying down the principle means you’ll be paying less total over the duration of the loan than if you simply made the minimum payments, since interest is based on the principle, not the original loan amount. It will also give you some peace of mind to know that you no longer have any mortgage payments. But those aren’t the only factors at play, and depending on your financial situation, it may actually be better to keep making steady minimum payments.
Of course, if you can barely afford the minimum payments in your budget as-is, the decision is made for you. However, there could be reasons for someone who can afford to put a bit more towards payments to instead hold onto it. One reason is that mortgage interest payments are tax deductible. You may be paying more in mortgage payments, but paying less in taxes. Whether or not this is in your favor in your specific situation is a question for a tax professional. Another is the effects of inflation: as prices and therefore the cost of living continue to increase over time, as long as you make only minimum payments, the total amount you will have owed by the end of your mortgage doesn’t change at all. That means the amounts for payments made towards the end of the loan’s life tend to have lower value in terms of purchasing power, and may be less of an economic burden than other payments you may need to make.
The latter reason doesn’t mean much if you aren’t spending the money on something else, but there’s a good chance you should be. Savings funds, such as retirement funds, and investments both require money to be put into them to gain a profit later. If you don’t have money to invest, you won’t get any in return. Even holding onto the money can be useful, in case it’s needed for emergencies, or a very good investment opportunity crops up.
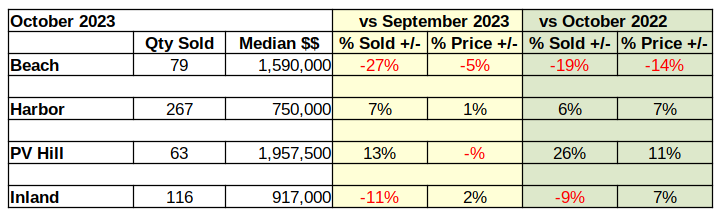
Home sales on the Palos Verdes Peninsula chalked up an impressive set of statistics in October. Comparing the October 2023 sales to October of last year showed a stunning 26% increase in sales volume beside an equally impressive 11% increase in median price. At the opposite end of the spectrum the Beach Cities October sales volume fell 19% from 2022, while the median price dropped 14%.
Elsewhere across the Los Angeles South Bay volume and prices were mixed with the general trend leaning toward decreased number of homes sold and prices struggling to stay level with last month while often slipping below.
Year To Date Sales Continue to Drop
In between the highs and the lows real estate activity in the South Bay has been mixed for the months of August through October. While many commentators are cautiously hopeful, it must be noted that year to date comparisons continue to show significant declines in the number of homes sold, with an average drop of 18% from 2022 for the first 10 months of the year. Likewise, median prices are falling for the January through October time frame. For example, median prices on the Hill were up in October, but have fallen 4% year to date compared to last year. Similarly the Beach area median is down 3% and the Harbor area is off 2%.
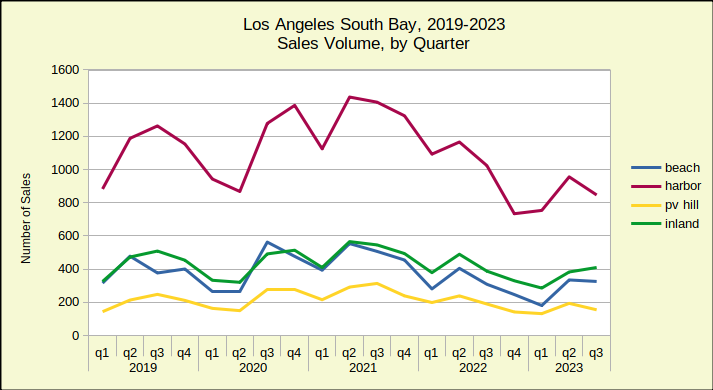
Sales volume is clearly down. By this time in 2022 sales were at 6700 units versus 5500 this year. Many buyers have been “priced out of the market” and many sellers are resisting the idea of “prices going backward.” The result has been a lot of deals not being made.
Year to date, the deals that have been consummated are still generally at median prices above last year, however the most recent three months have shown at least half of sold homes required price reductions to make the sale. With winter setting in, we expect continued reductions in both the volume of sales and in the prices of sold homes.
Home Sales at the Beach Hit a Wall
Throughout the year real estate in the Beach Cities has maintained spotty growth. Sometimes median prices improved, sometimes sales volume. But, October brought a wall of red ink for the Beach. Month over month sales volume plummeted by 27%, while the median price dropped 5% from September when it was flat at $1.7M.
Year over year transaction volume dropped 19% from September of 2022. The median price fell 14% for the same period.
Looking at the year to date statistics showed more declines with sales volume for the first 10 months of 2023 coming in 16% below that of 2022. At the same time, the median price was off by 3%.
In prior downturns the Beach area has been among the last to respond to market negativity and one of the first to recover. If the pattern repeats, sales at the Beach will continue to show predominately negative numbers for the late fall and winter months. Most chroniclers project a return to positive market conditions in late 2025 or early 2026 in general.
Harbor Volume and Prices Turn Upward
Home sales in the Harbor area moved from all negative last month to mostly positive this month. Sales volume on a monthly basis jumped from 24% down in September to a 7% increase in October. Similarly, the month to month median price went from -1% to +1% in October.
Annually, the number of homes sold in the Harbor area increased by 6%, a significant change from having fallen 26% in September. The median price came in at $750K, up by 7%.
That’s only the second time this year the Harbor area median price has come up into the positive range when compared to 2022. Overall, the year to date median sits at $739K, 2% below last year’s number of $756K. Sales volume for the Harbor is off 20% year to date. The number of homes sold for the first 10 months is 2824, compared to 3535 in 2022.
Palos Verdes Homes Star in October Sales
Home sales on the Hill came in at 63 homes sold with a median price of just under $2M. Month over month that represented a 13% growth in sales volume and no measurable change in the median price.
On an annual basis October sales were up 26% over the same month in 2022. This year’s median price was up by 11% over last October.
While these numbers reflect impressive growth it’s important to remember that the number of transactions on the Palos Verdes peninsula is quite small, which results in some dramatic percentile shifts. For example, the annual percentage of change in the median price so far this year has ranged from a low of -29% to a high of 17%. By comparison, the Harbor area where monthly transactions number in the hundreds, has an annual range from a low of -11% to a high of 7%.
On a year to date basis, the Hill showed a more common face with the January through October sales volume down by 20% from 2022. During the same time frame median prices fell by 4%.
Inland Area Sales Volume Down, Prices Up
In a surprising turn of events, the Inland area has shown an increased median price for both the monthly and for the annual sales figures. The median price came in at $917K this October, which was 2% above the September median. On an annual basis, the median was up by 7% over the $860K of October 2022.
With 116 units sold for the month of October this year, the sales volume was 11% lower than it was this September. The monthly decline was even greater than the drop of 9% for the year over year comparison to last October.
Year to date, the Inland area has outperformed the balance of the South Bay on median price and on sales volume. For January through October there is no discernible change to the median price from 2022 to 2023. In the same time frame the sales dropped by 14%, the smallest decline of the local areas.
Beach=Manhattan Beach, Hermosa Beach, Redondo Beach, El Segundo Harbor=Carson, Long Beach, San Pedro, Wilmington, Harbor City PV Hill=Palos Verdes Estates, Rancho Palos Verdes, Rolling Hills, Rolling Hills Estates Inland=Torrance, Lomita, Gardena
In September, the share of homebuyers paying all cash was 34.1%. This is the highest it has been since the beginning of 2014, and an increase of 4.6% from September 2022. However, this doesn’t mean homes are more affordable; in fact, it’s the opposite.
While it’s true that a significantly higher share of buyers are paying all cash, there are much fewer sales overall. Total sales decreased by 23% over the past year. Compare this to a decrease of only 11% for all cash sales. Cash sales aren’t going up, rather sales overall are going down, and cash buyers are less affected.
The reason for this is high interest rates, since cash buyers don’t care what the interest rate is for a mortgage loan they aren’t getting. Interest rates fluctuate up and down on a daily basis, but rarely change by much at a time. But in this case, they hit a two decade high in September at 7.2 and then continued an upward trend into October, almost reaching 8%. As of last week, they had started to drop back down. Despite this decrease, with how erratic rates can be, that isn’t a sure sign that rates are now trending downward.
The summer selling period for real estate in the South Bay showed mixed results for August and September. July was down across the board, but both the volume of sales and the median price was able to rebound in some areas. Notably, the Beach Cities come out of the third quarter with median prices up by 2% over last August, and up by 3% over September of 2022. That growth wasn’t enough to make up for earlier this year when median prices were down by as much as 17% in year over year sales.
Year To Date Prices Down Across the South Bay
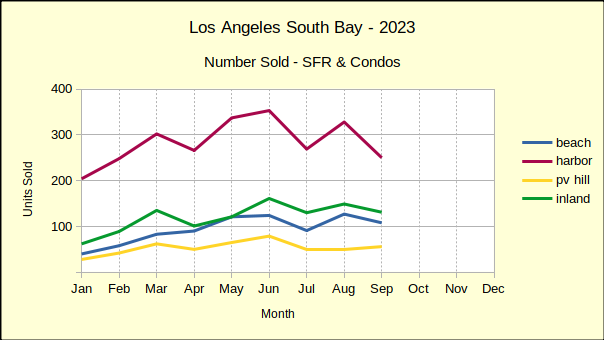
Comparing the first nine months of 2022 to the same period in 2023 shows median prices at the Beach down 2%, the Harbor down 2%, the Hill down 8% and the Inland area down 1%. Similarly, the number of homes sold dropped at the Beach by 15%, the Harbor by 22%, the Hill by 23% and the Inland area by 14%. On average across the South Bay sales volume was off by 20%.
To some extent this validates the supply versus demand theory. With interest rates above 7%, many potential sellers (who are simultaneously buyers elsewhere) have simply changed their plans. They’ll wait for interest rates to abate before trying to move. The California Association of Realtors reports that the number of homes sold across the State has fallen for 27 consecutive months. Locally, a couple of neighborhoods have shown year over year improvement a couple of times, but overall, the last time sales volume was positive across the South Bay was September of 2021, 24 months ago.
Because there are so few homes available for buyers in a must move situation, those buyers are forced to buy despite high interest rates and despite elevated prices. Mortgage interest rates are currently testing the 8% number, and are expected to stay there into 2024. Most forecasts expect the number of sales to drop even further, possibly offset by an increase in renters and a corresponding increase in rental prices.
Things don’t happen very fast in the real estate market. We mentioned earlier that sales have been declining here for 24 months already. But, prices are still up and interest rates are still climbing. Currently, we expect to see a shift in the pattern this winter. As time goes on, more and more sellers will surrender to the inevitable and lower their asking price. Coupled with an increasing number of short sales and foreclosures, that will create the key metric the Federal Reserve is looking for to quell inflation. Most pundits are suggesting 2025-2026 for the bottom of the current down-trend and the beginning of a recovery.
A Home or a House?
Are you buying a home? Are you looking for a neighborhood that matches your personality? Are you looking for schools for your children? And nearby businesses for your family needs? That’s a home. If you’re looking at the appreciation rate for the zip code and how much you can leverage, that’s a house. The difference becomes important when the real estate market is rocky. When you’re buying a home, you’re looking at time over generations. Percentages on a loan mean little then because the property can be refinanced many times before it belongs to the family.
Are you looking for a house? Are you measuring the appreciation and the cost to income ratio? Are you looking for a distress sale and a rock-bottom price. Now is the time to put your cash away. Make no mistake—cash will be required! That’s not to say you can’t finance part of your investment, but count on having “skin in the game.” Your lender will require it. Over the next twelve months, accumulate as much cash as possible, and make your broker your best friend. You want a constant finger on where good deals are happening and you want to be one of the first on the scene. The “bottom of the market” is a hypothetical point. Your best deal can be anywhere in the area and any time in the downturn. It just has to meet your investment requirements!
Beach Cities Holding Strong Over 2022
The median price of homes sold in the Beach Cities was flat for August and September, following a 2% drop in July. Coming in at just under $1.7M the month over month price has been mostly down for the first three quarters of the year. Following a similar pattern, the month to month sales volume has fallen after a strong start in early spring.
In year to year comparison, both August and September have shown a modest improvement over the same months last year. Median prices were up 2% in August and 3% in September. This improvement comes on the tail of four straight month of declining median prices. Supporting the growth in median price, sales volume was up 23% in August and 20% in September. The positive numbers at the Beach are a welcome respite following 21 months of falling volume.
Looking at year to date 2023 versus 2022, median prices are down 2% and sales volume is down 15%.
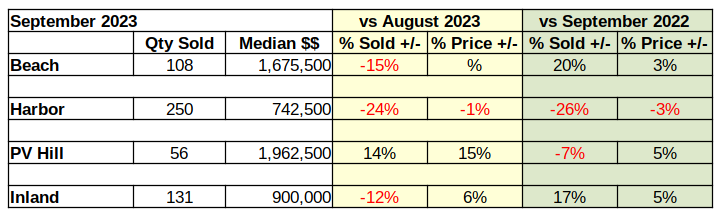
Harbor Volume and Prices Slipping
September found home sales in the Harbor area fell in all measures. On a month to month basis, sales volume dropped 24%. At the same time, median prices fell 1% below the August median.
Year over year showed the number of homes sold down by 26% and the median price down by 3% from September of last year.
Year to date for the first three quarters of 2023 sales volume was off by 22% while median prices dropped 2%.
This is a pattern we expect to see repeated again and again during the coming two years. First the sales volume declines steeply, and median prices begin a downward trend. Then as the sales volume continues to decline, sellers begin to panic and the few active buyers tighten up on the terms of their offers. The cycle typically continues until falling commodity prices and weak employment numbers convince the Federal Reserve inflation is under control. Then it will start lowering the interest rate and allow markets to float free again.
Palos Verdes Transactions Volatile
The PV Peninsula came through September with positive numbers for the month, though the annual and year to date numbers suffered some slippage. Sales volume for September came in 14% above August and the median price was a respectable 15% above the prior month.
Compared to September of last year, home sales on the Hill fell by 7%. That decline was countered by a 5% increase in median price over the same month in 2022.
Like the rest of the South Bay, PV suffered downturns in the year to date statistics. The first three quarters of 2023 ended with a 23% downward slide in home sales volume, accompanied by an 8% fall in median price.
Inland Area Sales Volume Mixed, Prices Up
The Inland area performed surprisingly well in September. Home sales in the Inland area typically mirror those in the Harbor area. Last month brought a surprise when the median price climbed 6% above August. This positive note came despite a 12% drop in sales volume.
September of 2023 compared to September of 2022 brought even more surprise with a 5% increase in median price as well as a 17% jump in sales volume.
Year to date activity for the first nine months of 2023 compared to the same time frame in 2022 fell in line with the rest of the South Bay, Sales volume fell by 14% and median price by 1%.
Beach=Manhattan Beach, Hermosa Beach, Redondo Beach, El Segundo Harbor=Carson, Long Beach, San Pedro, Wilmington, Harbor City PV Hill=Palos Verdes Estates, Rancho Palos Verdes, Rolling Hills, Rolling Hills Estates Inland=Torrance, Lomita, Gardena
It’s very common to submit late payments, for any of various types of bills or loans, including mortgage loans. Sometimes people just forget to pay. Sometimes they’re waiting for their next paycheck. Maybe some bills are more lenient on late payments than others, so they’re prioritized lower in the budget.
Whatever the reason, most people assume the only downside to a late payment is an extra fee. That’s not the case. The occasional late payment won’t have any impact, but repeated late payments do show up on your credit report. This will reduce your credit score and make it more difficult to qualify for a loan. If possible, you should make sure to pay bills on time, even for small things like phone bills.