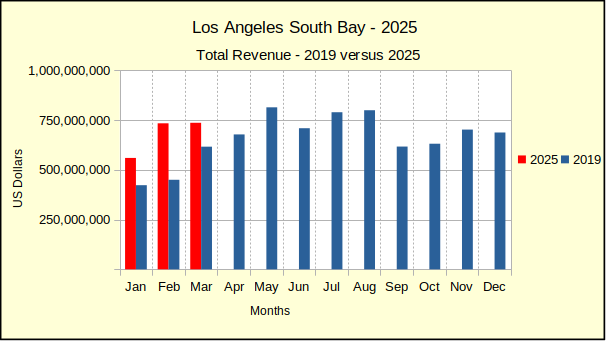
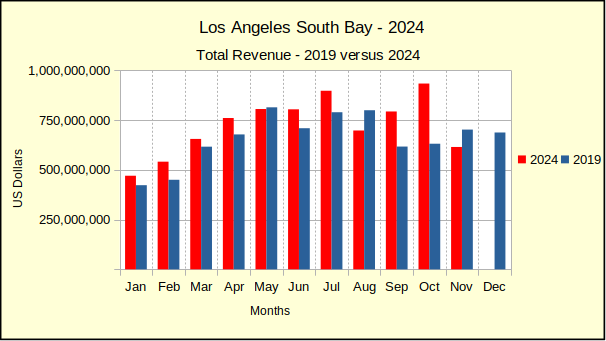
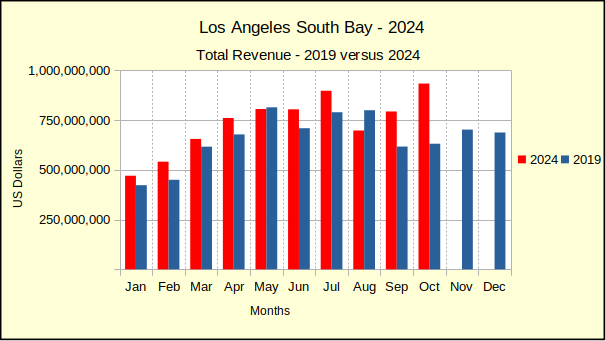
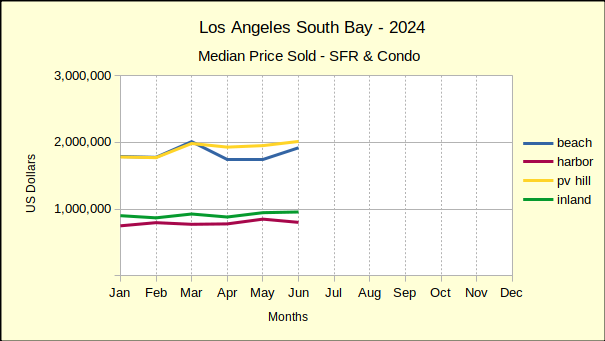
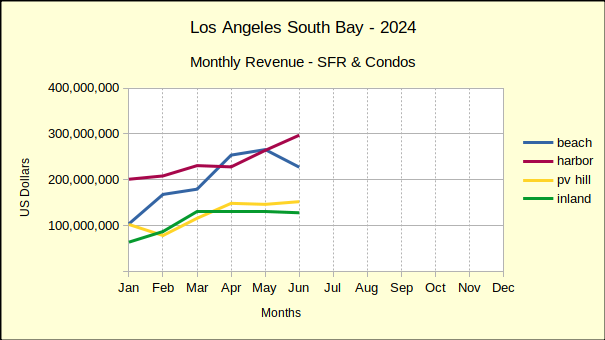
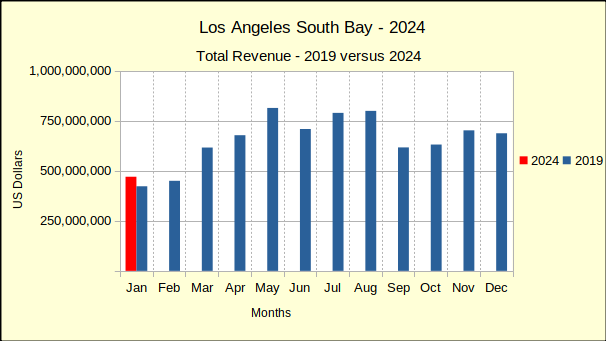
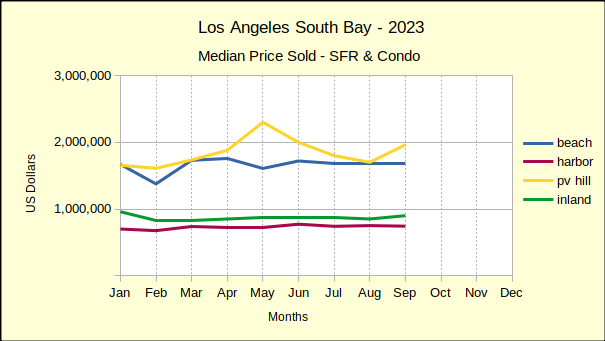
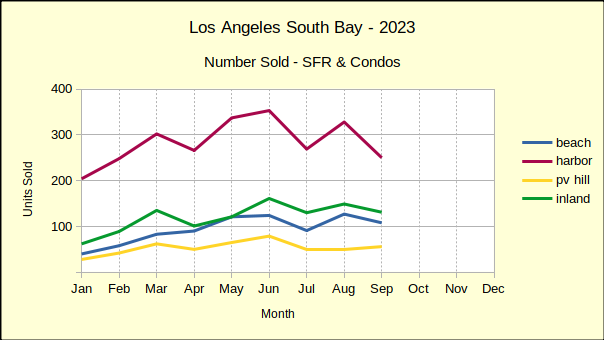
After a big 7% dive in October sales, annual real estate sales flattened out in November. Compared to November of 2024, the numbers are showing zero change for the Los Angeles South Bay. Sales were mixed across the areas. Median prices were mostly increased, though modestly compared to early in the year.

Downward pressure has increased in both sales and prices from month to month throughout the year. While 2025 continues to exceed 2024 in all metrics for all areas, the margin has grown smaller continually. Anecdotally, the real estate market has been slow and is slowing. This time of year slower sales are expected, though the seasonal slowdown this year seems to be a bit faster than usual. Median prices are not necessarily affected by the season, so the shift in pricing is one more indicator of a slowing real estate market.
Even two decreases in the prime rate by the Federal Reserve has done nothing to help. The most recent drop of .25% actually saw a .125% increase in the mortgage rate the next day.
In a couple weeks the year will be closing out and 2025 will become history. We’ll get the annual wrap-up out to you with a forecast for 2026 as early in January as possible. Enjoy your holidays!
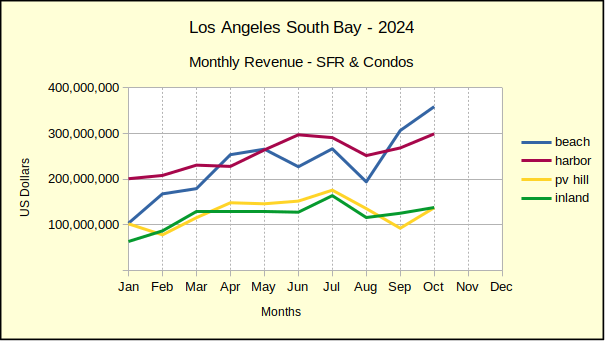
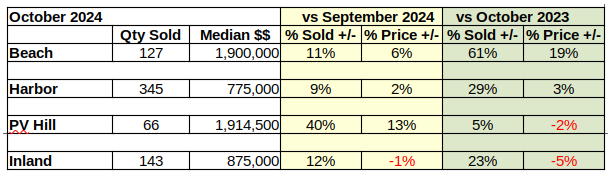
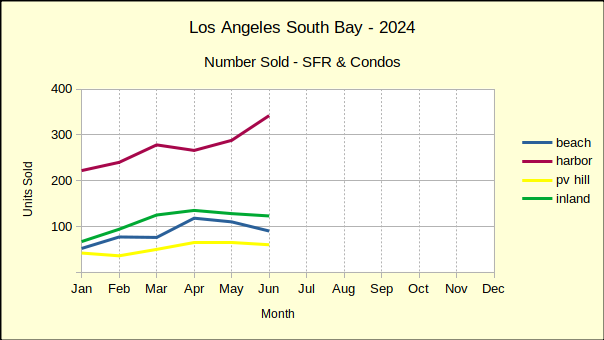
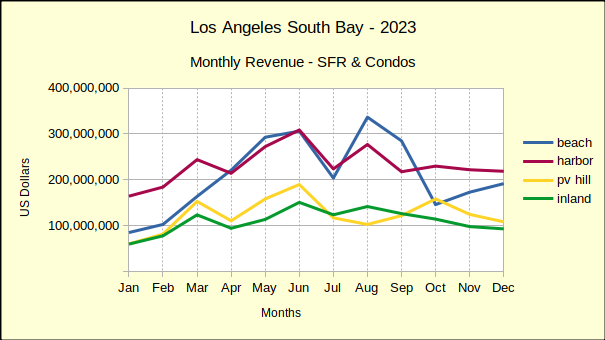
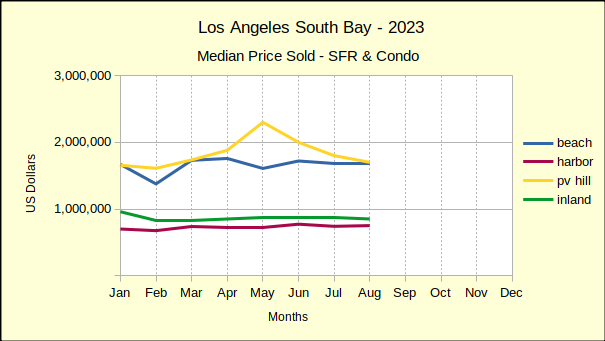
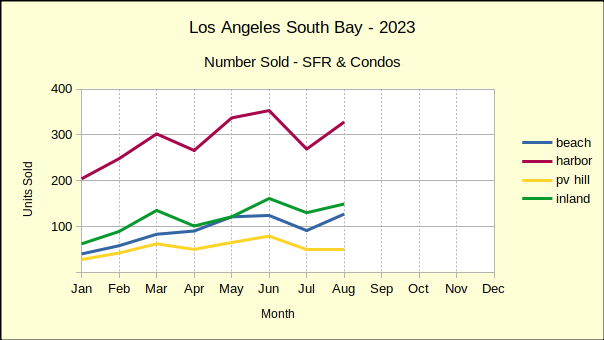
Beach:
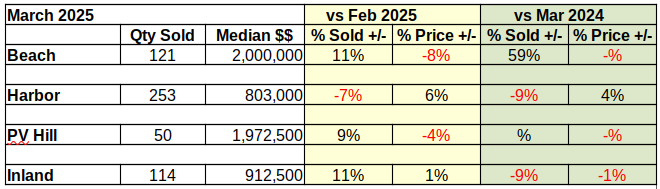
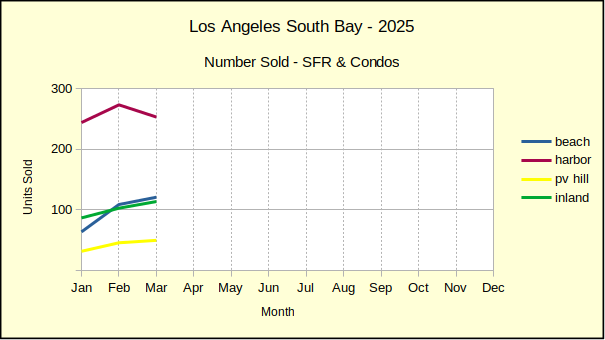
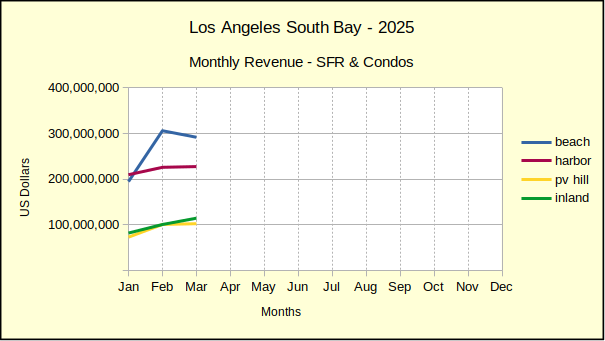
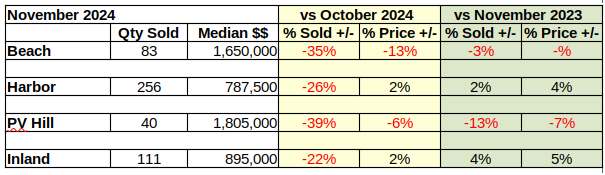
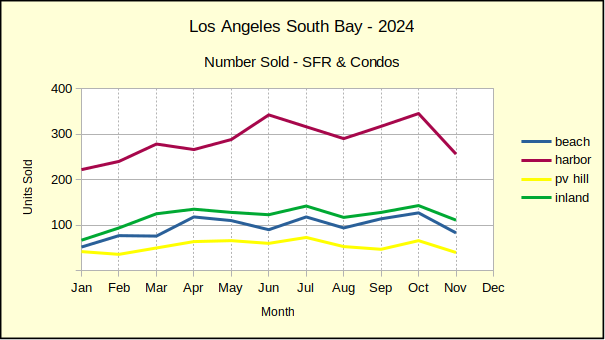
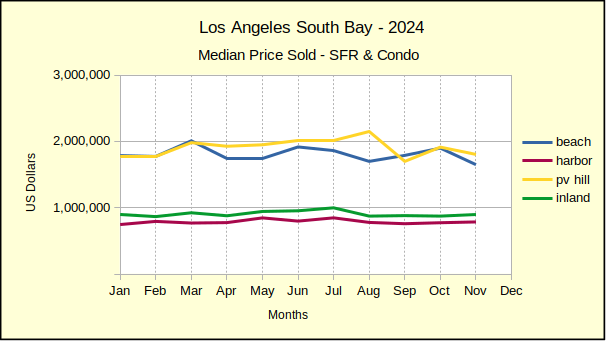
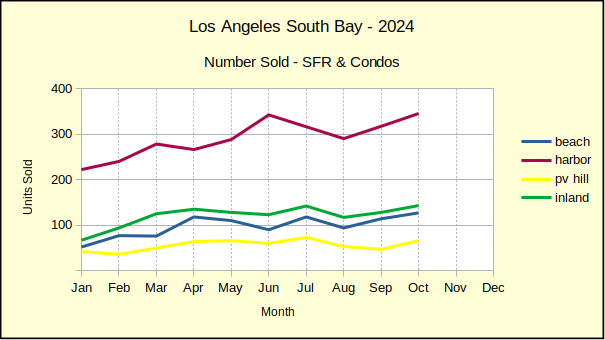
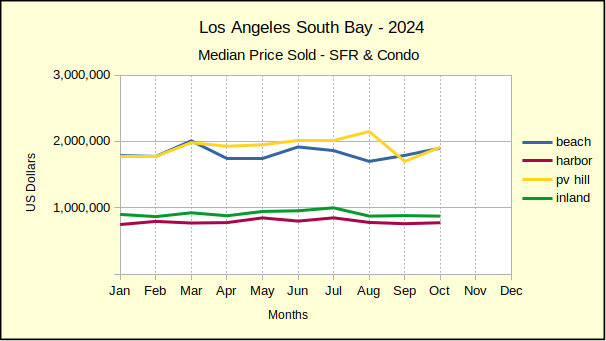
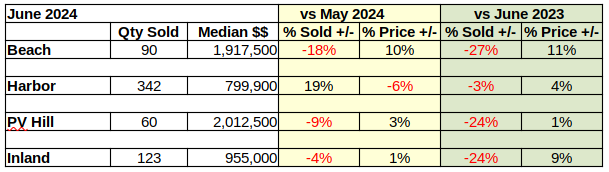
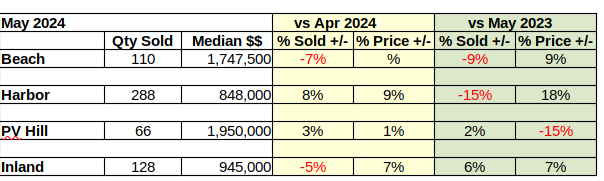
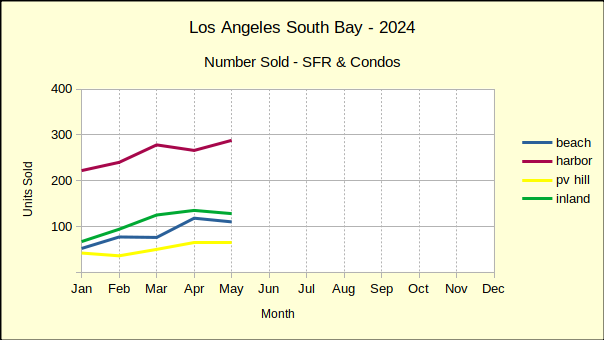
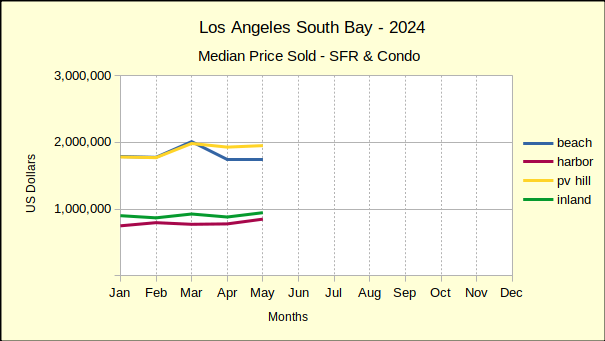
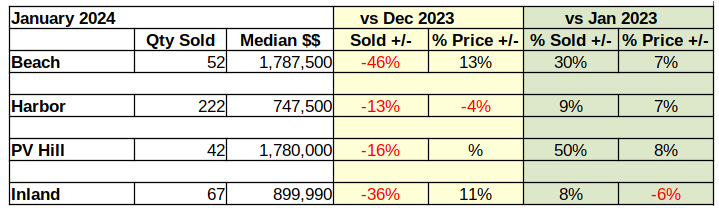
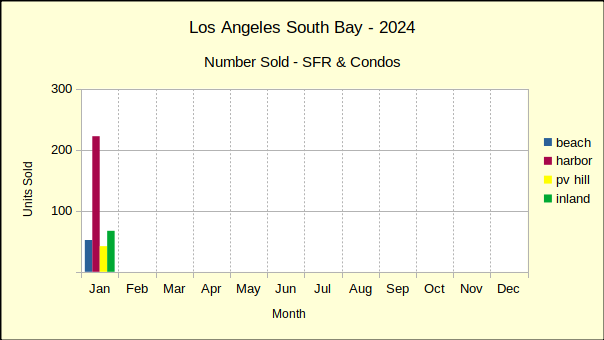
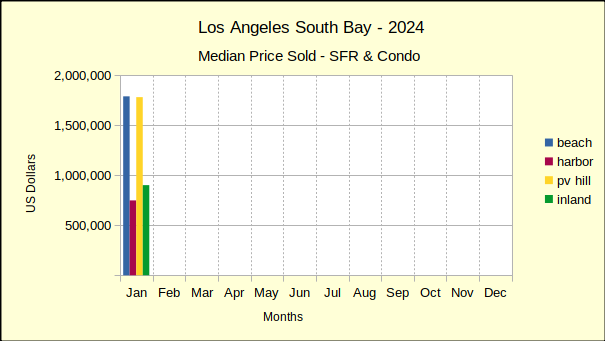
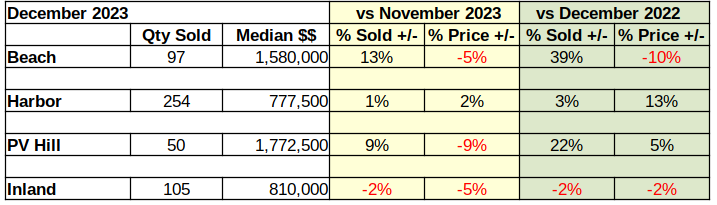
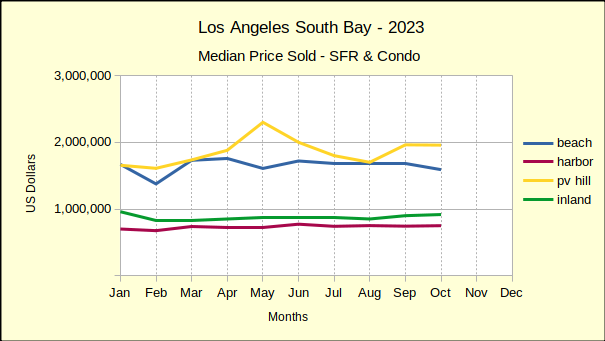
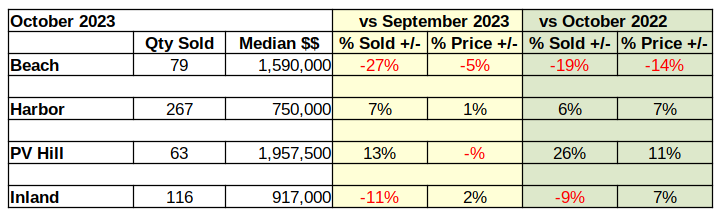
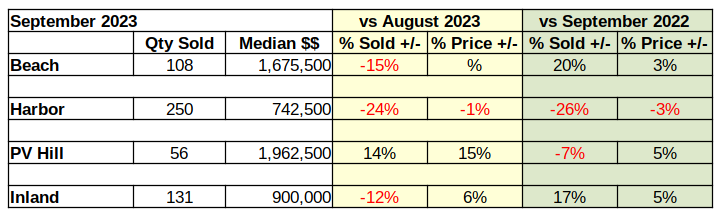
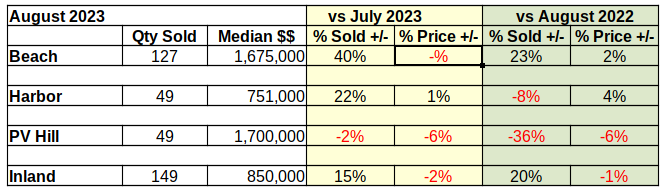
The number of homes sold in November in the Beach area plummeted in comparison to October. Sales dropped 30%, coming in at a mere 81 units. At the same time, the median price dropped to $1,750,000 to register an 8% decline. This is the sixth time this year Beach Cities sales have fallen compared to the prior month, and the eighth time the median prices have done likewise.

November of this year compared to November of 2024 showed mixed results. The volume of sales dropped 2%, while the median price rose 6%. This is the third month in a row annual sales have declined at the Beach. The annual median started in January at 32% increase, and has steadily dropped, falling below 0% four separate months.
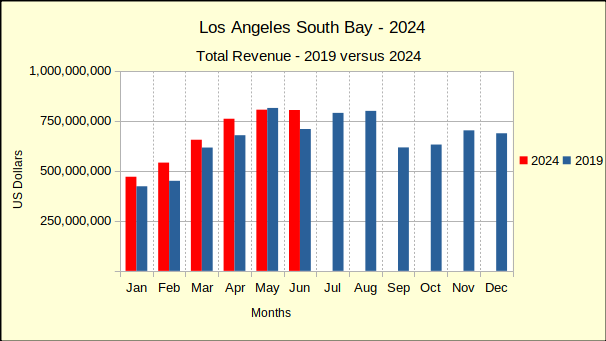
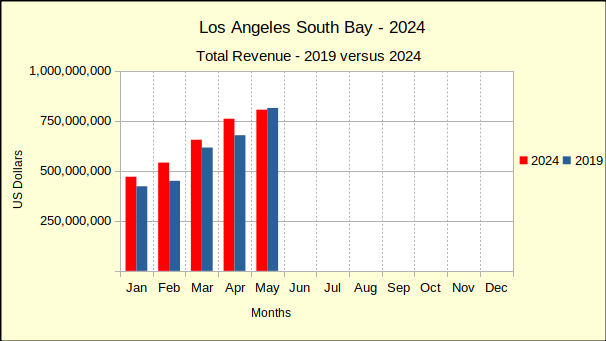
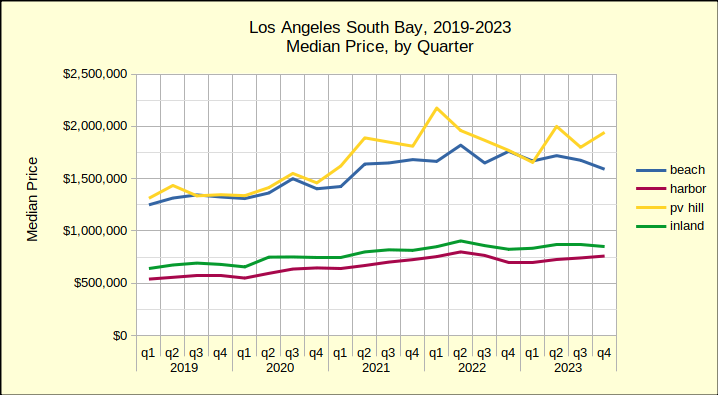
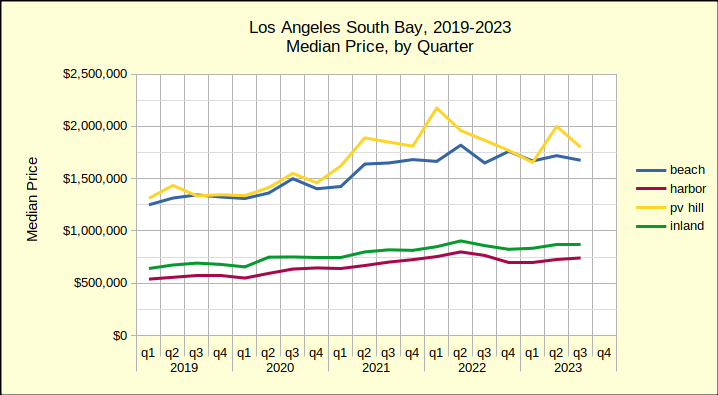
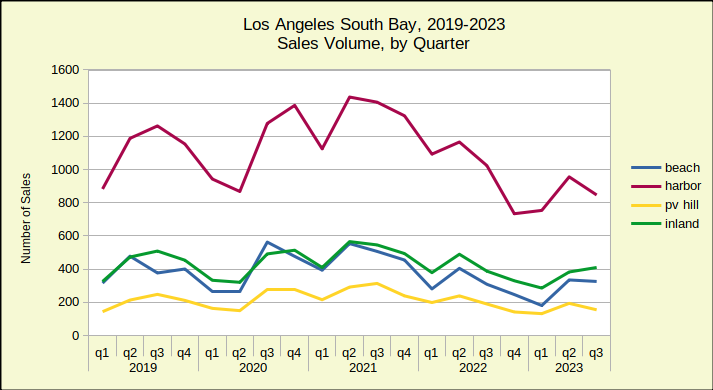
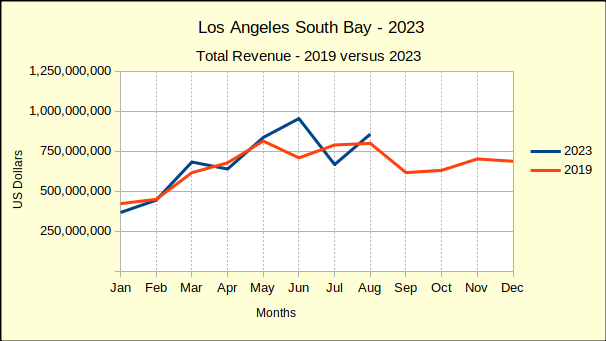
With only one month remaining, the year to date numbers show a strong 12% growth in sales and 6% increase in the median price. The sales volume remains 17% below the number of homes sold during the same period in 2019. The median price at the end of November was higher than that of 2019 by 45%, significantly above the Federal Reserve System’s ideal of 2% inflation per annum.
Harbor:
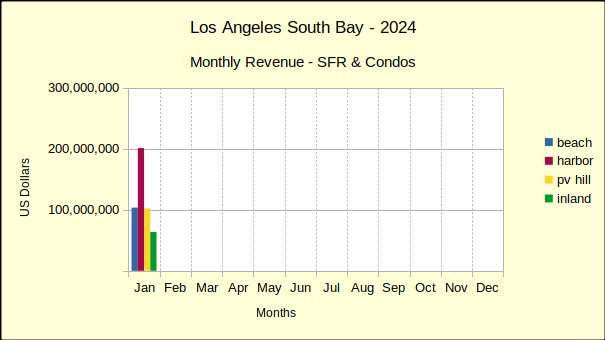
November real estate was good for the Harbor area. At 262 homes, monthly sales volume looked horrible–down 19%–but that seemed really good next to the South Bay wide drop of 23% in home sales. A median price of $812,000, an increase of 3% above October figures, was impressive compared to an approximate drop of 6% in most of the South Bay.

On an annual basis, this November came in with a modest 2% increase over last year. Again, this was a marked improvement over the 0% increase of the South Bay as a whole. Year over year median price was the only market statistic for November home sales the Harbor area didn’t dominate. Both the Beach and the Hill areas showed greater increases, at 6% and 10%, respectively.
Year to date, the Harbor area gives a classic display of capital growth, with a 2% increase in sales volume and a matching 2% increase in median price. Sales have fallen to 21% below 2019 levels, while the median price remains at 40% above 2019.
Hill:
Like the Harbor area, the Palos Verdes peninsula slipped in the number of homes sold compared to last month. With only 45 properties sold in November, the Hill dropped 18% in sales. The median price of $1,990,000 gave an 8% increase over the October median sales price.

Year over year, November residential sales rose 13% above 2024. This was the highest increase in sales volume of the four areas, far exceeding the total South Bay number, which was 0% growth. The Hill also came in with the greatest median price, jumping by 10%.
Looking at the combined activity of January through November, compared to the same period last year, sales volume was up 7%. Median price for the period was up by 1%. Compared to pre-pandemic statistics from 2019, PV home sales were down by 15% year to date, and the median price was up 45%.
Inland:
For November the Inland area dropped in all four metrics, sales volume and median price, for month over month and year over year. The number of homes sold dropped 28% on 102 units. The median price fell 6% to $865,000.

Annually, volume fell 8%, the steepest decline in the South Bay. Compared to last November, the median price was off by 3%.
Year to date remained in positive territory with 0% change in number of sales and a 1% increase in median price. Sales volume continues to be off from 2019, showing a 19% decline. Median price compared to pre-pandemic pricing remains up by 33%.
Beach=Manhattan Beach, Hermosa Beach, Redondo Beach, El Segundo
Harbor=Carson, Long Beach, San Pedro, Wilmington, Harbor City
PV Hill=Palos Verdes Estates, Rancho Palos Verdes, Rolling Hills, Rolling Hills Estates
Inland=Torrance, Lomita, Gardena