
The Snapshot: May 2023
Compared to last month, South Bay home sales look very positive, except for a little tarnish in the Beach cities prices. The sales volume was up by substantial margins in all areas. Prices were mixed with a remarkable median price increase on the Hill. The only exception: After showing positive growth for the past two months, prices at the Beach took a substantial tumble in May.
Year over year activity was an entirely different story. Sales volume was down significantly from last year in all areas. Prices took a hit everywhere except on the Palos Verdes peninsula. (More about that below.) Entry level homes in the Harbor and Inland areas were impacted the least, though even a 3% drop in a single month is significant in the world of real estate.
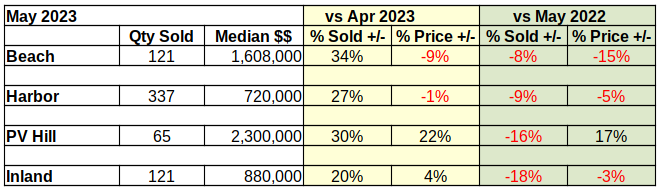
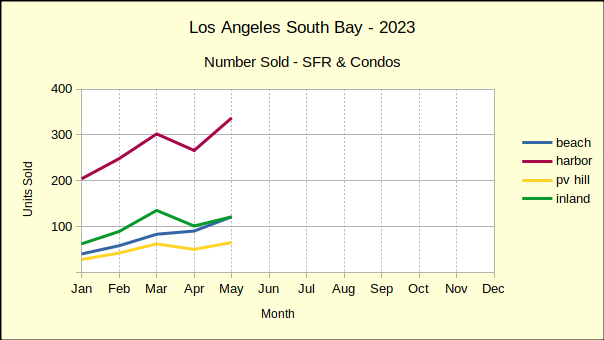
We report actual statistics rather than “seasonally adjusted”.numbers. May is traditionally the launch into buying season in the South Bay, so a May increase in volume from April is to be expected. On the other hand, a 10-20% decrease from May of last year indicates a heavily retrenching market. Every month since the beginning of this year, the number of homes sold in the South Bay has decreased in comparison to 2022.
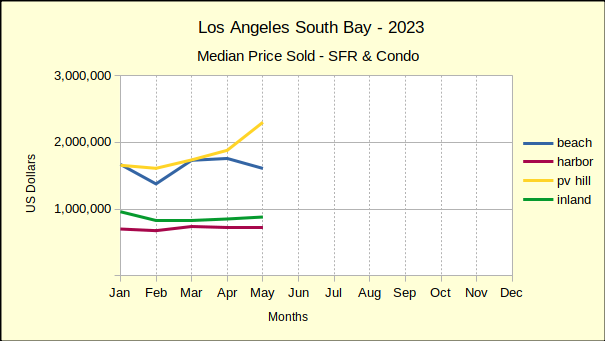
Similarly, median prices across the South Bay have dropped from the highs of 2022. There have been scattered instances of positive change, like the 17% increase over May of last year for PV. Overall though, prices have been collapsing at an ever more steeply declining rate since January.
Much has been said about the steep rises and falls of sales volumes and median prices since the Covid pandemic hit in early 2020. That leaves 2019 as the last “normal” year of business. At the mid-year point we’ll give a more in depth comparison to 2023 to hopefully provide a more stable picture of the market.
In the meantime, year to date statistics for the first five months reflect an overall decline of 23% in sales volume, and an increase of 33% in median price. The sales slowdown has most affected the Beach Cities with a drop of 39%, followed by the Inland area at 21%, the harbor at 19%, and finally the PV Hill with a 14% slip. A review of the changing median prices across that many years requires adjusting for desired inflation as opposed to uncontrolled inflation.
Beach Cities: More Sold at Lower Prices
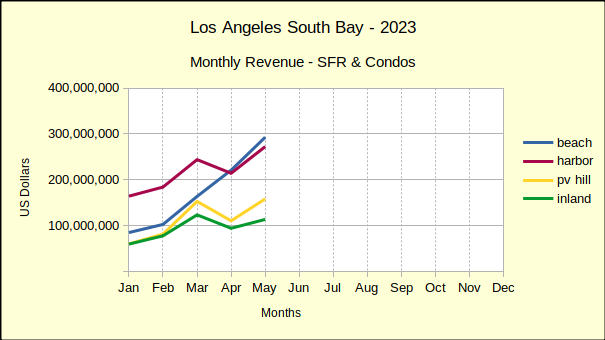
Monthly, the Beach Cities have been on a roll. Even in April, when the other three areas took a nose-dive, the Beach climbed steadily higher in both sales volume and median price. The blue line on the monthly revenue chart below shows surprisingly strong growth.
A closer look at the sales data shows some of the detail. Two of the 121 Beach area sales were on the Strand, with one selling at $18.6M and the other at over $15M. Sales in that rarefied atmosphere tend to be few and far between. In fact, one of those properties sat on the Multiple Listing Service (MLS) for almost exactly three years before it sold. With the April median price at $1.6M, the impact to the aggregate statistics becomes apparent quickly.
Market time for the Beach Cities in May was actually quite prompt, with 79% of the homes sold having spent less that 30 days on the MLS. Pricing was equally strong, with sales prices coming in at two percent above asking price. While the high sale was $18.6M on the Strand, the low was $530K at Brookside Village in Redondo Beach.
Harbor Area: Sales Up – Prices Down
As the red line in the chart below reflects, Harbor area sales entered the spring selling period with a bang! Sales volume was up 27% over April—but, remember April sales were down by 12% in the Harbor and down 13% across the South Bay. Downward pressure on prices has been showing up since the beginning of the year. Out of the first five months of 2023, month to month median prices of Harbor area homes have dropped three times. May saw a 1% decline, which was a repeat of April’s price slip.
Annual statistics cast a recessionary shadow across the picture. Looking back at May of 2022 shows the same month this year with 9% fewer sales and a drop of 5% in median price. Year to date, 2023 has lost 29% in sales volume and 5% in median price.
Compared to the first five months of 2019, the last “normal” business year, Harbor area volume was off 19%. The median price remains positive at 33% above the 2019 median. So far this year the median at the Harbor has declined an average of 5% per month. Given that rate, it’s reasonable to expect a total loss of the price gains since 2019.
Like the rest of the South Bay, the time on market for May was short as 75% of sold properties went into escrow within 30 days of listing. The low sale for the month was $269,500 and the high was $4M, a relatively high price in what is generally considered an entry level market. Interestingly, the high sale was originally listed at $9M in March of 2021, sitting on the market for two years before an accepted offer.
Palos Verdes: Home Sales & Prices Hot On The Hill
On a month to month basis, homes on the Hill came in with a 22% increase in median price, that being on top of back to back 8% increases for March and April. We’ve long said that homes on the Hill are undervalued. It looks as though that will soon be changed.
Monthly sales volume also jumped 30% for PV, though it has slowed since February and March when it was up 50% and 48% respectively. This pattern of sales increases slowing holds true for most of the South Bay. During the first quarter of 2022 the local real estate market was on fire, and then came the interest rate increases.
When the interest rates were bouncing around 5% during April and May of last year, the PV sales volume had already begun a long, slow decline. Sales figures were off by 30%-40%. So far this year, sales have continued to fall and are, in aggregate, now 31% below 2022 volumes.
Again on a year to date basis, median prices in PV are down 11%. Because the PV Hill has a comparatively small amount of homes, statistics can be volatile. June was the peak of PV business in 2022. While the summer months are typically busier and more competitive, expect this June to be less “exuberant” than May, or last June.
Like the rest of the South Bay, about 75% of homes sold on the Palos Verdes peninsula were active on the market for 30 days or less. On average, the sales price was 2.6% above the asking price.
Inland Area: Seasonal Bump In Sales and Prices
In May, the Inland area kicked off the spring selling season by pushing month to month sales volume upward 20%. While the volume of sales increased on a month to month basis, the median price went up by 4%. This seasonal bump in sales and prices contrasts sharply with the longer look of a year over year view.
Comparing May numbers from last year to this year gives a reverse result. The number of homes sold in the Inland area fell 18% from May of 2022, and the median price fell 3%, dropping back to $880K from $910K last year.. The longer perspective shows a clear decline in sales accompanied by a hint of decline in median prices.
Looking at the first five months of the year shows sales volume off in total by 68%, or an average monthly decline of nearly 15%, another indicator of the slow market. It’s joined by a 1% drop in the year to date median price.
On the positive side, 87% of the Inland area sales for May closed within 30 days of being listed. With business slip-sliding away, everyone involved is making the transactions happen as quickly and smoothly as possible. The high and the low sales figures for the Month were $1.7M and $310K, respectively. Sellers rejoiced at, and willing buyers paid, an average sales price of 2.9% above the asking price.
Photo by Lisha Riabinina on Unsplash