May vs April
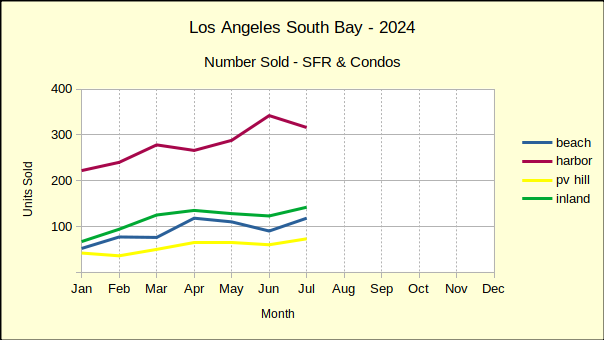
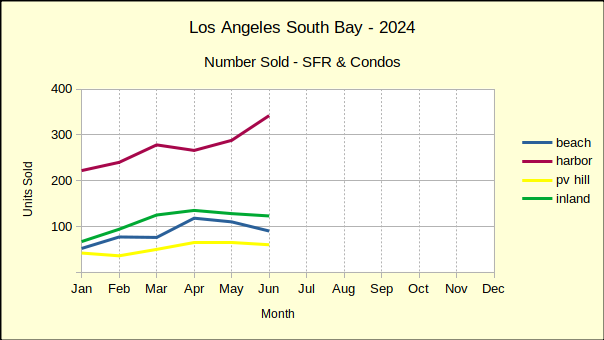
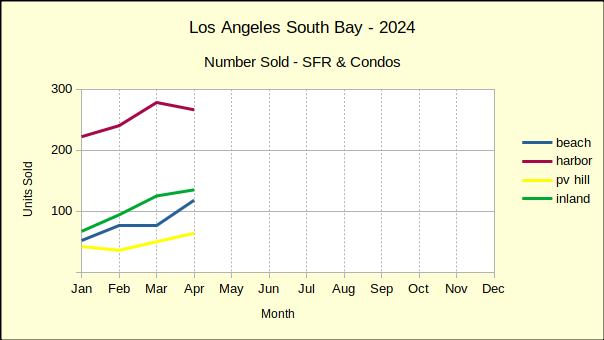
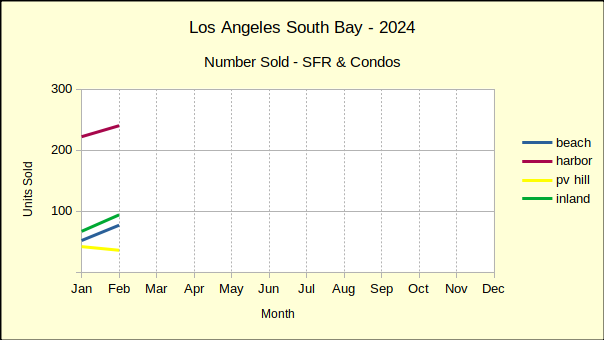
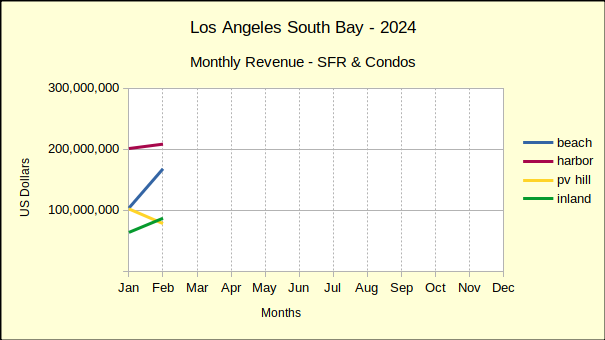
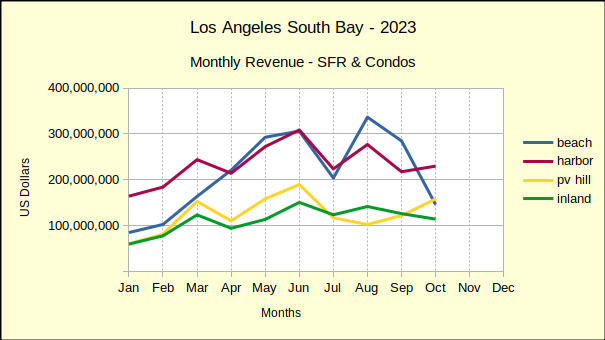
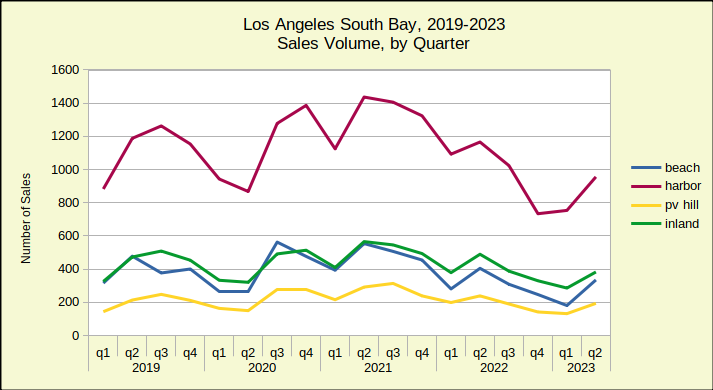
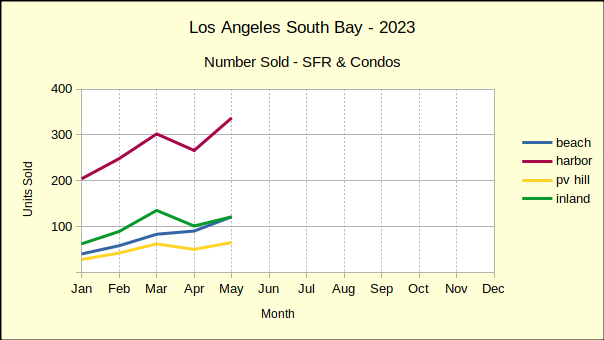
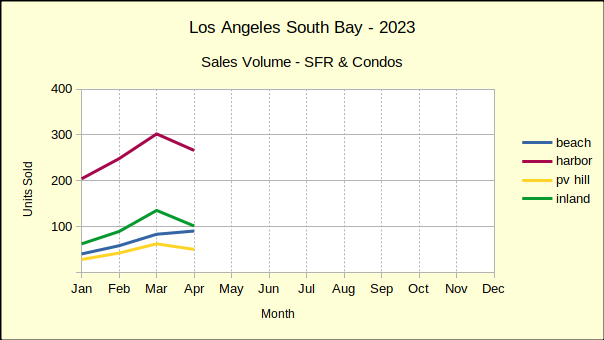
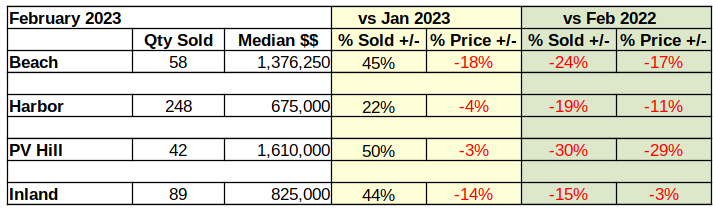
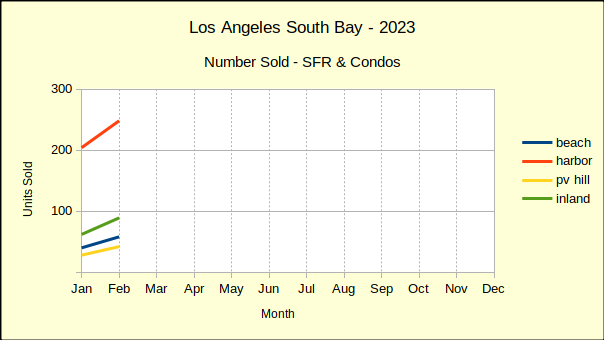
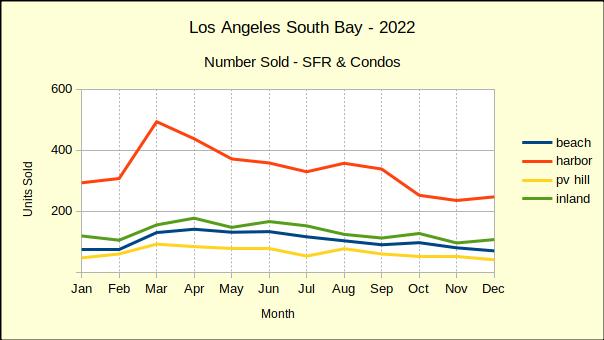
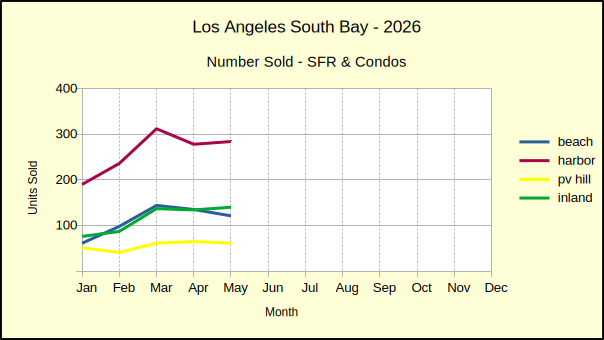
May brought slight improvement to the real estate market in the Los Angeles South Bay. Activity in the number of homes sold compared to April was off 1% across the region, after being down 6% the prior month. After a disappointing 32% drop in January, February and March had rebounded with steep monthly increases in sales. Since then, the war drums sounded in west Asia and sales volume across the South Bay has experienced a significant decline.
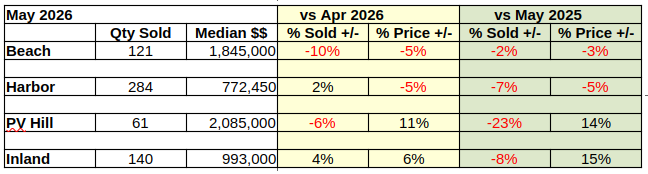
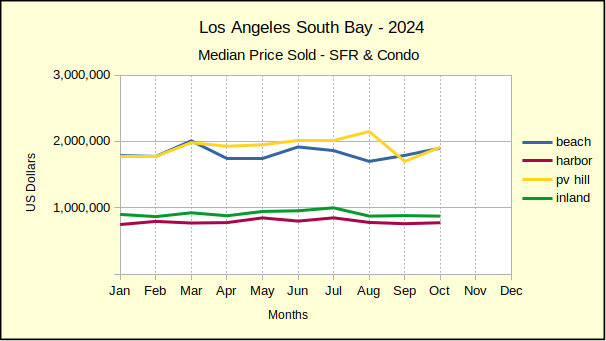
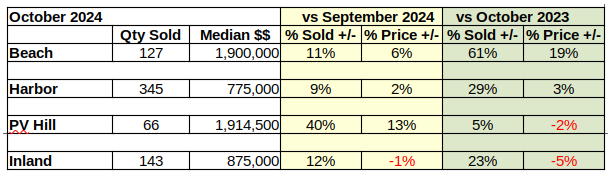
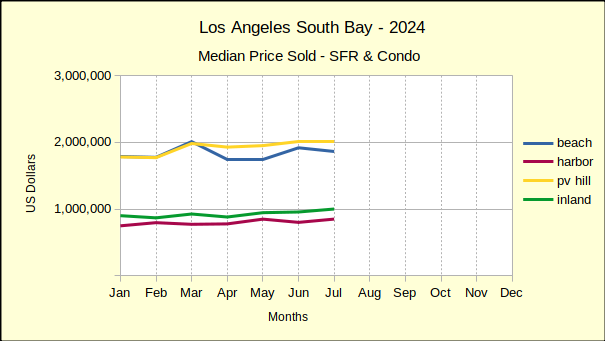
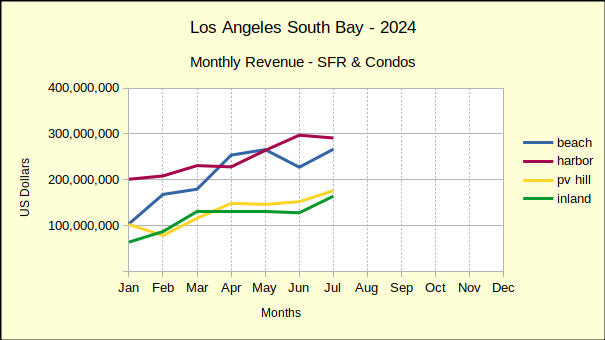
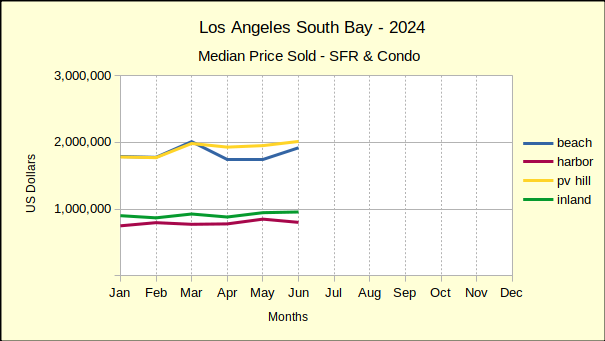
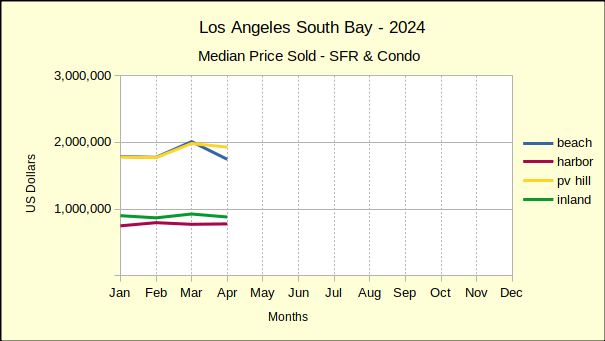
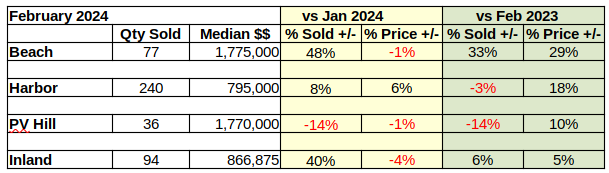
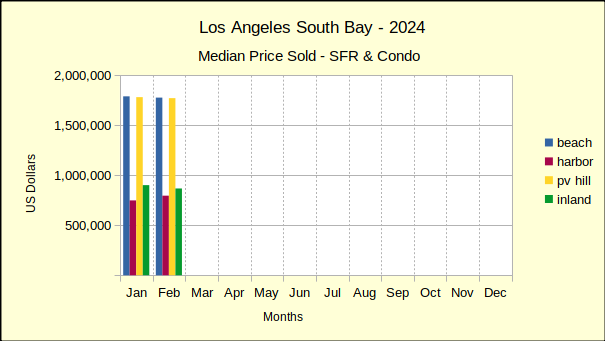
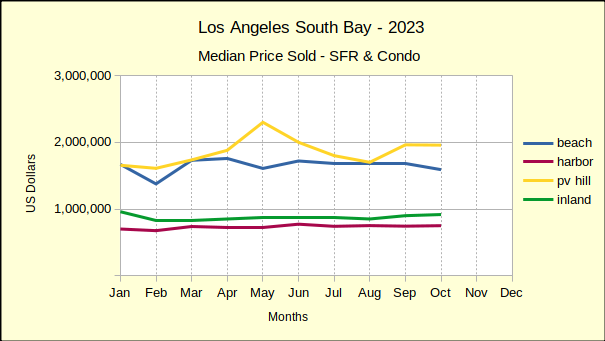
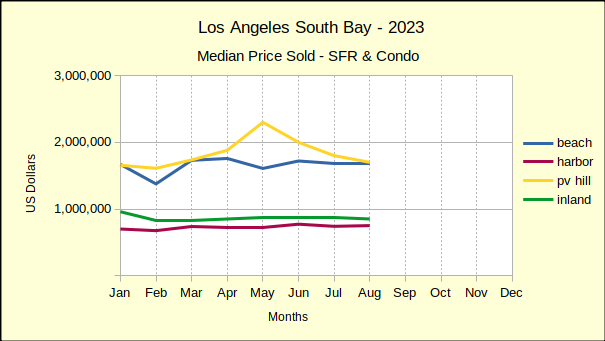
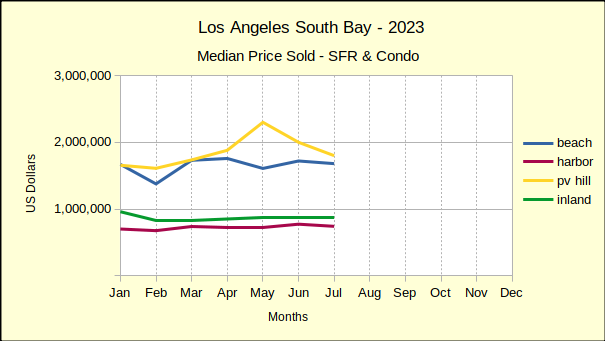
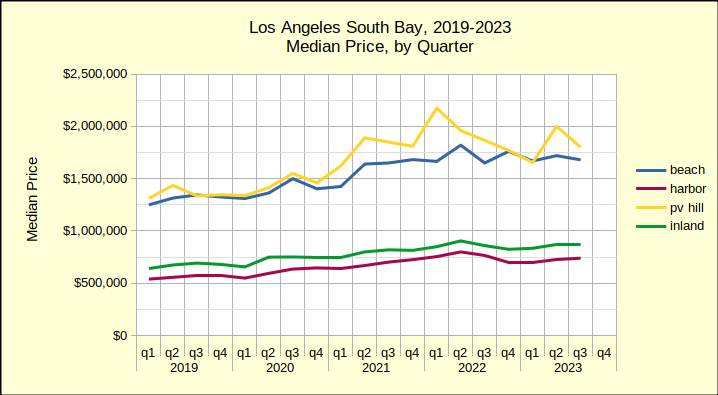
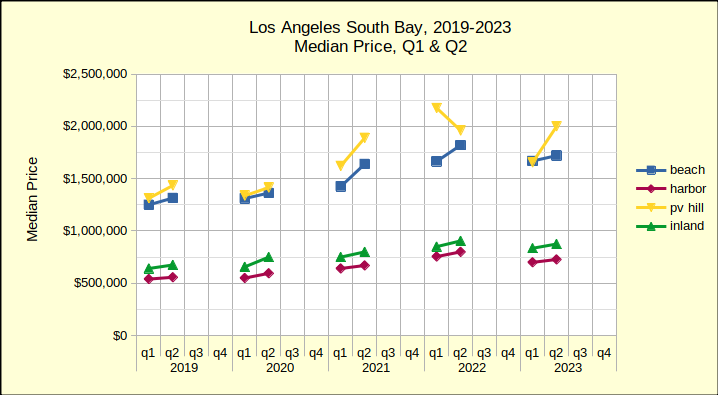
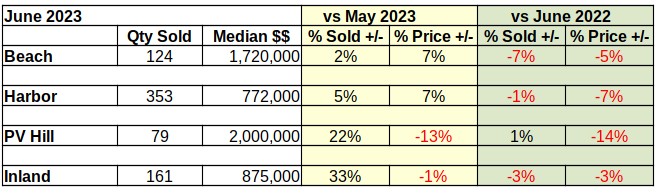
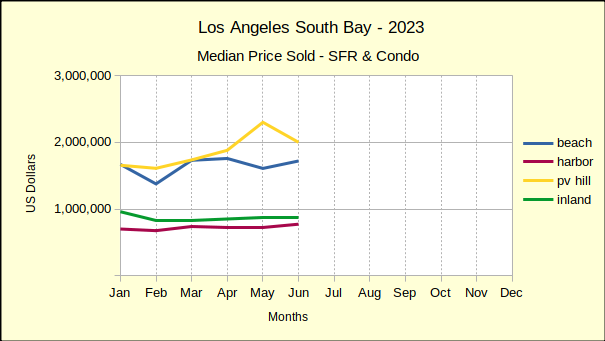
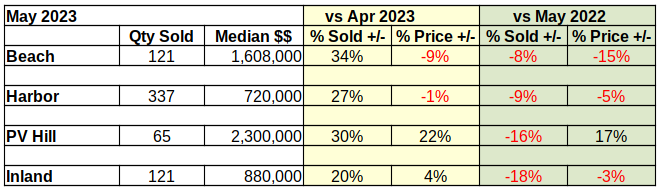
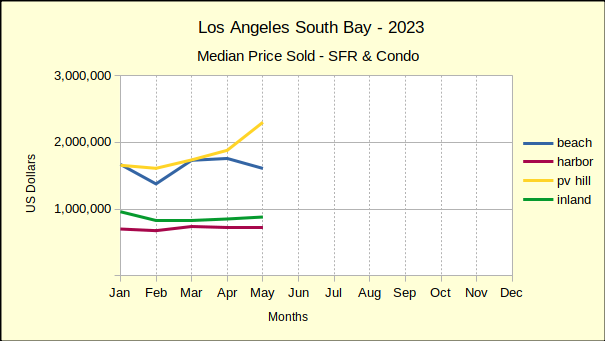
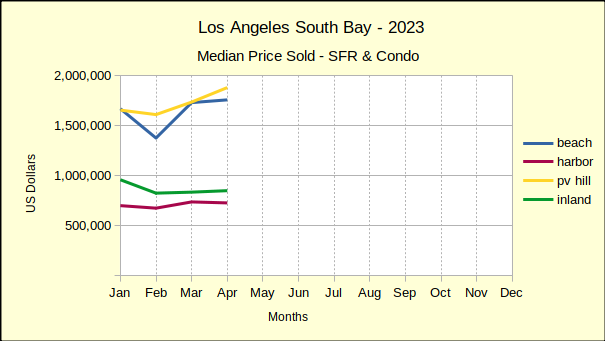
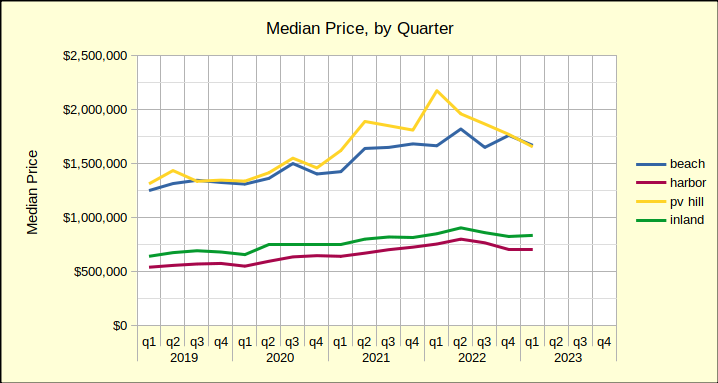
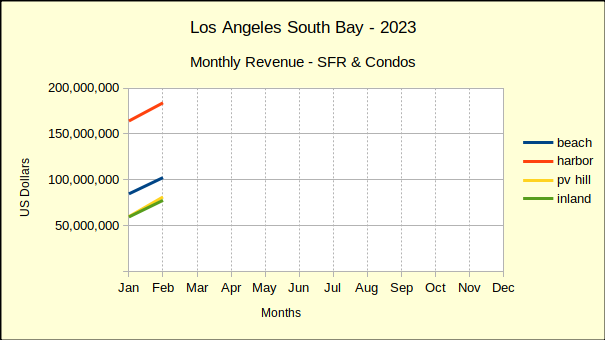
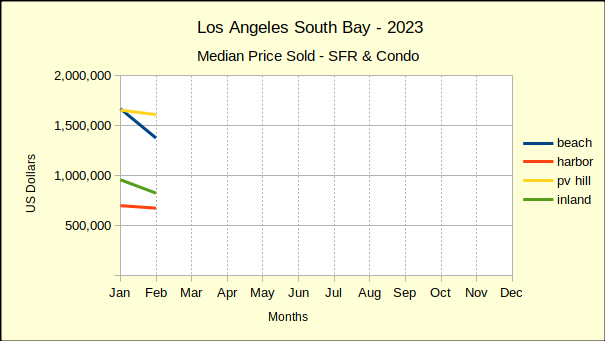
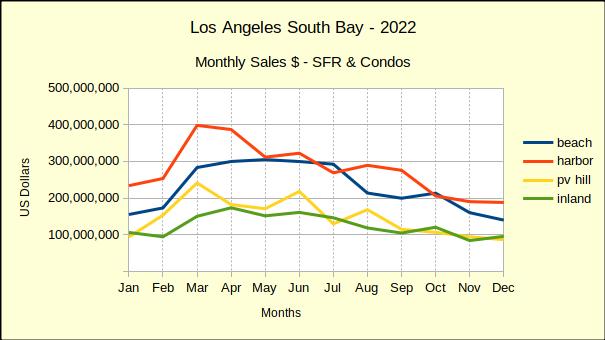
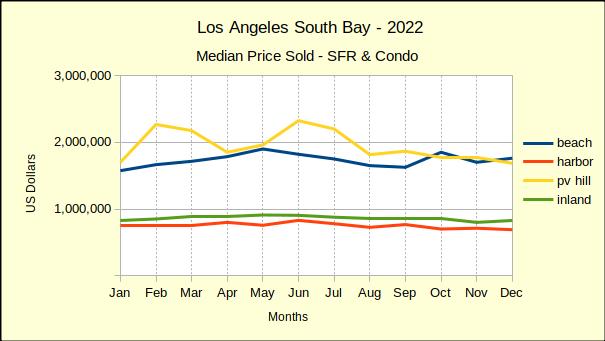
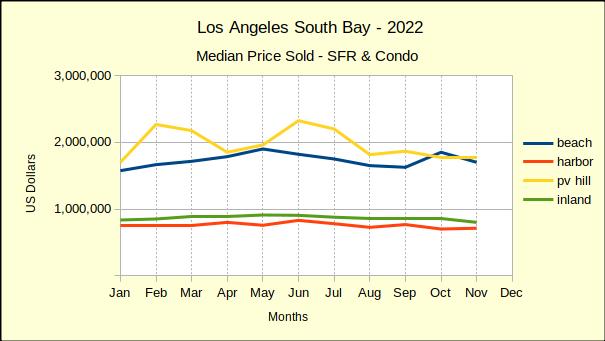
Monthly median prices have continued last month’s negative cast. For example, April and May at the Beach were down 14% and 5% respectively. The Harbor area showed mixed results, ending with a 5% decline in the median price for May. The Inland area is showing solid 5%-6% median price increases in month to month calculations. Prices on the Hill have been positive for the past three months and came in at 11% this month. (As always, one should remember transaction volume on the Hill is low, so a couple of sales can have an out-size impact on the statistics.)
May 2026 vs May 2025
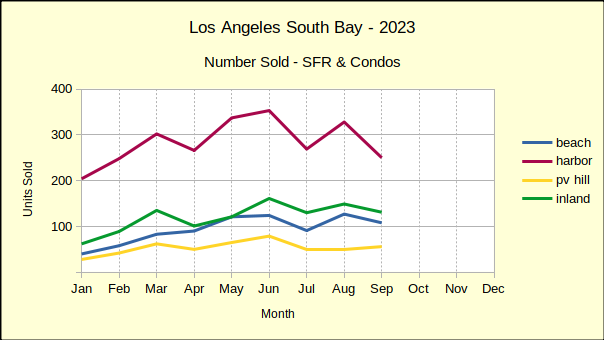
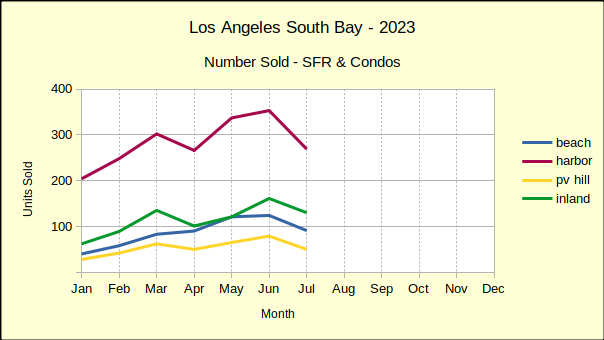
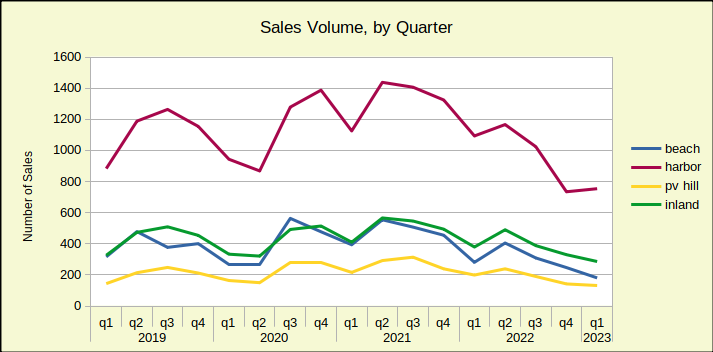
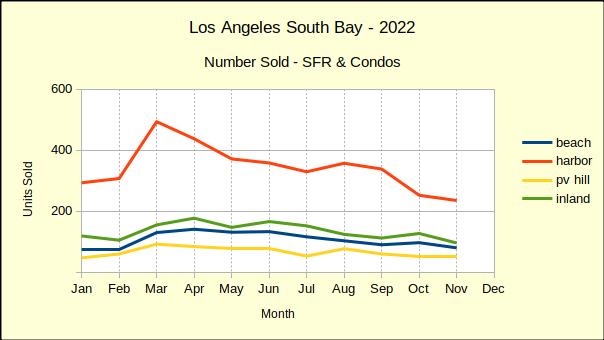
Annually, the number of homes sold dropped in every area of the South Bay. Declines ranged from 2% off at the Beach to 30% off on the Hill. Across the region, year over year sales volume fell 9%. This pattern of decline roughly mirrors the month to month sales activity so far in the second quarter of the year.
Median prices continued to be volatile in May by comparison to the same month last year. The Beach cities once again fell by 3%, just as it did in April. The Harbor area fell 5%, flipping from a 4% gain the prior month. Values in the Inland and Hill areas increased for the second month in succession, this time by 13% and 12%, respectively.
2026 Year to Date vs 2025
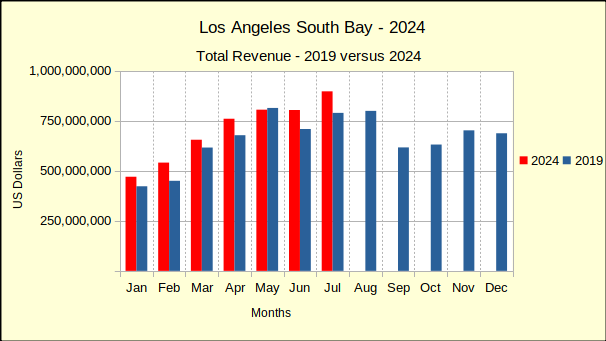
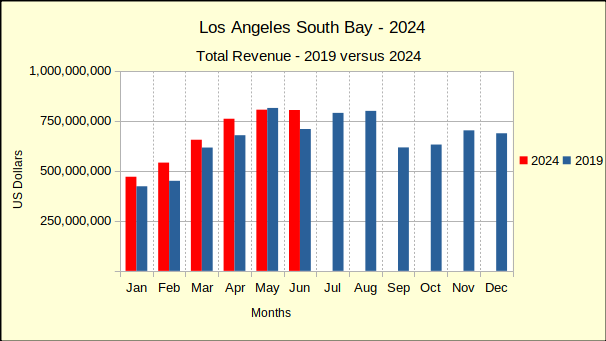
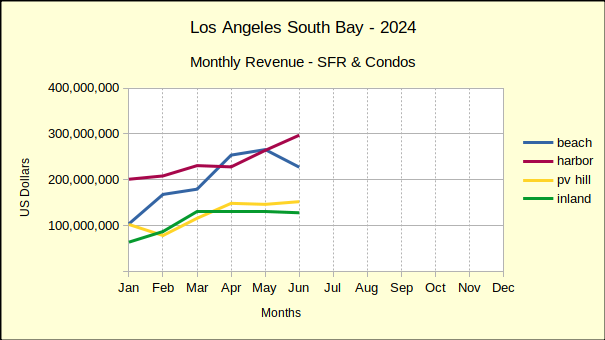
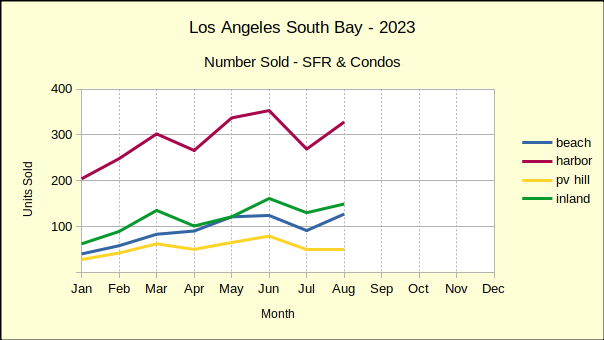
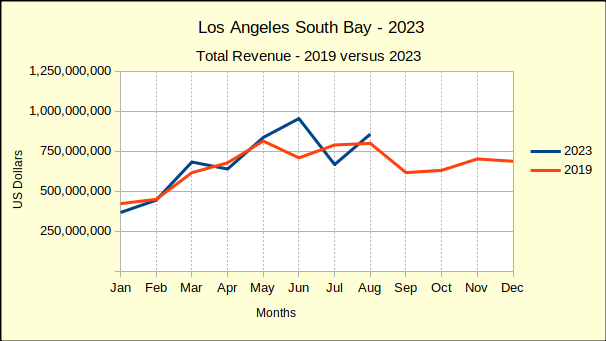
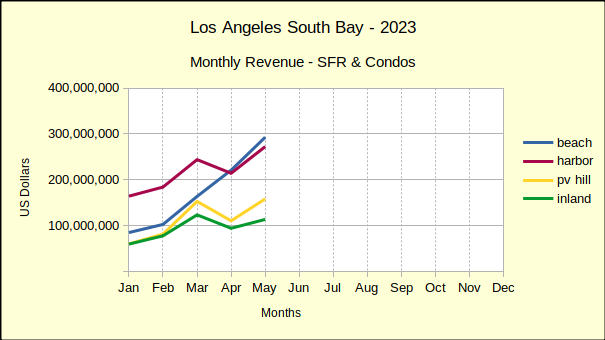
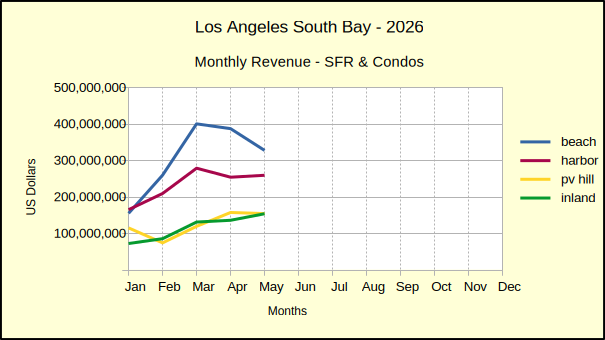
Residential sales volume has been on the decline most of this year, in most areas of the South Bay. During the first five months of the year, 2712 homes have sold compared to 2895 for the same period in 2025. As it was last month, this measures out to a 6% decline for the year to date.
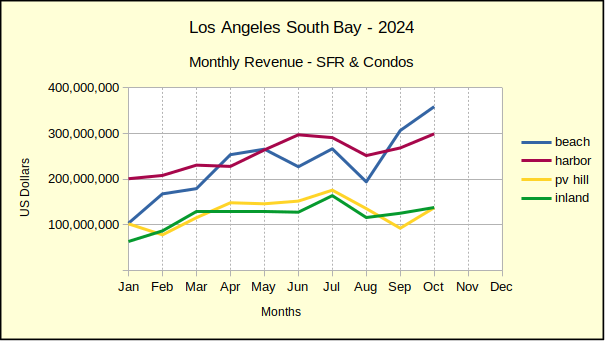
The Beach was the only area to show positive growth in May sales with a 4% increase in volume. The largest decline came in the Harbor area with an 11% drop in sales. The Palos Verdes and Inland areas dropped 5% and 7% respectively.
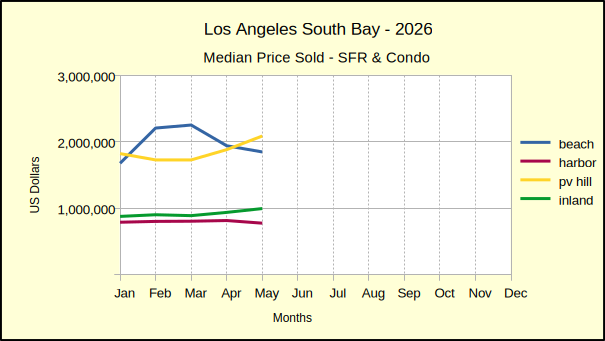
While there have been many instances of decline in median price, the cumulative year to date statistics are still relatively positive. The Beach and Harbor areas both show a 2% increase in the median. At the same time, the median price on the Hill dropped 5%, while the Inland area increased 1%.
The Outlook for June
Home sales for June are projected to continue dropping. Expect month over month declines to be 1% to 2% lower than in May. Annually, sales are anticipated to drop by about 10% compared to last June. Year to date sales are also expected to drop by about 10%.
Continued decline in the number of homes sold will almost certainly impact the median price. Despite historically low inventory, the volatile economic situation has dampened buyers’ enthusiasm. Rather than the “bidding war” environment often seen with low inventory, the current market is watching widespread seller price reductions.
Anecdotal evidence shows some homeowners selling and shifting to a rental in anticipation of recession. These sellers are hoping a market collapse will create an opportunity to profit by buying back into the real estate market after prices collapse. While quite risky, this method started several investment careers during “the great recession.”
Stats for the Detail Minded
Beach:
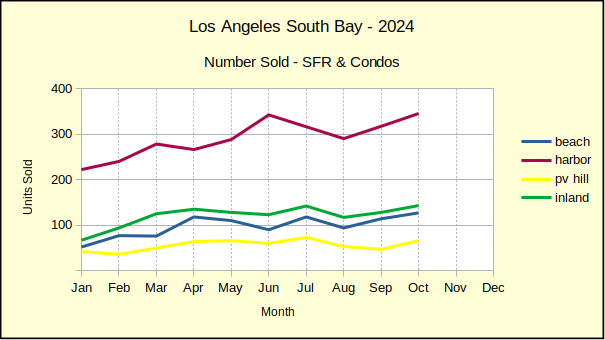
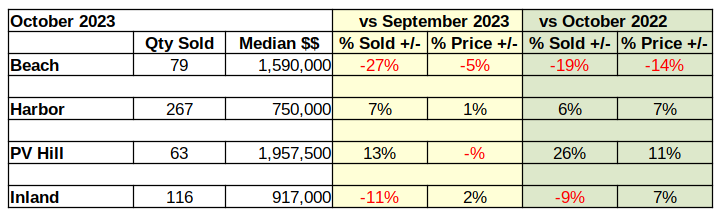
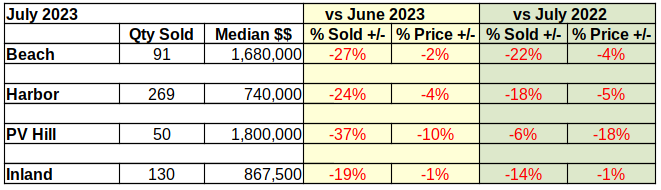
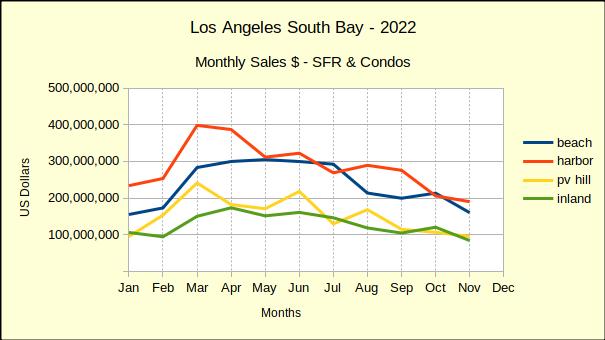
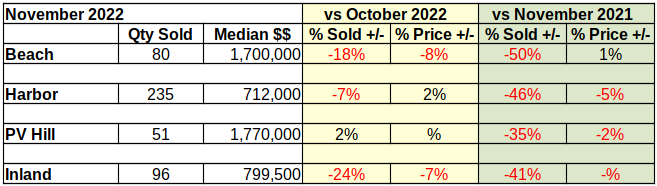
M-m, vol: 121, -10% med: 1,845,000, -5%
y-y, vol: -2%, med: -3%
ytd, vol: 4%, med: 2%
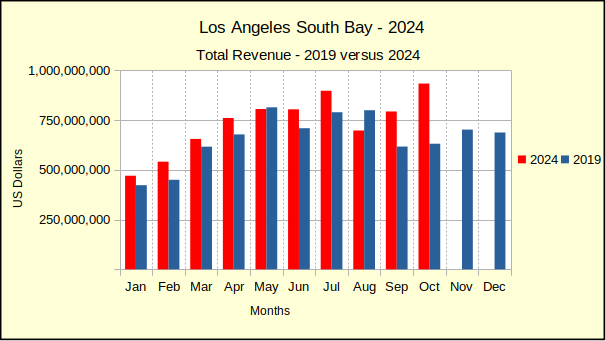
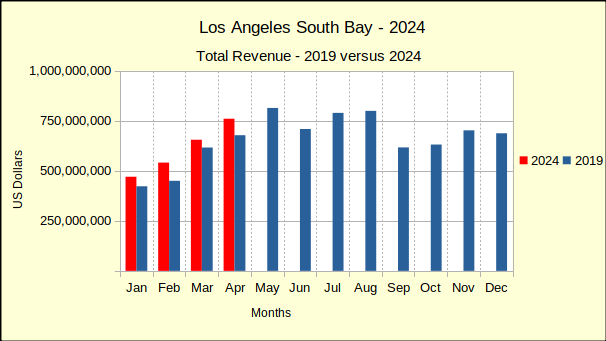
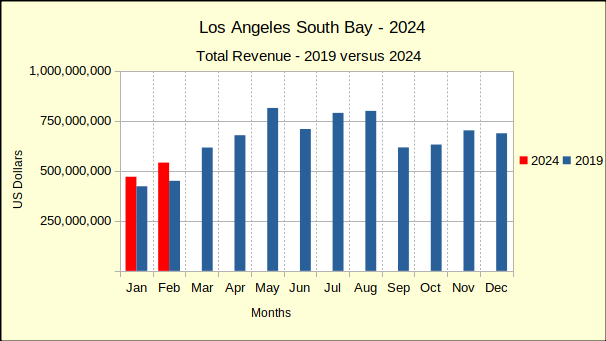
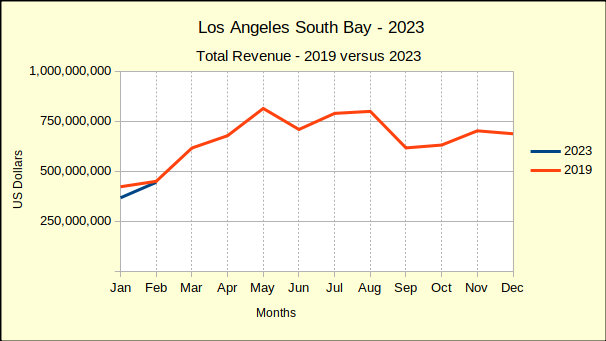
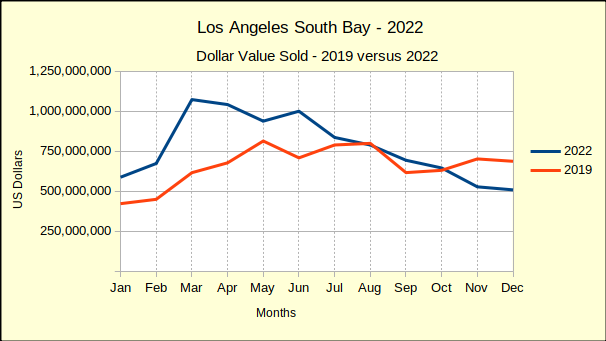
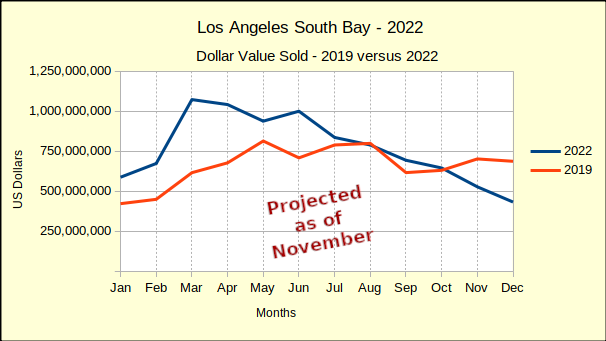
vs 2019: vol: -14%, med: 48%
Harbor:
M-m, vol: 284, 2% med: 772,450, -5%
y-y, vol: -7%, med: -5%
ytd, vol: -11%, med: 2%
vs 2019: vol: -23%, med: 42%
Hill:
M-m, vol: 61, -6% med: 2,085,000, 11%
y-y, vol: -23%, med: 14%
ytd, vol: -5%, med: -5%
vs 2019: vol: -3%, med: 36%
Inland:
M-m, vol: 140, 4%, med: 993,000, 6%
y-y, vol: -8%, med: 15%
ytd, vol: -7%, med: 1%
vs 2019: vol: -11%, med: 33%
Beach=Manhattan Beach, Hermosa Beach, Redondo Beach, El Segundo
Harbor=Carson, Long Beach, San Pedro, Wilmington, Harbor City
PV Hill=Palos Verdes Estates, Rancho Palos Verdes, Rolling Hills, Rolling Hills Estates
Inland=Torrance, Lomita, Gardena
Photo by Benoit Debaix on Unsplash