
We’re taking a little different approach with this post. Because it’s not only the end of the month, but the end of the year, we’re doing a quick summary of the monthly data, followed by some more detailed discussion of how the individual areas have fared over the past year. We’ll even try some crystal gazing while we walk through the annual data for each neighborhood.
This is a great place to bring in our At A Glance table. It displays in just a few numbers how all the areas of the LA South Bay are doing compared to last month, and compared to this same month last year.
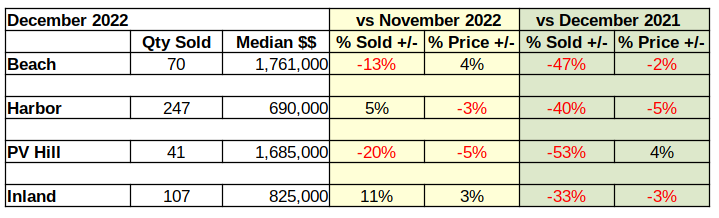
Looking at December vs November, once again the percentage of unsold homes has increased and the number of homes sold below last month’s median price has also marginally increased. More importantly, on a year over year basis the amount of red ink is even greater. Losses in number of sales and in the value of those sales is clearly growing.
Despite all the negative numbers, there may be a light in the future. For the past couple weeks we have observed a softening in the mortgage interest rates. If that turns out to be more than a mid-winter teaser rate, this spring may shine a bit brighter than previously anticipated. We’re not holding our breath though. Recent speeches from Federal Reserve Bank leaders have stated a clear intent to “hold the line” on driving down inflation with mortgage interest rate increases.
Beach Cities Home Sales Down 47%
Compared to 2021, fewer homes have been sold in the Beach Cities every month of 2022 than the same month the previous year. January started the trend with a decline of 28% versus the number of homes sold in 2021. That difference continued to increase all year. By December sales were 47% lower than the previous December.
As the interest rates climbed, the number of home sales dropped. Looking at the total sales volume for the year, 35% fewer homes were sold in the Beach area during 2022, than were sold in 2021. Of course, 2020 and 2021 were the highly erratic pandemic years. So, looking into sales at the Beach for the last few years we find the number of homes sold has already dropped 21% below the number sold during 2019, our last normal economic year. Effectively, the Covid-19 pandemic created. Then erased any gains of the past three years at the Beach.
Homes sold in: 2019 – 1572 (market normal)
2020 – 1572 (market direction down six months, up six months)
2021 – 1910 (market direction down two months, up ten months)
2022 – 1242 (market direction down twelve months)
While the Beach Cities suffered the largest drop in sales volume for 2022, the South Bay as a whole has also dropped below the sales figures for 2019.
Sales Volume Down Across the Board
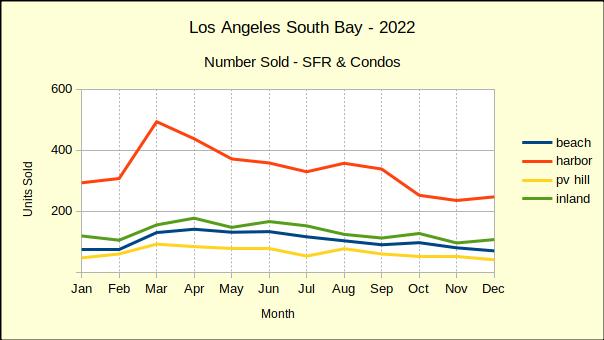
All areas started the 2022 year down from the prior month and down from the same month in the prior year. February results were mixed with the Harbor and Palos Verdes areas showing stronger results. March sales jumped up as buyers realized the rising interest rates were about to price them out of the market. From April on, sales volume across the South Bay was trending down on a year over year basis.
In sheer number of sales, the Harbor area fell the farthest. In 2021 annual sales 5292 homes were sold in the Harbor cities, while in 2022 the number dropped to 4017. That amounted to only a 24% decrease compared to the 35% annual collapse in the Beach areas.
On a month to prior month measure, sales declined six months out of nine across the South Bay. Occasionally one or two areas would post a positive sales month, but in the end, 2022 showed a 26% drop in sales volume from 2021 across the South Bay.
Sales Dollars Diving
With the number of sales dropping in a range of 25% to 50% it’s not a surprise to discover the total dollar value of those sales has taken a dive. As the chart below shows, the first quarter of the year was generally positive, then reality set in and the buyers started walking away. The rest of the year was little more than a measure of the recession.
Monthly revenue in the Harbor area alone dropped $200 million between March and December. The Beach cities and the Palos Verdes area lost about $150 million a month in sales value. Inland area sales for the same period are off approximately $75 million.
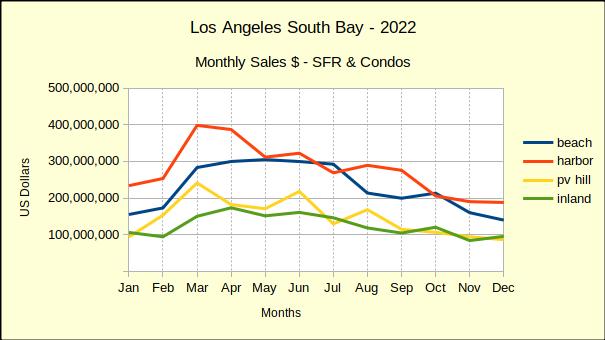
One should consider these declines in the context of the pandemic. Early on, while much of the world was in lockdown, the government flooded the citizenry with easy money, hoping to keep the economy afloat. Mortgage interest rates were already at the bottom because the economy was just recovering from the last recession. The result was a real estate boom starting in summer of 2021, which continued until March of 2022.
The housing market is now in the “bust” part of the cycle and we anticipate it to last through 2023. Gross sales across the South Bay jumped up from $8 billion in 2019 to $12 billion in 2021. That’s clearly unsustainable, especially from the perspective of a Federal Reserve System which is looking for 2% growth. So far the market decline has taken back about 23% of that $4 billion bubble.
Median Price Is Slipping
There is a lull between when buyers stop buying and prices start dropping. Most sellers need to see headlines about the market change before they make a price reduction. Median prices started to slide in August at the Beach and on PV Hill. The year ended with most areas having experienced multiple monthly declines in the median price. Despite that, median prices still exceeded those of 2021 by roughly 7%.
Comparing 2022 to 2019 better shows the inflation factor. Generally speaking the South Bay ended the year with median prices 30%-35% higher than they were in 2019.
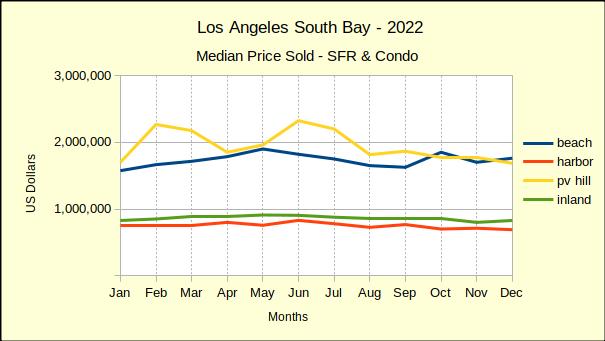
The Palos Verdes market is comparatively small, thus is typically volatile on a monthly basis. The yellow line on the chart above shows the range of high and low median prices. Since mid-year the median price has drifted down and merged into the downward trend.
Year End Versus 2019
We’ve been comparing 2022 to 2019 all year because real estate sales during the height of the pandemic were so out of the ordinary, regular year over year comparisons yielded untenable results. The chart below depicts the current year total sales for the South Bay compared to sales from 2019.
Tracking the blue line, one can see where sales dropped below 2019 values in August, recovered in September, then slipped below again for the fourth quarter of the year. December sales didn’t fall quite as far as projected, but still came in about $200 million less than December of 2019.
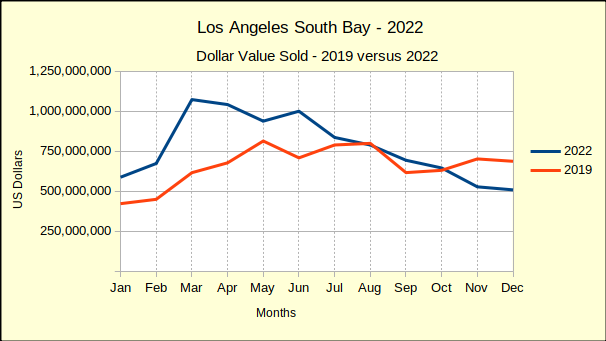
The end of the year reflected accumulated sales of approximately $9.3 billion. That would mean 2022 total dollar sales come in at $1.3 billion above the $8 billion total dollar value sold in 2019. Across the South Bay that was an 18% increase.
Broken out by community, we found total dollars sold in the Beach cities to be 4% above 2019, followed by the Inland area with a 20% increase. Harbor came in next with a 21% increase and the PV Hill with a 35% increase.
We expect both sales volume and median price to continue declining through most, if not all, of 2023. By mid-year of 2024 there should be evidence of the beginnings of a recovery.
Disclosures:
The areas are:
Beach: includes the cities of El Segundo, Manhattan Beach, Hermosa Beach and Redondo Beach;
PV Hill: includes the cities of Palos Verdes Estates, Rancho Palos Verdes, Rolling Hills and Rolling Hills Estates;
Harbor: includes the cities of San Pedro, Long Beach, Wilmington, Harbor City and Carson;
Inland: includes the cities of Torrance, Gardena and Lomita.