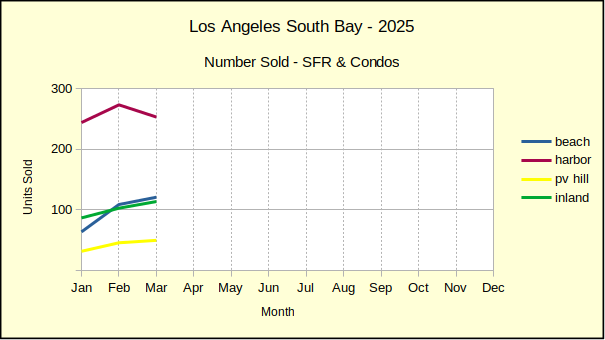
We’re not going to spend a lot of effort talking about month to month real estate activity in this issue. February invariably has more closed sales than January, because the escrows that close in January are for deals that were negotiated in December, when most people were partying instead of buying a home.
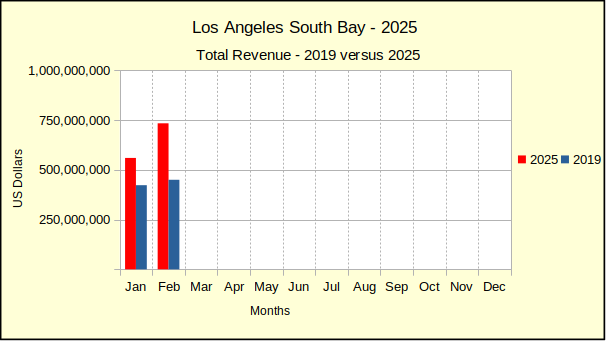
The one monthly anomaly screaming for clarity is the 72% increase in monthly sales in the Beach area, while the total increase in sales for the South Bay is only 20%. That’s a real outlier, and we didn’t have an explanation last year when the numbers were nearly the same. In February of 2025 the Beach came in with a 70% increase in the number of sales closed while the total South Bay monthly increase was 24%. The other three areas are normal and the raw totals are normal, except for sales skyrocketing at the Beach for one month. Perhaps there’s a new tax “loophole” happening?
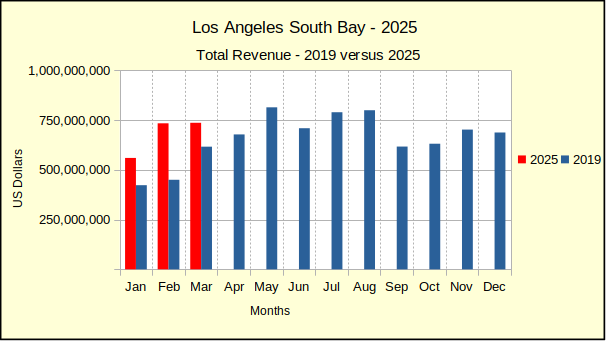
Overall, home sales are still off about 20% from pre-pandemic years. Activity has been gradually catching up, but the projection is for several years of improvement before sales volume is back to what used to be normal. The big surprise in sales volume comes in comparing last month to February of 2025, Last year had shown a solid growth of 19% over February of 2024, with positive numbers in all four areas. This year shows plummetting sales in all four areas, with a drop of 19% across the South Bay.
With that thought in mind, and looking at the year to date, for just January and February, 2024 showed 2% sales growth, and 2025 4% growth. In what appears a total reversal, 2026 is dropping by 18%. It’s still early in the year, so the direction may change. At this point it looks as though economic and war worries may be slowing the number of transactions closing. There was evidence of increased buyer risistance over the last half of 2025. The first quarter figures next month will give a more thorough picture of what to anticipate for the year.
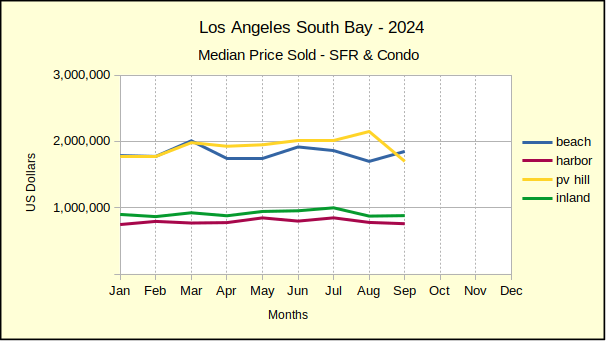
Median Price:
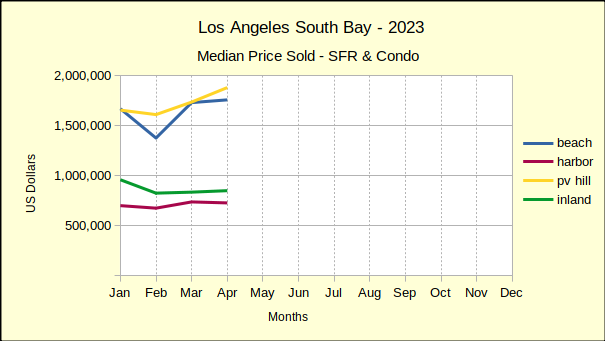
Shifting gear and looking at the median price, shows a similar theme. Once again, the Beach area is showing a super-charged increase in comparison to the balance of the South Bay. The Harbor area was up 1%, the Inland area up 5%, PV down 5%, and the Beach was up 31%!
On one hand, it could be said “Money is migrating to the Beach at an increasing rate.” Or perhaps, “Owners are dumping the Beach for huge profits.” It’s conceivable both are correct. In any event it’s an interesting phenomenon.
Year over year, where the chance to look ahead comes alive, things look much more restrained. The Beach is up 1% in median price, which is significant change from being down 29% in January. At the same time, the Harbor is up 5% and the Inland area is up 2% — all very tame.
Median prices on the Hill dropped by 16%. One needs to remember there is a comparatively small number of homes selling in the PV area on a monthly basis, so one or two unique transactions show up as huge blips in the charts.
Year to date, median prices are more constrained than last year. The Harbor area, the largest of the markets in the South Bay, is up 5% over the same period for 2025. The Inland area is flat, while the Hill is down 10% and the Beach is up 15%.
Continuing on the vein we started at the beginning, the sales being reported now were negotiated in January, before the crisis in West Asia bloomed. This shows a tempered market with pullback in both the number of homes sold and in the median price of those homes. The day to day feel of the South Bay real estate market seems to be continuing on a roughly similar pace, but it will be another month before we can really see the statistical impact. Let’s look again next month.
Beach:
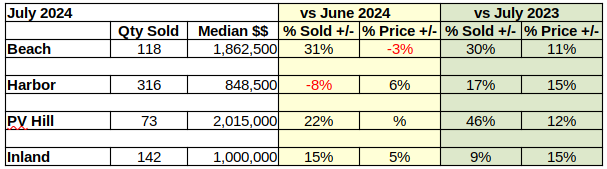
M-m, vol: 91, 72%, med: 2,200,000, 31%
y-y, vol: -17%, med: 1%
ytd, vol: -17%, -13% from 2019, med: -15%, up 63% from 2019
Harbor:
M-m, vol: 220, 21%, med: 800,000, 1%
y-y, vol: -19%, med: 5%
ytd, vol: -22%, -27% from 2019, med: 5%, up 49% from 2019
Hill:
M-m, vol: 36, -27%, med: 1,722,500, -5%
y-y, vol: -22%, med: -16%
ytd, vol: 9%, 10% from 2019, med: -10%, up 36% from 2019
Inland:
M-m, vol: 84, 14%, med: 920,000, 5%
y-y, vol: -18%, med: 2%
ytd, vol: -17, -21% from 2019, med: -0%, up 40% from 2019
Beach=Manhattan Beach, Hermosa Beach, Redondo Beach, El Segundo Harbor=Carson, Long Beach, San Pedro, Wilmington, Harbor City PV Hill=Palos Verdes Estates, Rancho Palos Verdes, Rolling Hills, Rolling Hills Estates Inland=Torrance, Lomita, Gardena
First glance at the month to month December numbers: A 12% increase in December sales brought smiles to a lot of faces, until they realized this only corrected half of the 23% drop in November sales volume. This past year saw a lot of one-step-forward-two-steps-back. The annual numbers make it look like that will continue to be the pattern into 2026. Median prices found gains for the Beach and the Hill, while prices slid in the Harbor and Inland areas.
Year over year, December sales were mixed, with sales volume dropping at the Beach and on the Hill. At the same time, the Harbor and Inland areas experienced solid increases in sales. Median prices for December showed a reverse pattern, with the median increasing at the Beach and on the Hill, while it dropped in the Harbor and Inland areas. This has all the earmarks of being a market peak.
Without getting into details about the monthly statistics, those are covered below, let’s move on to what the year over year data reveals. In the end, 2025 showed a solid 4% growth in sales over 2024. This broke down as: Beach 10%, Harbor 3%, Hill 6% and Inland 1%. It’s important to note the sales volume over the final four months of 2025 were nearly all lower than the same month in the preceding year, showing a persistent drop in sales. Where the early months of the year were overall positive, despite choppy performance, across the board, there has been a slow decline in comparison to last year.
The year began with double digit increases in sales volume across the South Bay, registering 11% in January and 19% in February. The number of homes sold bounced around a lot during the year and ended with a mere 4% increase in sales volume over 2024, with three months out of 2025 being negative.
A slowing in the sales volume doesn’t necessarily dictate a slowing in the median price, although this year it did. The 2025 median for each area showed a 1-2% increase in price everywhere except the Beach were the median trebled to an astounding 6%. One might suspect a bit of investment fever in pricier neighborhoods. Several decades after being a disreputable neighborhood of the displaced and homeless, the Beach areas have become the place to invest extravagantly.
Interestingly, this aligns neatly with a statement in the Federal Reserve’s Beige Report of 1/14/26. “Several Districts also noted that spending was stronger among higher-income consumers with increased spending on luxury goods, travel, tourism, and experiential activities. Meanwhile, low to moderate income consumers were seen to be increasingly price sensitive and hesitant to spend on nonessential goods and services.”
Note, this is not yet a reversal in price increases, like that seen in 2023, but is a distinct slowing of the increase. The rate of increase has fallen from the double digits of 2021 and 2022 to barely remaining positive at about half the rate of 2024. One could easily envision median prices going negative again in 2026.
Such an event might be readily termed “a correction” given that current median pricing is showing roughly 40% above the median from 2019, the last year prior to the Covid pandemic and associated market disruption. That 40% calculates out to about a 6% annual increase, three times greater inflation than the 2% sought by the Federal Reserve.
It has been said the only reason median prices are still climbing at all is the shortage of homes available on the market. Inventory figures appear to be off about 15% from the peak in 2019, just before the pandemic. When the Fed responded to the frozen market and interest rates plummeted, inventory levels fell equally rapidly. By 2022 inventory had dropped to 50% of the 2019 levels. Those home sales, and the huge refinance boom that accompanied them put roughly 40% of the homes in California on a 3%+/- mortgage interest rate. Those homeowners are only selling if absolutely necessary, which is keeping the inventory artificially low and simultaneously keeping median sales prices artificially high.
Beach:
In December, home sales at the Beach increased to 90 units, or 11% greater than November. As noted above, that did not erase the 23% decrease in sales from October to November. At the same time, the median price increased by 4% to $1,825,500.
Compared to December of 2024, the number of residential sales has declined by 16% while the median price increased 1%.
For the year 2025, the number of homes sold at the Beach increased by 10% over 2024. Versus sales for 2019, the market remains depressed by 19%. Sales volume is increasing slightly, but it feels depressingly slow.
For the same period, the median price increased by 6%, which has inflated 45% since 2019.
Harbor:
By virtue of mathematical probability, the Harbor area is the most stable of the four demographic areas in the South Bay. December home sales at the Harbor rose 14% to 298 units, very much in line with the total South Bay increase of 12% over November numbers. At the same time, the median price fell by $779,275, for 4% drop.
On a year over year basis, home sales this December exceeded sales in December of 2024 by 19%. Opposing the volume gain, the median price declined by 3% for the same period.
Looking at the full year, 2025 saw more homes sold by 3%, with the median price increasing by 1%. The bump up in sales volume can be viewed as positive recovery from over-exuberant financing of the Covid years. The median price increase is simply an aggressive response to the low inventory.
Sales for last year fall 22% the volume in 2019, and median prices are currently 40% above those of 2019.
Hill:
November versus December sales on the Hill brought in a zero change for the 45 units sold. The median price showed an increase of 1% to $2 million even for the final month of the year.
Year over year, December ended at a 10% decline in the number of homes sold in 2025, while jumping up for a 14% rise in the median values of those homes. As always, the small sample size of PV sales may lead to extreme results, so feel free to call if you have a specific question.
For the year as a whole, compared to 2024, 6% more homes were sold on the Peninsula in 2025 and the median price was 2% greater. Compared to 2019, sales volume was down by 17% while the median price was up 46%.
Inland:
The number of homes sold in the Inland area for December jumped 14%, to 116, from November, while the median price fell by 3% to $838,500.
Annually, December 2025 gained 9% in sales volume over the same month in 2024. Median price for that period fell by 6%.
Inland sales enjoyed a 1% increase year over year in 2025, while also seeing a 1% increase in median price. Compared to 2019, sales volume remained suppressed by 19%, while median price ended 2025 with a 33% increase.
Beach=Manhattan Beach, Hermosa Beach, Redondo Beach, El Segundo Harbor=Carson, Long Beach, San Pedro, Wilmington, Harbor City PV Hill=Palos Verdes Estates, Rancho Palos Verdes, Rolling Hills, Rolling Hills Estates Inland=Torrance, Lomita, Gardena
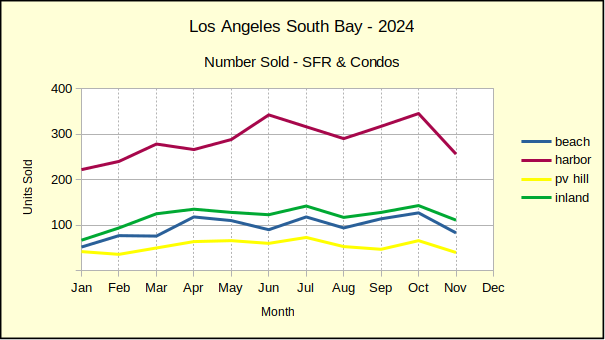
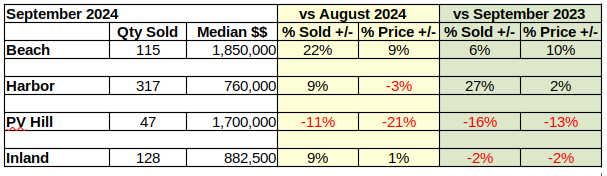
In real estate, sales volume is always a good indicator of market direction, of what buyers are focused on. Looking across this year in the Los Angeles South Bay, with September in the mirror, the number of homes sold each month in comparison to last year, tells a story. The tale starts in January with a healthy 11% increase over January of 2024. In February that number nearly doubled to a 19% increase.
In March the comparison dropped into single digits and through May increases were 2%. 9% and 7%. Buyers were not responding to the homes on the market. Sales were slowing. Then June hit with a zero change and July followed with a -1%—even more slowing. August showed a 10% rebound in sales, frequently attributed to the ‘back to school’ rush of sales closures. For September homes sales dropped back to 0% versus September of 2024.
Essentially much of the annualized increase in the first quarter of the year has evaporated. What was a 30% annual growth is now a 6% growth rate. Delving a little deeper into where in the South Bay changes are occurring shows sales declining in the Beach area (detail below) as well as in the Harbor and Inland areas. Last month sales on the Hill were the only positive influence on the broader South Bay sales statistics (detail below).
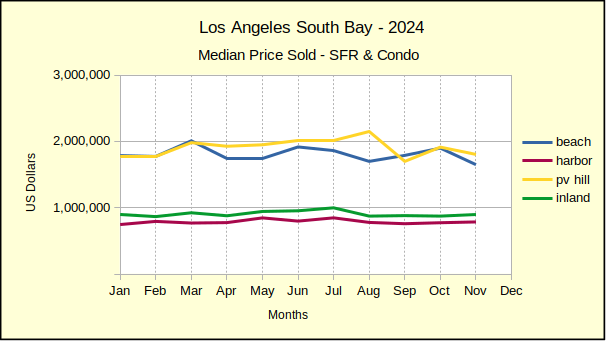
The impact of the slowing homes sales across the South Bay can be seen in the falling prices across the region. September is the first month since January where median prices rose in all four areas. The year started with increases across the board and immediately started losing ground in February with a price decline in the Harbor area. For the next six months median prices slid in more than half the sales recorded, see-sawing back and forth across the four areas.
As of now, with the third quarter of the year complete, median prices are up appreciably only at the Beach. Year to date, compared to the same period in 2024, prices of Beach area homes were 9% higher than last year. However, keep in mind, the other three areas are essentially at zero growth versus 2024. Price appreciation at the Beach has remained stronger than the rest of the South Bay, but appears to be faltering as the year goes on.
So, what should one expect for the balance of the year? Sales are 15%-20% below pre-pandemic levels, while median prices are 30%-50% above. Based on the supposed ideal of 2% inflation, those prices should be around 12.5%, or roughly one third of the increase we’re seeing. At least a few financial CEOs are referring to the current environment as an “asset bubble” in the nature of the 2008 collapse.
A good deal of the price appreciation is a result of lower inventory levels which are not expected to recover until the end of the decade. It remains as a reminder of when interest rates were hovering around 3% and home prices were easily inflated. While many are still riding the wave of inflationary increases, many buyers are balking.
At the same time the economy in general is squeezing the typical home buyer with stubborn mortgage interest rates, an increasing cost of living and shrinking paychecks. It seems apparent something is going to give. Jamie Dimon, of JP Morgan Chase, is reported to have said the market could implode within six months, or could last another two years.
Confining the discussion to local real estate, the market appears to be on course to a point where price resistance causes inventory levels to drop enough to compel sellers to lower prices. Extending the spreadsheet out to the end of the year, while continuing the current trend shows homes sales continuing to decline, slipping to about 4% over 2024 levels for the South Bay as a whole. Median prices at the end of 2025 should be slightly lower than they were in 2024. Probably not by a statistically significant margin, but lower.
Beach:
Monthly home sales at the Beach took a 9% hit in September, dropping to 98 units sold. Month to month sales volume has been up and down throughout the first three quarters. While there have been some dramatic swings—like a 40% drop in January, followed by a 70% increase in February—most of the ups and downs have been confined to a much narrower range.
Looking at monthly median prices, September was $1,962,915, up from last month by 5%, the highest gain since it rose 30% in January. Six of the seven intervening months were negative with August being the only other positive month, and that with only a 1% increase.
On an annual basis, September is the first time in 2025 the number of homes sold in the Beach Cities has dropped below same month sales for 2024. Sales volume has dropped several times in month to prior month sales, but this is the first annual decline.
The Beach had been having an unbelievable year, with sales volume increases in the double digits most months. Then, September plummeted from a 15% increase in August to a 14% decline in annual sales. At the same time, median prices repeated the 10% increase experienced in August.
Year to date, through the third quarter, the number of sales stands dramatically higher than the rest of the South Bay. The 17% increase in volume is nearly three times the 6% found across the region. Similarly, the median price at the Beach came in with a 9% increase, while the median across rest of South Bay was 0%. Will the Beach cities continue the out-size performance seen to date? Probably not, but we have three more months to find out.
Harbor:
Monthly sales in the Harbor area dropped 1% in September, falling to 308 homes sold. This follows a 1% increase the prior month. These small monthly swings indicate a stable market, as opposed to the broad double digit sweeps during the early months of the year.
The median price last month was $795,000 up 2% from August. Since the beginning of the year the month to month price changes have all been in single digits and mostly positive. This contrasts sharply with the Beach area, where monthly prices have fallen nearly every month this year.
Year over year, September home sales in the Harbor area dropped 3%. This is effectively a return to the pattern started in June when sales volume began to slide. August was the outlier, up by 7%, similar to the rest of the South Bay in the month before school starts.
Median prices for this September were 5% above last September. It was also the first increase in the median price since June. The median is beginning to look rather flat at the Harbor.
With three fourths of the year gone, the Harbor area appears to be setting the pace for the South Bay. Sales volume has been shifting down since before the summer buying season and currently rests at a 3% increase in the number of homes sold compared to the same period in 2024. Median prices have been moderating, with a year to date increase of 1% over last year at the third quarter.
As an interesting side note, compared to the same period in 2019, sales volume is down 21% (that ten year Covid deficit), and median prices are up 41% (the Covid bubble?).
Hill:
Any conversation about statistics and the Palos Verdes Peninsula needs to start with an understanding that this is a statistically tiny sample and one or two unusual sales can dramatically skew the results. September of this year is a classic example.
Contravening the direction of the rest of the region, September sales on the Hill skyrocketed 36% over August for a total of 80 homes sold. The median price likewise showed a significant increase, jumping 19% to hit $2,143,000.
Comparing this year to last September shows a phenomenal sales volume increase of 70%. This is nearly three times any similar percentage recorded this year. That same upward leap carried across to the median price which came in at a 26% increase; nearly three times any other increase in the region.
Looking at the detail of this anomaly one finds that in a typical September there are somewhere around 60 units sold on the PV Peninsula. Last year there were only 47 homes sold—this year there were 80. Nothing special, just two successive years going opposite directions in a tiny sample.
Despite the scorching monthly numbers, for the first nine months of the the year, Palos Verdes shows a 10% increase over 2024 sales volume. Still a healthy increase, but much more in line with reality. Median price for the year to date is actually a 1% decrease even though the September statistics show increases in the median. Out of nine months, four have been increases while five have been decreases.
Looking back at 2019, the last ‘normal’ year before the pandemic, reveals sales volume is currently 11% above that of 2019 and the median price is up 45%.
Inland:
The Inland cities experienced an 11% sales decline in September, falling to 188 homes sold, after an anemic August increase of only 2%. Yet another indication the residential real estate market is on a downward trajectory. That fall was accompanied by a surprisingly strong 14% increase in the median price, jumping up to $1,006,000. Month to month sales data for the Inland has been relatively consistent so far this year, with ranges often in the double digits.
Looking back to the same month last year shows an 8% drop in the number of Inland area homes sold. This is consistent with the rest of the South Bay, excepting the fluctuating numbers on the hill (see above). The median price, like the South Bay overall, was strongly positive with a 14% increase.
Looking at the Inland area longer term, comparing the first three quarters of 2024 to the first three of 2025 shows a modest increase of 1% in the number of home sales. This is the lowest increase of the four areas in LA’s South Bay. Year to date across the region is a 6% increase in volume. Sjifting focus to the median price, the record shows 0% change, or at best a rounding error in the 2024 versus 2025 median prices.
Once again, looking back to the 2019 baseline, Inland area home sales volume in down 18% from 2019 and the median price is up 33% from 2019.
Beach=Manhattan Beach, Hermosa Beach, Redondo Beach, El Segundo Harbor=Carson, Long Beach, San Pedro, Wilmington, Harbor City PV Hill=Palos Verdes Estates, Rancho Palos Verdes, Rolling Hills, Rolling Hills Estates Inland=Torrance, Lomita, Gardena
Real estate sales in the Los Angeles South Bay have been a blend of red and black ink all year. Both the sales volume and the median prices have flipped and flopped from month to month. It hasn’t mattered whether the numbers are comparing last month to the prior month, or to the same month in the prior year. They’ve all been crazy with huge, wild swings.
Before the Covid pandemic, about 8,600 homes were sold each year in the South Bay. Because the artificially low interest rates during the pandemic created a rush on the market, many buyers who would have purchased in subsequent years, stepped into home ownership early. In 2024, the market transferred slightly over 6,600 homes, still about 30% below the norm. As a result, the number of homes sold each year is anticipated to continue increasing until the market catches up with the extra 4,000 units sold during the market explosion of 2021.
Despite that, the pace of sales has become sluggish, with property staying on the market much longer, and many times not selling at all. Some are being pulled off the sale market and leased out. A few are being pulled back for refurbishment. Many are seeing multiple price reductions before receiving an offer.
Median prices are declining twice as frequently as they were at the beginning of the year. Of the four market areas in the South Bay, only the Beach Cities have a positive median price for the year to date. The Harbor, Inland and Hill areas are all showing lower median prices as of August. There are four months remaining in the year, so there is still time for the outlook to change. Next month ends the third quarter–let’s see what happens!
Beach:
With the heat of August rising and the pressure building to move before school started, home sales in the Beach cities responded positively. Leaving behind most of the red ink, the only negative number was a 17% drop in the number of homes sold in August versus July. Looking at the raw numbers shows July came in with 130 homes sold, the highest in a single month this year, compared to 108 in August.
Despite the slippage in sales volume, the monthly change in median price showed a 1% increase over July. The month ended positively for the first time after six months, with a median of $1,863,000.
Annual sales volume at the Beach has found 2025 higher than 2024 every month of the year so far. This differs from monthly in that monthly sales have been up only four out of the first eight months of the year. August sales were up 15% from August of 2024. Showing a lot more volatility, the median price in August was up 10% from last year, however, the median had dropped by 1% each of the last two months.
Year to date through August reflects a 22% increase in sales volume, though sales are still down 16% from 2019. The median price was up 8% for the same period, which is 47% higher than in 2019.
Harbor:
With 310 homes sold, the Harbor area had a 1% increase in monthly sales volume for August compared to July. That was matched by a 1% increase in the median price, ending the month at $779,500.
Annually, August turnover showed a stronger 7% increase in sales from last August, though the Harbor area registered below the South Bay total of 10% upturn. Compared to August of 2024, the median price dropped $20,500 from $800,000 creating a reading of -0%.
For the first eight months of 2025 the Harbor area produced a 4% lift in the number of homes sold compared to the same period last year. Sales volume remains 21% lower than it was in 2019, the last pre-pandemic year. Year to date the median price has fallen a modest 1%. Compared to 2019 the median is still 41% higher than it was then.
Hill:
There were 59 homes sold on the Palos Verdes Peninsula in August, representing a 21% decrease in sales for the month compared to July. The fact the Hill is such a small area with so few homes bears repeating at this point. Two or three sales, more or less, can swing the percentages to seemingly ridiculous levels. In August, the median price likewise took a dive, falling 18%, to $1,800,000.
Year over year, comparing the same month in 2025 to 2024, shows Palos Verdes splitting another way. Sales volume was up 11% over last August, and at the same time the median price fell by 16%.
The first two thirds of the year have brought the number of homes sold up by 3%, still 15% lower than in 2019. The same time frame shows median price falling by 2%, though still up 43% from 2019.
Inland:
From July to August the number of homes sold in the Inland area climbed to 133 for a 2% increase. At the same time the median price tumbled 10%, falling to $880,000.
Year over year sales volume jumped by 14% in August, reversing the trend of the past two months where sales fell by a cumulative 15%. The median price bumped up by 1%. The Inland area has only had one other positive month since February.
Year to date sales volume is up by 2%, which is still down from 2019 by 17%. Median price for the same period has fallen 1%, and continues to be 35% higher than 2019.
Beach=Manhattan Beach, Hermosa Beach, Redondo Beach, El Segundo Harbor=Carson, Long Beach, San Pedro, Wilmington, Harbor City PV Hill=Palos Verdes Estates, Rancho Palos Verdes, Rolling Hills, Rolling Hills Estates Inland=Torrance, Lomita, Gardena
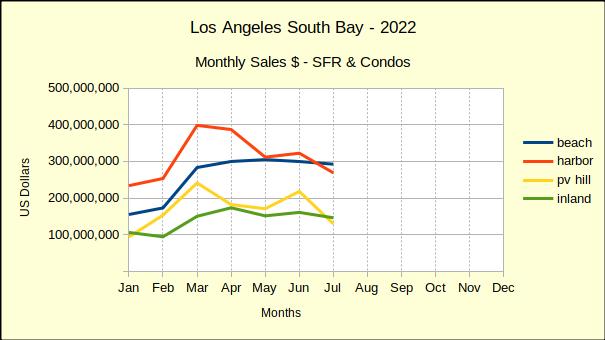
In July the South Bay real estate market made a valiant attempt to maintain a positive stance. It failed. Compared to June of this year, things looked better on the sales volume side, but June was already in the tank, so even the summer bump was only modest help. Looking back to July of last year gave a depressing picture. Overall sales for the south Bay were off by 1%. In itself that’s not a huge number, but considering the market started this year at well over 10%, it’s a big drop in sales.
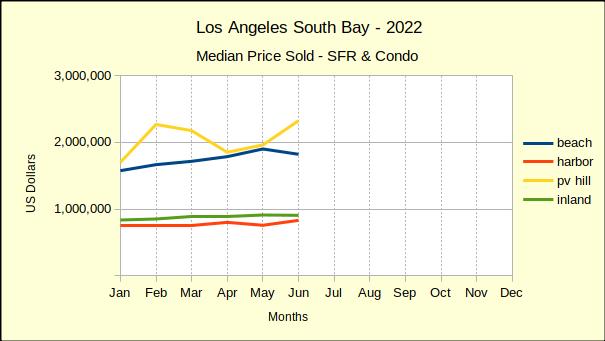
Median price was an even greater disappointment. In January every area of the South Bay was in positive numbers. By July, every area except PV (which has been negative four out of seven months), was shrinking.
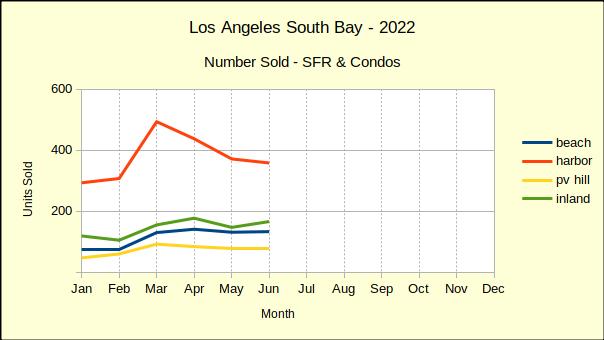
Year to date numbers have overall pointed in an equally negative direction. For the first seven months of the year the South Bay is looking at a 6% increase in homes sold. Compared to the 11% that started the year, one has to conclude the local real estate economy is trending down. The median price tells an even more down-trodden perspective with nearly all areas showing prices falling by 1% to 3% from the same period in 2024.
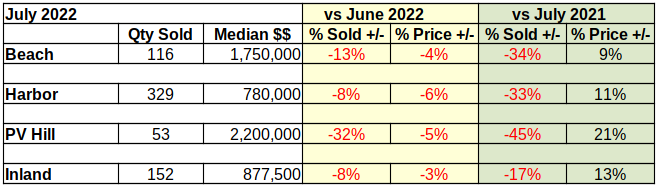
Beach: A One Month Jump?
The number of homes sold in the Beach cities during July jumped to 130 units, up 11% from June sales. Keep in mind, the increase follows a 4% drop in June, which followed a 2% drop in May. Month to month sales have been erratic at the Beach, while annual sales volume has been steeply up compared to 2024. July sales continued the trend with a 10% increase over the same month last year.
Median price is another matter. At the Beach the median came in at $1,844,000, down 3% from June. July was the sixth successive decline in month to month median prices for the Beach area. Annually the median has shown mixed results compared to 2024, ranging from a 32% increase in January to a 1% decline in July. This drop in July followed another 1% decline in June, continuing what looks like a year long slide in median price and in sales volume. While still higher than in 2024, July was the second lowest month this year in terms of homes sold.
Cumulative sales for 2025 were 23% higher than 2024, though still down 15% from 2019, the last normal year of business preceding the pandemic. For the same period, the median price is up 9% over last year, while coming in at 49% above the median in 2019.
Harbor: Volume and Median Down
July was not a positive month for the Harbor area. Compared to June, sales volume and median price both fell by 8%. The number of homes sold for the month fell to 307 units, while the median price dropped to $775,000. This was the steepest monthly drop seen at the Harbor in 2025.
Annual statistics weren’t any better. Looking back to July of 2024, shows sales volume declined by 3%, and the median price fell 9%, the largest annual drop this year. If the current trend continues for the balance of the year, Harbor area real estate may take a serious hit.
Year to date sales through July came in at 3%. While still positive, it’s important to note the Harbor started the year with sales volume at 10% and has been dropping all year. Similarly, the median price has gone from 1% up in January to 9% down in July, ending the first seven months falling by 1%.
A quick comparison to 2019, shows year to date sales volume still down 20% from pre-pandemic business. Median price is still 43% above the 2019 median.
Hill: Strikingly Good
The Palos Verdes Peninsula saw a strikingly good real estate market in July. Month over month sales climbed an astonishing 53%. Of course, it’s not so impressive when one notes that sales dropped 34% last month. Even at that, 75 homes were sold in July, well above the average sold in any month for 2024 and the highest number in yet this year. At $2,185,000, a 13% increase over June, the median price was likewise the highest month for 2025.
Though not as dramatic, the year over year statistics were also impressive with a 3% increase in the number of homes sold compared to July of 2024. Increasing at 8% over July of last year, made PV the only area with a positive median price this month.
Viewing 2025 versus 2024 year to date sales brought another increase of 2%, roughly on par with the rest of the South Bay. Then came the only negative on the Hill for July—a drop of 1% in the median price.
Year to date sales compared to 2019 are still down by 11% , while the median price remains up by 44% from 2019.
Inland: Long Term Slowdown
July versus June numbers showed surprising strength for the Inland area. Those cities kicked the sales volume by 15%, with the number of homes sold climbing to 131 units. While boosting the median price 1%, to $979,000, the Inland area topped the market except for the highly volatile PV peninsula.
The monthly trend reversed with the annual statistics. July 2025 compared to July 2024 showed a 8% drop in the number of sales, accompanied by a 2% drop in the median sales price.
Year to date for the first seven months came with mixed results. Sales volume showed a 1% increase. For the same period, the median price dropped 3%, ending very much like all areas except the Beach, which continued to show positive results.
Once again looking back to 2019, before the real estate market was irremediably shaken by the Covid pandemic, current sales are down 15% and median prices are up 36%. With five months left in the year and economic forecasts leaning toward stagflation, this could well be a tipping point.
Beach=Manhattan Beach, Hermosa Beach, Redondo Beach, El Segundo Harbor=Carson, Long Beach, San Pedro, Wilmington, Harbor City PV Hill=Palos Verdes Estates, Rancho Palos Verdes, Rolling Hills, Rolling Hills Estates Inland=Torrance, Lomita, Gardena
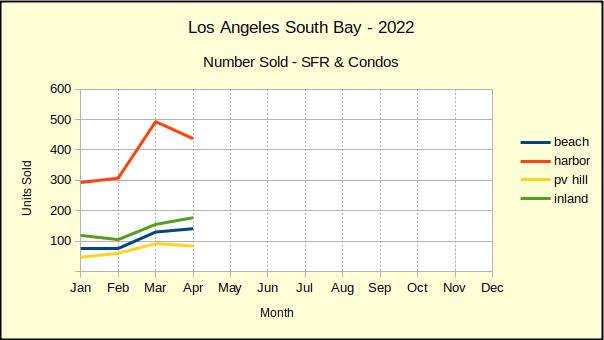
As 2025 rolls by the real estate market in the Los Angeles South Bay continues to slide downward. January started the year with 11% more homes sold than in 2024. Now, with June in the books, the difference is 0% growth in sales across the South Bay. From month to month the numbers are up and down, but the end result is down.
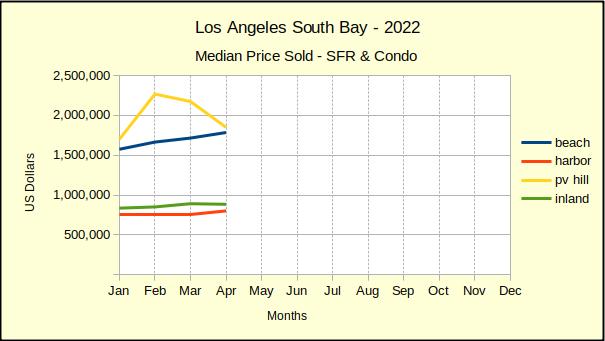
With the exception of the Beach cities, the same thing is true for the median price. The four areas of the South Bay are distinguished from each other by the basic appeal of each area to potential home owners. Comparing real estate from 2024 to 2025 shows a distinct difference between the Beach cities and the other three areas.
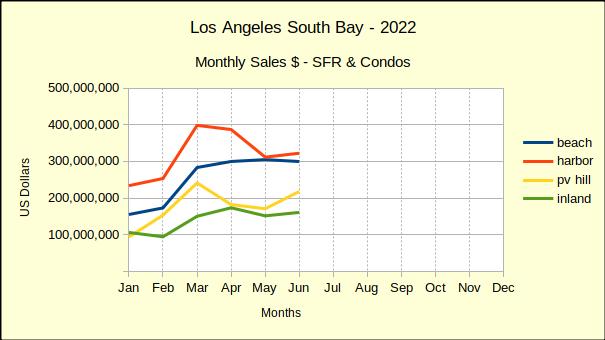
Consider the sales volume, for example. Across the South Bay the cumulative change in the number of homes sold for the first half of each year, shows a 7% increase. However, the Beach area measured in at a 26% increase. The Harbor area was 4%, Palos Verdes peninsula was 2%, and the Inland cities were 3%. Different South Bay buyers are definitely viewing things differently.
Looking at the median price shows a similar story. In the same order, Beach was 11%, Harbor was 1%, Palos Verdes was -1% and Inland was -1%.
Clearly, buyers in the Beach cities have a different perspective than those in the rest of the South Bay. It would take some serious research to study the various purchases, what type of buyer was involved, how the property is currently being used, and how big of a premium the buyer was willing to place on the property, etc., in order to understand the motivations. An early guess is speculation. Buyers with sufficient available resources are speculating that the value will continue to go up without interruption. There might also be some number of those buyers who believe short term rentals will help defray the carrying costs. And probably a few who just want to live at the beach.
The key tying them all together though, is speculation. Those Beach area buyers believe the economy is going to hold and their purchases are going to further advance in value. That opinion appears to be changing though. The June median results for the Beach shifted from positive to negative in what may be an indication of the direction of our economy. We’ll be back next month with an update.
Beach: Mostly Down
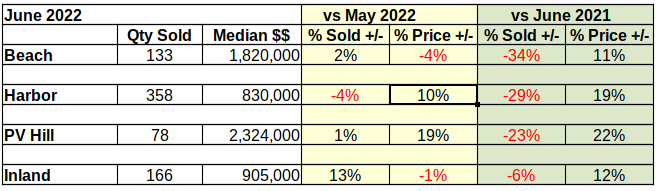
Compared to May the Beach cities real estate performance was a bust. June is the second “down” month in succession for the Beach. At 117 units sold, monthly sales volume dropped 4%, after dropping 2% in May. Median prices in the Beach area have been negative since February. The median for June was a mere $5000 below last month’s $1.9M, leaving a statistically insignificant 0% drop.
In year over year sales volume, the Beach did much better, with a 30% increase in the number of homes sold over June of 2024. However, median price took a nosedive from June of 2024, falling from positive 9% in May to a negative 1% in June this year.
Contrasting the first six months of 2025 to the first half of 2024 lends the Beach cities a win. While the South Bay as a whole saw an increase of 7% in the number of homes sold over those sold in 2024, the Beach area jumped by 26%. For the same period of time, Beach prices climbed by 11%, far better than any of the other three areas.
As a point of reference, the number of Beach homes sold in the first half of 2025 is 17% below the number of sales in 2019, the last “normal” business year before the pandemic. Over the same time frame, median prices have increased 54%.
Harbor: Mostly Up
Real estate in the Harbor area showed surprising resilience in June. With 335 homes sold, sales volume was up 14%. At the same time, the monthly median price of $838,000 at the Harbor was up 3% from the prior month.
In the only decline for the Harbor in June, the annual sales volume slipped slightly with a 2% decline. This was offset by a 5% increase in the median price over the same month last year.
Year to date statistics brought even more positive news for the Harbor area. Sales volume for the first six months of the year was up 4% over sales in 2024. The median price was also up, with a modest increase of 1%.
Much like the Beach cities, when looking back to pre-pandemic real estate, the sales volume is 18% below that of 2019 while the median price is up 46%.
Hill: More Down
On the Palos Verdes Peninsula, the only positive number for June was the median price, which rose from $1.85M in May to $1.94M in June, for a 5% increase. Heading the opposite direction, monthly home sales dropped by 34%, ending the month with 49 sales.
In comparison to 2024, PV cities lost ground in sales and in prices. The number of homes sold fell by 18%, while the median price lost 4%.
With the first half of 2025 in history, homes on the Hill appear to have settled in with modest sales volume increases accompanied by small decreases in price. As of June, homes sales are up by 2% and the median is down 1%.
Compared to the first six months of 2019, Palos Verdes volume is off by 9%. For the same period, the median is up 44%.
Inland: And More Down
After four months of sales growth this year the Inland area flipped with a 20% drop from last year. Running the opposite direction from the sales decline, the median price jumped by 11%, coming in at $965,000.
Year over year statistics likewise ended with a drop in the number of homes sold and an increase in the median price. Compared to 2024 sales volume was down 7%, while the median climbed 1%.
At mid-point in the year, the Inland area is posting a 3% increase in sales over 2024 business. That number seems quite reasonable, especially when compared to the monthly sales which range from 18% increase to 20% decrease. While the total number of sales is down, the median price for the first half of the year is up 1%.
Continuing the year to date comparison with pre-pandemic activity, the Inland area is showing sales at 14% less than 2019, combined with a median price at 38% higher than then.
Beach=Manhattan Beach, Hermosa Beach, Redondo Beach, El Segundo Harbor=Carson, Long Beach, San Pedro, Wilmington, Harbor City PV Hill=Palos Verdes Estates, Rancho Palos Verdes, Rolling Hills, Rolling Hills Estates Inland=Torrance, Lomita, Gardena
The real estate market in the Los Angeles South Bay kicked off 2025 with an 11% increase in the number of residences sold for January. That increase in sales volume was accompanied by median price bumps that ranged from 0% in the Inland area to 32% in the Beach cities.
Fast forward to May, almost halfway through the year, and the sales volume has dropped to a 7% increase over May of last year. With the number of homes selling declining, the median prices have likewise moved from the positive side to the negative. Comparing the median prices to May of last year shows prices falling in three of the four South Bay areas. Only the Beach cities managed to stay positive with a 9% increase, albeit compared to 32% in January. The other three areas dropped by as much as 8%. (See below for more detail.)
This South Bay Market Snapshot shows where the market is shifting and by how much. It’s designed to help clients understand the direction of the market. Those who watch the market trend will see increasing larger chunks of real estate market are sliding toward recession either in the number of homes sold for a given period, or correspondingly dropping in median price. The mid-year report next month should provide a more definitive comment on the future of local real estate.
Beach: Still Up, but …?
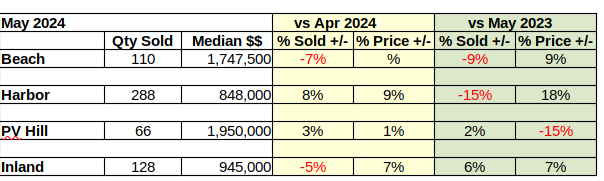
May was not a good month for real estate in the Beach cities, but it was better than last May. The month over month statistics are red ink, with the number of homes sold dropping by 2% and the median price falling 3% from April. Sales volume came in at 122 units, compared to 125 in April. The median price was $1,900,000 down from $1,955,000 last month.
Annual sales volume was more impressive at 11% increase in the number of homes sold. Similarly, the median price at the Beach escalated by a relatively high 9%, compared to the other areas of the South Bay.
Year to date, 541 homes have sold in the Beach area, 25% greater than the first five months of 2024. At $2,000,000 the median price surprises, since the median month to month is only $1,900,000. How could the median for the year to date, be higher? Well, looking at the past few months shows Beach area prices started the year much higher than they are now. In fact, the median in January was $2,355,000—almost $400,000 higher than May. Beach area median prices have been falling every month this year.
Harbor: Sales Slipping, Prices Down
Month over month, sales volume in the Harbor area dropped by 5%, from 310 homes in April to 293 in May. Surprisingly, the median price climbed from $785,000 to $815,000, for a boost of 4%.
Comparing this May to the same month last year gives similarly mixed results, though in reverse. While monthly home sales found May lower than April, annual sales were up 2% from May of 2024. In the same time frame, median prices fell 4% across the year.
For January through May of 2025 the number of home sold rose 6% from last year, for a total of 1373 properties closing escrow. During the same period of time the median price rose 1%, ending at $785,000.
Hill: Sales Solid, Prices Down
Home sales on the Palos Verdes Peninsula for the month of May delivered an increase of 1%, totaling 74 homes. In May, the median price likewise went up, reaching $1,850,000, or 4% more than those sold in April.
Looking at sales volume year over year shows a more varied picture. Last month compared to May of 2024 offers a 12% increase in the number of homes sold. At the same time, the median price tumbled by 5%. One should always be cautioned that with the small number of transactions in peninsula homes, percentages often seem exaggerated, thus it’s important to look at the year to date statistics, too.
For the first five months of 2025 275 homes were sold on the Hill, boosting sales volume by 7% over that of 2024. While the volume came up, the median price went down. At $1,897,000 the median dropped by 2%. It would seem a correction was in the making, though that’s based on memory of other financial “compressions” in recent years.
Inland: Median Prices Continue Down
Monthly sales statistics brought a 12% jump in homes sold in the Inland area. This increase is easily the steepest in the South Bay for May. The next closest rise in sales was the Palos Verdes area with a 1% bump over April volume. The 143 homes sold at a median price of $870,000, a 1% drop from the April median.
The Inland area joined the Hill in yearly sales increases. Both areas registered a 12% jump in volume, coming in at the top, with the South Bay as a whole rising by only 7%. Continuing a trend started in March, Inland median prices once again fell, this time registering the steepest drop across the South Bay, falling 8% below last year’s May numbers.
As the calendar barrels toward mid-year Inland sales volume for the year to date has climbed 5% over 2024 to 575 homes sold. Median prices for the same period rose a very modest $10, settling at $900,000, effectively a 0% increase.
Beach=Manhattan Beach, Hermosa Beach, Redondo Beach, El Segundo Harbor=Carson, Long Beach, San Pedro, Wilmington, Harbor City PV Hill=Palos Verdes Estates, Rancho Palos Verdes, Rolling Hills, Rolling Hills Estates Inland=Torrance, Lomita, Gardena
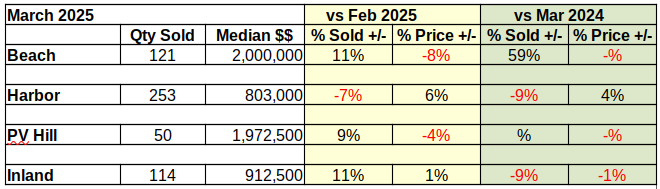
March was not a good month for sellers of South Bay realty. Median prices for residential property collapsed into red territory for nearly all areas. Sales volume was right behind it with falling numbers everywhere except the Beach cities. Even at the Beach, where the number of homes sold rose, the median price went negative.
So to what should this market slow down be attributed? Is it the elevated interest rates? Probably not, since mortgage rates have actually come down, albeit only slightly. Perhaps it’s a lack of inventory? Not likely, as there are more homes on the market in most neighborhoods. Tariffs? There are none on real estate. Has inflation driven off the buyers? Possibly. Median home prices are up in a range from 40% to 74% across the South Bay, though most of that price jump occurred when mortgage interest was toying around the 3% area.
Economic chaos is probably a more accurate answer than any other. Investors like stability, which is not in evidence today. Right now, investors can’t tell from one day to the next, whether to expect recession or inflation. In order to buy low, or to sell high, it’s necessary to know which direction the economy is going. When they can’t tell, investors park their money in the least volatile place they can find.
It’s often called the “investor flight to safety.” So, when the IMF warns of “major negative shock” to the international economy, investments shift to gold and bonds. Right now, both are doing quite well. At some point the investment community will decide real estate has fallen as far as it’s going to, and then we’ll return to—inflation.
Beach:
Monthly home sales in the Beach cities climbed 11% above February, while the median price plummeted by 8%. The number investor flight to safety.of homes sold increased from 109 in the prior month to 121 units in March. The median price dropped $180,000, ending the month at $2,000,000.
On a year over year basis, the sales volume was even more insane, with 59% growth over March of 2024. The last time the local market saw sales numbers this high was during the pandemic, when interest rates were at rock bottom. The craziest part of the story—is seeing that with all those sales, the median price for March actually dropped $10,000. The decline was small enough to register as a 0% change.
Year to date comparisons to the first three months of last year showed similarly divergent percentages, though not quite as radical. Sales volume for the first quarter of 2025 exceeded 2024 by 43%. For the same period of time, the median price at the Beach rose an astonishing 22%. This compared to low and negative numbers across the rest of the South Bay for both sales volume and median price.
Harbor:
Talk about diverse—the Harbor area did a complete 180º turn on the Beach area. Monthly, the Beach was: volume – up, median – down; the Harbor was volume – down, median – up. The Harbor came in with a 7% drop in number of homes sold, falling to 253 units from 273 last month. The median sale was $803,000, a 6% increase over last month’s $760,000.
The same diversity, or is it perversity, kicked in on the yearly statistics. Compared to March of 2024, this year the Harbor area dropped 9% in the number of homes sold, while the median price of those homes climbed 4%.
First quarter home sales at the Harbor continued to climb, though not as aggressively as the Beach area. The sales volume rose 4%, which is more in line with business on the Hill and for the Inland area. For the same time frame, the median price fell 1%.
Hill:
Month to month sales in Palos Verdes showed a 9% increase, climbing from 46 units in February to 50 in March. While the number of homes sold climbed, March saw a 4% drop in the median price.
Comparing March of 2024 to this March brought 0% change for both the number of homes sold and the median price. Exactly 50 homes sold in both years. The median price actually declined by $10,000, though the change was statistically insignificant.
There was also no change to the sales volume for the first three months of this year. Median price on the Hill rose 11% for the first quarter of 2025.
Inland:
While March brought 11% growth in the number of homes sold compared to February, the Inland area challenged market pressure and registered a 1% increase in the median price. With 114 sales for the month, compared to 103 for last month, the Inland area maintained positive volume. At the same time, the median price improved by $12,500, up from the February median of $900,000.
Annually, March flipped the statistics, with both the sales volume and the median price dropping. Home sales fell by 9%, the same decline the Harbor area experienced. The median price was off 1%, which doesn’t seem like much until compared with the 40% growth since 2019.
Year to date the Inland area showed 6% growth in the number of homes sold compared to the first quarter of 2024. Like the Harbor area, the Inland area delivered a significant drop in the median price, coming in with 0% change.
Beach=Manhattan Beach, Hermosa Beach, Redondo Beach, El Segundo Harbor=Carson, Long Beach, San Pedro, Wilmington, Harbor City PV Hill=Palos Verdes Estates, Rancho Palos Verdes, Rolling Hills, Rolling Hills Estates Inland=Torrance, Lomita, Gardena
Since summer of 2023, South Bay real estate has been erratic, inexplicable and highly inflationary. Both the sales volume and the median price jump up, and then down, and then up again with no apparent rationale. For example, the number homes sold in the Beach cities was up 29% in December, down 40% in January and up 70% in February. Over the same months, the median price in the the Beach cities went up 9%, up 30%, and down 7%. Those are huge jumps, and with contrary indicators.
Some of that crazy action made sense during the pandemic, but post-pandemic, where the economy should be leveling out, all the numbers should be moving in the same direction, consistently.
The number of homes sold should be on the increase constantly until 2027/2028, as sales stabilize following the out-sized impact of the low pandemic-era interest rates. Those low interest rates caused a sizable percentage of future buyers to step up to the plate earlier than they would have normally. Those buyers will not be back in the market for another four to five years, at the earliest.
The median price of those homes should be increasing in line with the Federal Reserve target of 2%. The fact that they are increasing one month and dropping the next indicates a dysfunctional market. The degree to which prices and sales are bouncing around indicates an out-of-control economy.
Why is this a problem? The list price of your house is determined by recent sales. When the recent sales are all over the map, your broker is hard-pressed to get your asking price correct.
Typically, we try to provide some sort of a forecast for the coming months. Unfortunately, the fundamentals are not lining up in any direction right now. Maybe next month.
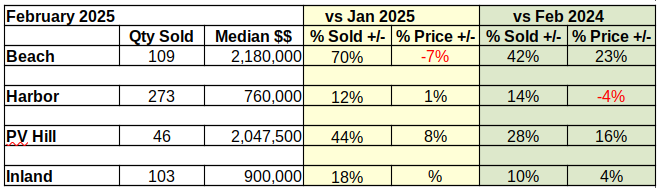
Beach: Sales Up, Prices Down
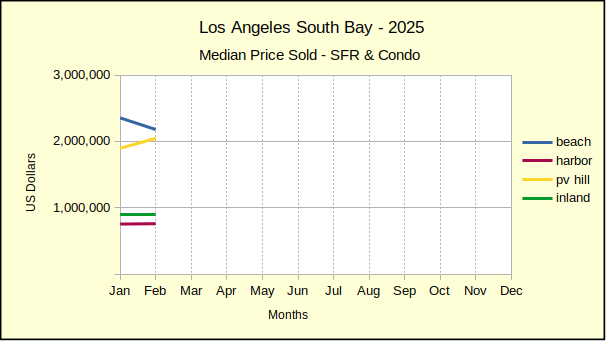
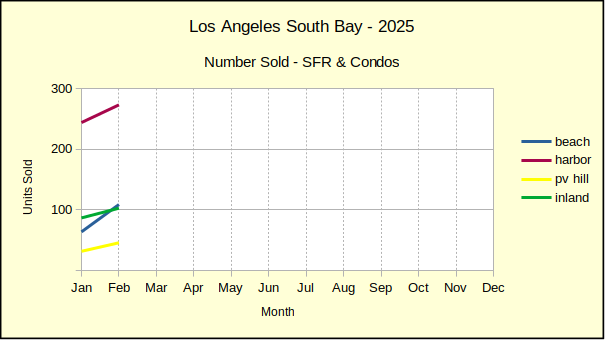
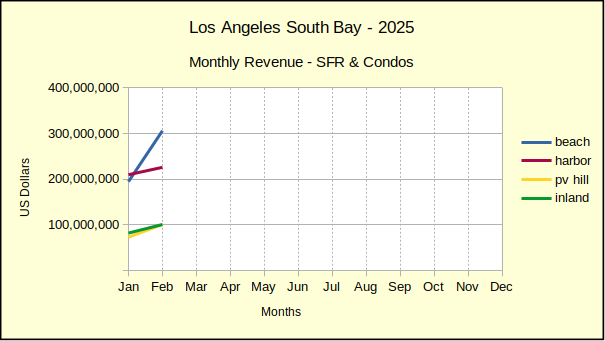
The number of February home sales in the Beach area jumped to 109, 70% above those of January. At the same time the median price dropped 7%, ending at $2,180,000.
Compared to last year, February sales were up 42%, with an annual increase in the median price of 23%.
Year to date, sales of homes rose 34% versus the first two months of 2024. Median prices for the same period increased by 27%.
Harbor: Sales Up, Prices Up
On a monthly basis, sales volume in the Harbor area jumped by 12%, ending with 273 homes sold in February. Median prices for the Harbor climbed 1%, reaching $760,000 for the month.
While year over year sales volume was up by 14% for February, the annual median price at the Harbor dropped 4%. This marks the first annual decline in median price at the Harbor since 2023. Economic volatility has created a lot of wide monthly swings, but the variances annually have been more restrained.
Compared to the first two months of 2024, the number of homes sold increased by 12%, despite negative sales volume in January. Median prices fell by 2% for the same period.
Hill: Sales Up, Prices Up
From January to February sales of home on the Palos Verdes Peninsula increased by 44%, from 32 to 46 units. That jump was accompanied by an 8% growth in the median price, matching the 8% increase of last month. The February median price came in at $2,047,000.
Comparing February sales this year to those of last year shows a 28% rise in the number of homes sold. Likewise, the median price climbed 16% from last February.
Looking at year to date for 2025 versus 2024, sales volume is flat at 78 homes sold for the two month period. In the same time frame, median prices have shot up by 11%, clearly an inflationary statistic.
Inland: Sales Up, Prices Flat
February home sales in the Inland area hit a total of 103 properties, registering an 18% increase in volume over the prior month. The median price for February came in at $900,000, exactly the same as January.
Looking back to last February shows a 10% increase in the number of homes sold, along with a 4% rise in the median price.
Combined home sales for January and February of 2025 surpassed sales of 2024 by 18%. The median price went up by 2% for the same period.
Beach=Manhattan Beach, Hermosa Beach, Redondo Beach, El Segundo Harbor=Carson, Long Beach, San Pedro, Wilmington, Harbor City PV Hill=Palos Verdes Estates, Rancho Palos Verdes, Rolling Hills, Rolling Hills Estates Inland=Torrance, Lomita, Gardena
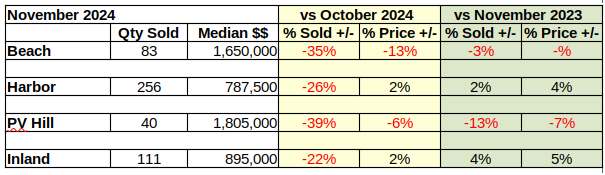
On the heels of an encouraging October real estate market, November saw the South Bay market plummet into the red. Compared to last month the number of homes sold fell by nearly 30%, while the median price collapsed at the Beach and on the Hill. At the same time, the Inland and Harbor areas showed modest growth in median price, posting a 2% gain in both areas.
This was a surprising downturn following across the board sales growth in the October market, accompanied by generally positive price appreciation.
Looking at year over year, same month sales provides a slightly more positive result. Both the Beach and the Hill show the number of homes sold down by 3% and 13% respectively. The Harbor area maintained sales growth of 2% while the Inland area increased by 4%. Both areas were off substantially from the 20-30% increases of October.
Year over year median prices were equally depressed. The Beach and the Hill, the high end of the South Bay market, both lost ground in the single digits. The Harbor and Inland areas, which make up the bulk of sales in the South Bay, grew at 4% and 5% respectively.
It’s too early to attribute this shift to the election results because most of the transactions closing escrow in November would have been negotiated in October. If anything, the decline reflects nervous anticipation leading up to the election. December sales will provide a much more definitive indication of how the public has reacted to the election results.
For right now we know that current sales volumes are running about 10% below December of 2023. And, we know that December last year was lower than December 2019 by 30%. Back at the end of October conditions seemed to be improving, but today it would seem we are still trying to climb out of the Covid trough.
Beach: Sales Off 35% for November
The number of homes sold in the Beach Cities dropped from 127 in October to 83 in November showing a 35% decline for the month. At the same time the median sales price dropped from $1.9M in October to $1.65M in November for a loss of 13%.
On an annual basis sales volume was off by 3% compared to last November, while the median price was flat.
Year to date, 1,059 Beach homes have been sold compared to 1007 during the first 11 months of 2023. This is a 5% increase in the number of homes sold. The median price rose 7% from $1,675,000 last year to $1,787,500 year to date.
Harbor: Sales Fall 26% in November
Harbor area home sales plunged 26% from October, dropping to 256 units from 345 sold last month. At the same time the median price climbed 2%, to $787,500 from $775,000.
On the flip side, same month, last year sales moved the opposite direction, rising 2% this year compared to 252 homes sold in November of 2023. The median price this November was up 4% over the $760,500 recorded in November of last year.
With only one month remaining in the year, the Harbor area displays modest increases in both the number of homes sold so far this year and the median price of those homes. Annual sales have reached 3,160 to date, 3% higher than last year’s 3,076. Median prices for the year have climbed from $740,000 last year to $780,000 this year.
Hill: Market Drops 39% for the Month
Home sales on the Palos Verde Peninsula dove down 39% from October to November, wiping out all but 1% of last month’s gain. As mentioned in the October issue, during the last quarter of 2023 mortgage interest rates were hitting around 8%, which drove the South Bay market to a standstill. The fact 2024 sales volume is falling below 2023 is a concerning matter. Interest rates are once again pushing up against 8%, which has been an impenetrable barrier in recent years. While the number of homes sold dropped precipitously, the median price came in with only a 6% decline, falling from $1,914,500,in October to $1,805,000 in November.
Comparing November of 2023 to November this year turned up a steep fall again. This year brought a sales volume decrease of 13% accompanied by another 7% drop in the median price.
As 2024 heads for closure, the dramatic swings of earlier in the year are mellowing out. Through November, the 597 sales on the Hill have settled in at just 1% above last year. Similarly, the median price, which has ranged from an increase of 26% to a decrease of 15% throughout the year, is coming in at 3%, or $1,927,500.
Inland: Home Sales Collapse by 22%
November sales of 111 homes in the Inland area totaled a 22% drop from the 143 sold in October, rounding out a total decline of 28% for South Bay real estate this month versus last month. Despite the fall in month to month sales volume, the Inland area enjoyed a 2% increase in median price over October.
Same month last year sales increased by 4%, moving up from 107 units in 2023. At $895,000, the median price for November Inland area homes was up by 5% over the $851,000 of last year.
Looking at year to date sales volume of 1,313 shows a mere 1% increase over January-November of 2023 when 1,302 homes sold. Median price fared higher, with a 3% jump from $867,500 to $895,000 this year.
Beach=Manhattan Beach, Hermosa Beach, Redondo Beach, El Segundo Harbor=Carson, Long Beach, San Pedro, Wilmington, Harbor City PV Hill=Palos Verdes Estates, Rancho Palos Verdes, Rolling Hills, Rolling Hills Estates Inland=Torrance, Lomita, Gardena
At the end of the third quarter for the real estate market in the Los Angeles South Bay, 4,958 homes have sold, compared to 4,959 sold during the same period in 2023. Essentially, that is 0% growth. Median prices, however, have climbed over 5%, despite the high interest rates.
Sales activity across the South Bay was mixed, though in a narrow range. The Inland area saw 2% fewer home sales on a year to date basis than last year. At the same time, the Palos Verdes Peninsula gained 2% over 2023. The Beach area was up 1%, while the Harbor area came in flat.
Median prices during the first nine months of the year recovered the losses of the same period in 2023. Last year, median prices fell nearly every month from January through September, only beginning to recover growth in September. This year the median price has shown a strong increase since the beginning, ranging from 4% for the Inland area to 8% for the homes on the Hill. The Beach and Harbor areas rose with 7% and 6% respectively.
It looks like this winter is going to continue the wild ride. The Federal Reserve lowered the prime interest rate by half a point in September. Then, after a positive employment report for September, mortgage lenders raised their advertised rates back up to where they were in mid-August! The national election will undoubtedly have it’s own impact, even here in our relatively placid part of the world.
Among the early market indicators which may give us a hint of where the market is headed, one not commonly discussed is the number of homes which don’t sell. The comparison is established by looking at the number of home listings which are expired, cancelled or withdrawn from the market versus those which closed escrow. During the first three quarters of 2024, out of 6,179 homes on the market, 4,958 of those sold. At the same time, 1,221 or, 20% of the total, failed to sell. These percentages are not significantly different than a normal year.
In a high turn-over market such as that of 2021, at best one might expect as little as 12% to not sell versus a slow-moving market where one might expect as much as 25% to fall off the market unsold. It would be fair to say the local market for real estate is languishing, but it appears to remain afloat despite volatile news in all corners of the world. The next issue of this newsletter will arrive after the national elections. There should be more to talk about then.
Beach: Sales Lag and Prices Leap
With 114 homes sold in September, the Beach Area sales jumped up 21% above August figures. The median price likewise took a 5% leap to $1,790,000 in monthly sales.
Comparing September 2024 home sales to the same month in 2023 reveals a less dramatic shift. The number of homes sold is 6% greater this year and the median price increased by 7%.
Year to date sales volume of 849 homes at the Beach showed a modest 1% increase over the first nine months of 2023. Monthly variations have been as high as 33% and as low as -27% during the first three quarters making the cumulative 1% value a bit of a surprise. Equally surprising in light of the 1% growth in the number of homes sold, is the 7% increase in median price to $1,787,500 for the same period of time.
Harbor: Sales Slow, Median Prices Up
Monthly sales in the Harbor area totaled 317 units in September, a 9% increase over the number sold in August. At the same time, the median price for Harbor area homes dropped 3% to $760,000.
Looking at year over year sales for the month of September showed a 27% growth in home sales over 2023 and a 2% increase in median price.
During the first three quarters of 2024 2,559 homes were sold in the Harbor area, compared to 2557 last year, registering as a 0% change. The median price for year to date sales came in at $780,000, a 6% increase over the same period in 2023.
Hill: Plenty of Red Ink
August was a particularly busy month in Palos Verdes real estate, so the 11% drop in sales volume for September was somewhat expected. Falling from 53 homes sold to 47 is a short fall, but the marketplace on the Hill is small, so percentages escalate quickly. The median price also took a nosedive from $2,150,000 to $1,700,000, a 21% drop. Interestingly, those prices are the highest and the lowest in PV for 2024.
September of last year was exceptionally strong on the PV Peninsula, both in terms of sales volume and price. As such, the relatively anemic sales of September 2024 brought lots of red ink. The number of homes sold fell by 16%, while the median price came down 13%
Year to date, PV has had five positive months and four negative months. Cumulatively, the Hill has a 2% increase in the number of homes sold, going from 481 last year to 491 this year. During the same nine months, the median price moved up 8% ending at $1,950,000 for the period.
Inland: Mixed Results on YTD Activity
Month to month home sales in the Inland area were modestly positive. With 128 units sold in September, the volume was up 9% from August activity. The median price gained 1%, coming in at $882,500 for the month.
Comparing September of 2023 to this September brings a 2% decline in the number of homes sold. The median price for the same comparison also dropped 2%.
The first nine months of the year arrived with 2% fewer sales than the same period last year. The Inland area was the only part of the South Bay to fall in sales volume or median price so far in 2024. Year to date the median price rose 4% above 2023, to $899,990 the slowest growth of the South Bay areas.
Beach=Manhattan Beach, Hermosa Beach, Redondo Beach, El Segundo Harbor=Carson, Long Beach, San Pedro, Wilmington, Harbor City PV Hill=Palos Verdes Estates, Rancho Palos Verdes, Rolling Hills, Rolling Hills Estates Inland=Torrance, Lomita, Gardena
July brought a bonanza—of sorts—to real estate in the Los Angeles South Bay. Sales volume, which had been falling below last year for three of the last four months jumped up 20%. Granted, July was an unusually slow month in 2023, compared to most years including 2024.
Month over month showed a comparable increase. Total sales volume was up 6% from June to July. The only negative for monthly sales was in the Harbor area where activity was off by 8%.
More importantly, year to date through July, sales volume was up 1% across the South Bay compared to the same period in 2023. With over half the year past already, some growth is a positive sign. This close to November on a presidential election year, one would expect the market to be looking better than it has been.
In fact, The number of homes being sold has still not recovered from the pandemic. Sales this July were 22% fewer than they were in July of 2019! As discussed previously, because the mortgage interest rates were temporarily at rock bottom, about 40% of the homeowners in California currently are “trapped in a mortgage they can’t afford to leave.” This promises to maintain downward pressure on home sales for the better part of a decade. Paradoxically, the reduced inventory is contributing to rising prices.
More homes were being sold in July, and they were being sold for greater prices. Annual increases in the median price were up 15% in entry level neighborhoods. At the Beach and on the Hill median prices didn’t reach quite as high, but were still more than 10% above July of 2023.
Monthly pricing showed the contrast between high end and entry level homes more clearly. In the Beach area the median dropped 3% from June, while on the Peninsula, there was no change in the median price. In contrast, the Harbor and Inland areas rose 6% and 5% respectively over June numbers.
Comparing the first seven months of this year to last year shows inflation continues to plague the real estate economy. Median prices rose in a range between 6% and 9% in the South Bay during the period.
Beach: Highest YTD Sales Volume Increase
Sales in the Beach cities jumped from 90 homes in June to 118 in July for a massive 31% monthly increase. This was matched by a 30% annual increase over July of 2023. Month to month statistics, as well as same month last year comparisons have shown tremendous variability this year.
The rapid fire changes precipitated by the pandemic, and subsequently by the Federal Reserve in an effort to keep the economy under control, created wild swings in the number of homes sold. At the same time the shifts in median price were less frequent and considerably less wide-ranging.
Today, looking at the year to date summaries for both, sales volume and median price, the numbers have moderated greatly. Sales volume at the Beach measured against last year has ranged from negative 27% to positive 33%. That huge range smoothed out to 6% growth in the year to date view.
Likewise, the median price, which has been a bouncing ball, declined 3% from June and increased by 11% over July of last year. Comparing the year to date from 2023 to 2024, the median settled in with a 6% increase for the longer term perspective.
Harbor: Highest YTD Median Price Growth
Monthly sales volume in the Harbor area fell 8% to a total of 316 homes sold in July compared to 342 sold in June. Annual sales moved the opposite direction, rising 17% from July of 2023 to July this year. For the first seven months of 2024 sales have fallen 1% compared to the same period last year.
Median prices had fallen 6% in June and have reclaimed that loss with a 6% growth in July. The new median, $848,500, is a 15% improvement over July of 2023. Year to date the median price is up by 9% in the Harbor area over the same seven month period in 2023.
Interestingly, every month this year has been a growth month for the year over year median price at the Harbor. The lowest increase has been 4% in March and again in June. The highest has been 18% in both February and May.
Hill: Highest Median Price In South Bay
Monthly data for the PV Peninsula came in with 73 homes sold for a 22% increase in volume over June. Annually, sales showed a 46% increase over July of 2023, a welcome change from the 24% drop in June vs June numbers. Year to date sales posted a 4% increase in volume over the same seven months in 2023.
PV registered a 12% annual increase in median price to $2,015,000 in July, so far the highest median in the South Bay for 2024. It doesn’t quite reach the $2,300,000 of May, 2023, but is one of the more impressive months in recent years. The monthly increase from June was negligible, but the timing in 2023 coincided with a downward shift in median sales prices. So, the change shows up as a 8% increase in the year to date median.
Inland: Median Price Hits $1,000,000 First Time
Sales volume for the Inland area jumped in July—up 15% month to month for a total of 142 homes sold, and up 9% since July of last year. Being past the halfway point of the year boosts the value of the the year to date statistics which come in at a mere 2% through July.
At the same time, the July median sales price for the Inland cities climbed 15% above July 2023 and hit $1,000,000 for the first time! Last year’s number was pretty run-of-the-mill so lends some import to this year’s improvement. The 2024 year to date median price calculation supports the strength shown by the monthly and annual numbers with a solid 7% increase over 2023.
Why Use Median?
A brief comment on median price and why it’s often used in real estate: Averages are used for a great many things in making comparisons, and for things that change frequently, averages do a great job. Medians, on the other hand, minimize the ‘jerky’ nature of averages and show directional movement better than a lot of up and down action.
A median is exactly the middle of a group of numbers, so that half are higher and half are lower. So the impact of a single outlier number shows less distortion on the longer term trend line of the values. In other words, it’s easier to see what your investment will likely be worth in 10 years.
Most of us don’t buy houses often enough to care about movement over the last 30 days. We’re interested in staying put for 10 years, plus or minus. The median trend will show us the most likely path.
Beach=Manhattan Beach, Hermosa Beach, Redondo Beach, El Segundo Harbor=Carson, Long Beach, San Pedro, Wilmington, Harbor City PV Hill=Palos Verdes Estates, Rancho Palos Verdes, Rolling Hills, Rolling Hills Estates Inland=Torrance, Lomita, Gardena
Photo catalina_from_wayfarers_chapel.jpg by Carl Clark
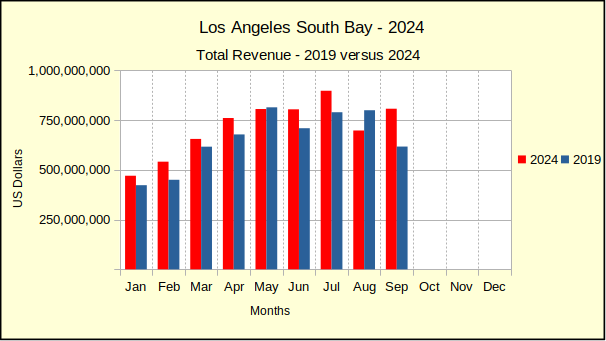
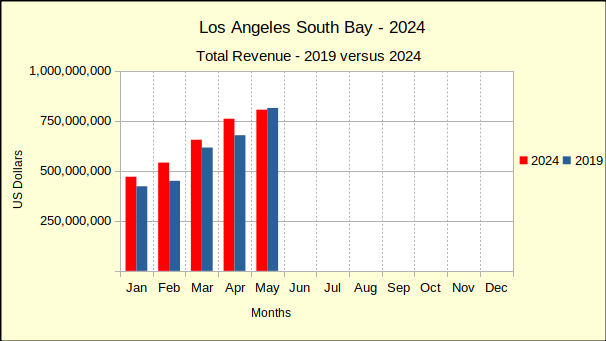
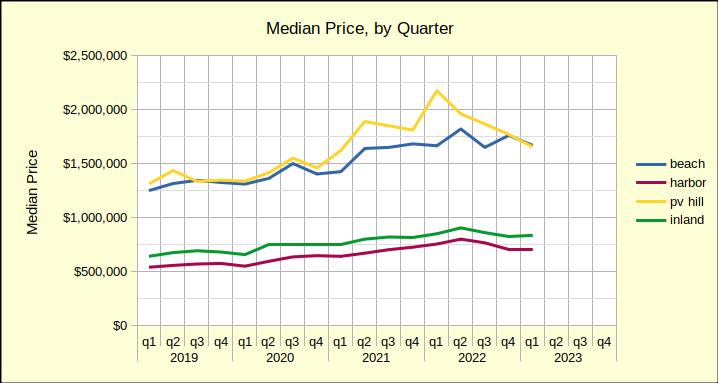
Median prices for real estate around the Los Angeles South Bay have risen over 40% since 2019, the year before the corona-virus pandemic. Comparing the median prices and sales activity for the first half of 2024 shows increases approaching 50% for the five year period in all areas across the South Bay.
Over the same time period, sales volume has plummeted by 22%, falling from 4,022 in 2019 to 3,149 in 2024. The Beach cities have been particularly hard hit with a 34% drop in the number of homes sold during the first six months of the year.
Looking at 2024 versus 2023 shows a similar pattern with median prices up nearly 10% from the first half of last year. The Beach area showed the lowest increases, coming in at 5% above the 2023 median.
Sales volume was off by 2% across the area with the only positive being the Beach at a mere 1% above 2023 numbers. As the 2024 year has progressed, the number of sales has declined in total. Simultaneously, more and more parts of the South Bay have fallen into negative growth.
As of the end of June, 2024 sales figures for all areas were negative in comparison to June of 2023. While the number of homes sold has consistently declined through the first half of the year, median prices have been equally persistent at increasing over last year. Most experts are attributing the increasing prices and decreasing sales to the shift from an ultra-low mortgage interest rate during the pandemic, to a comparatively high rate currently.
When rates were at the lowest, many homeowners took advantage of the opportunity to refinance at the incredible rates. Those folks are now in a position where they would incur a painful increase in monthly living costs if they were to move. That has resulted in about a 40% reduction in the number of homes typically available on the Multiple Listing Services (MLSs).
At the same time, the increased mortgage interest rates have pushed a significant number of potential sellers out of the market because they no longer qualify for the loan they would need to trade up to a larger or newer home. That reduced the available inventory of resale homes even further and became another contributing factor to the bidding wars among the few buyers still in the market.
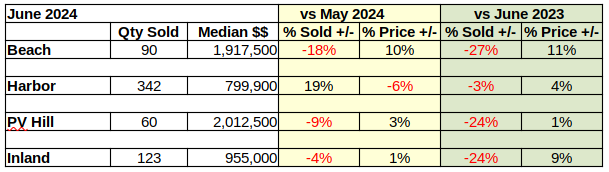
Beach: Down 18% in Sales May to June
Monthly sales volume fell from 110 units in May to 90 homes in June, for an 18% drop. Median price jumped 10% in one month to end at $1,917,500.
Year over year, the number of homes sold declined from 124 in June of last year to 90 this year for a loss of 27%. Median price for the Beach climbed 11% over the year.
Year to date for the first half of 2024 versus the first six months of 2023 shows a modest increase of 1% in sales volume along with a increase of 5% in median price.
Harbor: June Median Price Off by 6%
The Harbor area was the outlier for June. While month over month sales collapsed and pricing jumped for the other three areas, Harbor sales of 342 homes boosted sales by 19%, coming in well above the 288 homes sold in May. Meanwhile, median price went the other direction, dropping from $848K in May to $799,900 in June, for a decline of 6%.
Year over year statistics went the opposite direction, following the rest of the South Bay. Sales volume fell by 3%, dropping from 124 in 2023 to 90 in June of this year. Meanwhile the median price was up 4% for the year, rising from $772,000 last June to nearly $800,000 this year.
The first six months of 2024 brought a year to date sales drop of 4%. The median price in the same period climbed 9%.
Short term changes, as from month to month, have been unpredictable since the pandemic. Looking at the longer term, there is consistency in the declining sales volume and increasing median price. With 2024 a presidential election year, it will be interesting to see how long this direction holds.
Hill: Year Over Year Sales Fell 24%
With a reputation for wildly shifting statistics, the Palos Verdes Peninsula came in with relatively modest decline of 9% from May sales. Similarly, the increase in median price was very tempered at only 3%.
The sales volume for same month last year was anything but mild. June of 2023 reported 79 homes sold versus 60 homes in June of 2024. That’s a 24% drop in volume from last year. While a fourth of the 2023 sales disappeared, the median price eked out a 1% increase, going from $2,000,000 last June to $2,912,500 in June of 2024.
In what is becoming a familiar trend, the year to date sales volume is down 2%, and the median price for the first six months of the year is up 7%.
Inland: June 2024 Sales Drop 24% From 2023
The Inland area showed the smallest month to month change of the South Bay. The 4% drop in sales volume from 128 homes sold in May to 123 in June was minor. Likewise the 1% increase in median price from $945,000 to $955,000.
Like the Hill, the Inland area had a radical drop in sales from June of 2023 to June of 2024. Falling from 161 homes sold last June to 123 sold this June resulted in a 24% drop in transactions. Median price in the same period rose 9%, from $875,000 to $955,000.
Interestingly, there has been no statistically significant change in the sales volume for the first six months of the 2023 and 2024 years. It actually increased by three units from 669 homes sold in 2023 to 672 homes sold in the first half of 2024. For the same time periods, the median price climbed by 6%.
Beach=Manhattan Beach, Hermosa Beach, Redondo Beach, El Segundo Harbor=Carson, Long Beach, San Pedro, Wilmington, Harbor City PV Hill=Palos Verdes Estates, Rancho Palos Verdes, Rolling Hills, Rolling Hills Estates Inland=Torrance, Lomita, Gardena
South Bay median home prices are continuing to climb! May versus April showed increases as high as 9% for the month. Comparing May of this year to last May gave increases as high as 18% for the year. Year to date statistics for the first five months of the year came in with increases as high as 11%. Looking at the same five month period from five years ago shows median prices have climbed by nearly 45%.
Mortgage interest rates have roughly doubled from two years ago. The Federal Reserve Bank kept raising rates, hoping to drive inflation down. Unfortunately, it doesn’t seem to be working in the real estate world.
So far this year the interest rate increases have only modestly slowed purchases in month to month data. The number of homes sold in April was 10% higher than in March. May shows a 2% increase in the number of homes sold compared to April. Year over year sales volume shows a greater impact, with an 8% drop from May of 2023 to May this year. Most of that decline was lost this year as home sales for the year to date are up 1% from last year.
Once again looking back five years shows sales are off by 22% across the board from pre-pandemic sales volume. All while median prices are up 45%! But, there are very few homes on the market, and the shortage of inventory is driving price increases, contrary to the Fed goal of slowing inflation.
So why are there so few homes for sale today compared to 2019? And why are prices climbing in the face of mortgage interest rates that have doubled?
One possible factor: During the pandemic mortgage interest rates were at and below 3%. A significant number of existing mortgages were refinanced during the 18 months of the pandemic. Another 17% of currently existing mortgages were purchases at those rates. In summary, about 50% of the current mortgage market is now holding a note with an interest rate that is a fraction of today’s rates. There is essentially no reason for those folks to ever move.
Since about 80% of California homeowners carry a mortgage, and about half of those have an historically low interest rate, about 40% of homeowners have an incentive to stay where they are now, rather than trade up, as would be normal. Given the financial benefits, those homeowners are not likely to put their home on the market and increase the inventory thereby relieving some of the supply and demand imbalance.
Forty percent is a huge piece of the available housing stock to be removed from the market in a time of a housing shortage. Work-related re-locations would have once smoothed this out, but the “work from home” movement has also contributing to the slowing real estate market. The current outlook is for several years of low inventory, further exacerbating the increase in housing costs.
Eventually the inflation of housing prices will come under control and annual increases will get down to something less than 6%. There’ll be no attempt to “dial back” the inflation and return to a prior point in time. So the short term question is, “How do we adjust to the new reality of higher prices, fewer homeowners, and more renters?”
Beach: Anticipate Fewer Sales & Higher Prices
Monthly statistics have been misleading in recent months in all the areas. May activity at the Beach is a great example of the disparities. Compared to April, 7% fewer homes were sold in May with no change in the median price. Contrast that with the annual numbers where sales in May of this year are down 9% from 2023 but the median prices are up 9%.
By looking at data for the year to date, the sporadic ups and downs can be smoothed a bit. This shows a more complete picture of what the market is doing in comparison to last year. In summary, the first five months of the year show a 10% growth in sales for the Beach cities, accompanied by a 6% increase in the median price.
Early projections for June indicate an annual decline from the same month last year sales of over 15% and a price increase of nearly 20% in the Beach area. If these preliminary estimates hold true, there will be some serious hand-wringing among the financial community.
Harbor: More of the Same
Like the Beach area, month to month statistics for the Harbor area have been very volatile this year. The number of sales in May climbed 8%, after falling 4% in April. May’s median price was up 9% following a 1% increase for April.
Year over year, sales volume was down 15% compared to May of last year, while the median price jumped 18%. This follows the general trend of declining sales and increasing prices. Theoretically, the declining sales will induce sellers to reduce their asking price, which will then translate to a reduction in the current inflation rate.
With the year to date sales volume dropping by 5% the interest rate increases would appear to be working. But the increase in median price by 8% for the first five months of 2024 throws cold water on the idea that inflation in real estate is going away.
More of the same is projected for June with a drop of 15% in sales and an increase of 5.5% in median price.
Hill: Sales Volume and Median Prices Up
Only 66 homes sold on the PV peninsula in May, compared to 64 in April, so the 3% increase in sales volume is not terribly consequential. Likewise the 1% growth in median price from $1.93M to $1.95M.
As mentioned in previous articles, activity levels on the Hill are small, so it only takes a minor change to look statistically important. For example, 65 home sales in May of 2023 versus 66 in May of 2024 is only one more home sold, but represents a 2% growth in volume. Even more so, the $2.3M median price from May of 2023, which is an exceptionally high monthly median price in PV under any circumstances, makes the 15% decline to $1.95M look huge in 2024.
In reality, the May median price is actually higher than the year to date median of $1.93M and higher than all but the March median of $1.98M. January through May sales volume is up 4% and the median price is up 11%, very much like the rest of the South Bay.
June sales are projected to decline slightly with a modestly elevated median price.
Inland: Sales Up and Prices Up
From April to May the number of homes sold in the Inland area declined by 5%, much as the Beach area sales volume transacted. Unlike the Beach and PV, where median prices ended barely positive, the median increased by 7% in the Inland area. That hefty increase mirrored the Harbor area lift of 9% month over month in the median price.
A 6% increase in the volume of homes sold and a 7% rise in the median price from May of 2023 to this May deviated from the other areas. It displayed a stronger than expected sales volume, especially considering the Beach and Harbor areas were deeply negative. At the same time the median price showed a slower increase than either the Beach or the Harbor.
Year to date for the first five months of 2024, the Inland area showed an increase of 8% in the number of homes sold, and a solid 6% increase in the median price. All in all, an investment in one of the inland cities would have been a good performer in May.
That investment is projected to still be sound in June, with a small decrease in the number of homes sold and a similar increase in the median price.
Beach=Manhattan Beach, Hermosa Beach, Redondo Beach, El Segundo Harbor=Carson, Long Beach, San Pedro, Wilmington, Harbor City PV Hill=Palos Verdes Estates, Rancho Palos Verdes, Rolling Hills, Rolling Hills Estates Inland=Torrance, Lomita, Gardena
April of 2023 ended with a 40% drop in the number of homes sold across the South Bay compared to 2022. The median price was down 20% from last year in Palos Verdes and is up by a mere 1% at the Beach. Year to year median prices across the South Bay are down approximately 5%. Cumulative sales revenue for the first four months across the South Bay has dropped 39% from 2022 numbers.
Year to date, 2023 has been one of the slowest markets we’ve seen in recent years. Sales are off by 43% in the Beach Cities and are down by 22% across the South Bay compared to last year. Median prices escalated dramatically in 2021-2022, and are still above those of 2019 by 30-35%. However, the median has fallen in all four areas since late last year. We anticipate the median price continuing to drop until interest rates seriously decline again.
Business in the years between 2019 and 2023 was seriously impacted by the pandemic, and the massive government funds released to counter the effect of the pandemic. Looking back at 2019 and comparing it to 2023 offers a perspective on where the market is and where we can expect it to go during the balance of the year. Today we see a huge decline in the number of homes being sold. That has yet to translate into a significant decline in median prices, although 75% of year over year sales show prices falling.
At the same time the Average Days On Market (ADOM) has increased from about 7 days during the sales boom of 2021-2022 to about 30 days now. That’s a four-fold increase in the amount of time it takes to sell a home. For a seller who needs to move, that will feel like an eternity. It’s that sense of urgency that drives prices down and ultimately results in a shift of the market.
At the Beach “Sticky Prices”
Sellers in the Beach Cities had a good month in April—at least compared to March of this year. Compared to April of last year, the picture is far worse.
The number of homes sold in April was up 8% compared to March. That sounds positive, until the realization that sales volume was down 36% compared to April of 2022. At the same time, the median price was up 2% versus last month, and down 2% compared to the same month last year.
There’s a lot of talk among brokers these days about “sticky prices.” Recent sales at the Beach offer a good example of what that means. The statistics show that sales are down 36% from last year, however prices have only dropped 2%. Sales are falling because the number of viable buyers is down.
Interest rate increases have pushed the most tenuous group of prospective buyers out of the market. At the same time, sellers are still revelling in the boost to median prices that came with record low interest rates during the pandemic. Beach area sellers have yet to adjust to the reality of a re-trenching economy. That adjustment is “sticky prices.”
Harbor Sales and Prices Off
The neighborhood can affect how long it takes the median price to respond to changes in the economic environment. While sales volume and pricing has remained strong at the Beach, sellers and buyers in entry level communities are impacted more immediately by shifts in the economy.
Thus we see the give and take of the market bring median prices into a stable range early in the year in the Harbor area. The red line in the median price chart below shows four months of reasonably steady prices. While month over month prices have shown only a 1% drop, the monthly sales volume has taken a 12% dive from March, as shown in the Sales Volume chart, above.
The monthly decline in sales was multiplied in the year over year statistics. April sales volume was down 39% from April of 2022. For the same period, the declining sales volume was coupled with a 9% drop in median price. So the entry level communities demonstrate a much quicker and deeper response to changes in the financial picture.
Part of that response is the time on market, which has risen from 15 ADOM in mid-2021 to 26 ADOM in April of this year. The increasing time required to sell homes contributes to the number of homes available on the market. Both factors contribute to falling purchase prices.
Palos Verdes In Extremes
Through 2021 and 2022 home prices on the Palos Verdes peninsula benefitted from the Covid pandemic more than any area in the South Bay. In the median price by quarter chart, shown below, the yellow line is seen jumping up and away from the blue line of the Beach Cities. Unfortunately for home owners on the Hill, that price boost has already pulled back into line with prices of Beach area homes.
Comparing the first four months of the 2023 to 2022 median prices on the Hill have dropped 16%. It’s a steep decline in view of decreases at 3% and 6% in the Inland and Harbor areas, respectively. Even more so when looking at the 1% increase at the Beach.
The statistics look much better when comparing Palos Verdes sales from 2023 to statistics from 2019, the last “normal” year of real estate business. Sales volume on the Hill is down a modest 13%–modest by comparison to the Beach, which is down 43%. In contrast, median prices in 2023, compared to 2019, are still showing positive growth of 30%.
So, if one were to take the Federal Reserve System position that 2% annual growth is a desirable target, where would prices be today? The median price in Palos Verdes in May of 2019 was $1.5M. Jump forward to 2023 and that becomes about $1.6M. The median on the Hill last month was $1.9M, which suggests further price reductions.
Inland – The Steepest Fall
From an investment perspective, homes in the Inland area of the Los Angeles South Bay are “bread and butter.” These are the homes, much like those in the Harbor area, which reliably increase in value over long periods of time at a slow and steady rate. Most importantly, they house the bulk of our community.
In the short term, Inland home sales volume is down 25% from March to April of this year. Median prices are up 2% for the same period. This is the steepest fall in number of homes sold in the four areas charted.
Year over year, sales volume is off even more at 43% below April of 2022, and prices similarly down by 4%. We expect a seasonal boost to sales for the second quarter, when families most frequently schedule moves. Beyond that, most predictions are for continued softening in the real estate market as the Fed struggles with inflation. (The April Consumer Price Index, [CPI-U] for Los Angeles metro was 5.2% for Housing.)
Last year saw home sales in the South Bay escalate dramatically as buyers sought to become homeowners while interest rates were still abnormally low. With interest rates rapidly rising it’s no surprise that sales are plummetting in 2022. The Harbor area, traditionally an entry level market, handily out-sold the balance of the South Bay with a drop of only 26%. The remaining areas suffered sales drops ranging from 42% to 47%, with the South Bay as a whole dropping 35%.
Compared to last year, cumulative South Bay home sales were down 21% as of September. The first three quarters of 2021 saw 7767 townhomes and single family residences sold, versus 6163 during the same period this year.
Recognizing that 2020 and 2021 were exceptionally aberrant, we also compared the 2022 year-to-date sales volume to 2019, the last normal year of business prior to the pandemic. As of the end of September 2022 cumulative sales volume was 4% lower than it was for the first nine months of 2019.
The decline from 2019 sales is uneven in that the biggest drop, 15%, is seen in the Beach area, which is typically at the high end of the market. Sales in the Harbor area only dropped back by 2%, while sales in the Inland area fell by 4%. The Palos Verdes peninsula fared best, actually increasing in quantity sold over 2019 by 4%. As always we offer a cautionary note when looking at statistics for property on the PV Hill. Because there are considerably fewer homes in that area, percentile statistics can take large swings.
Median Prices Mixed in September
The number of homes sold in 2022 has declined, indirectly affecting the median price of those homes, as well as the total dollar value of all the homes sold in the same period. A closer look at the median price of homes sold through September yields some surprising changes.
Since prices increased dramatically during the coronavirus pandemic we anticipated finding the median price from 2022 to be considerably higher than that of 2019. Indeed, that is the case with the median in the Beach area up 31% over that of 2019, the Harbor up 36%, PV Hill homes up a staggering 47% and the Inland area up 30%. But, that is gradually reversing.
July and August of this year showed depreciation in the median price across the South Bay. Prices consistently dropped in a range from 2% down (Inland) to 18% down on PV Hill. September sales broke the pattern with only the Beach cities losing value per the median. The Inland area was flat, showing no change from August. In an unexpected twist, both the Harbor area and the Hill came in with an increase in the median price. The growth was modest, up 6% for the Harbor area and up 3% for the Hill. Despite the slight improvement in September prices we anticipate continued downward pressure as inventory grows and time on market stretches.
Looking at the median price on a year-over-year basis, we find September with minor declines from August. The Palos Verdes cities showed prices dropping by 2% last month and this month. At the same time the Beach cities dropped 2%, while the Harbor and Inland areas increased by 4% and 2% respectively.
Median prices started 2022 with increases regularly coming in well above 10% growth. In April we saw the first negative where the median for the Hill fell 2% from 2021. Since then we have watched the rate of price appreciation decline from double digits until now in September with both the Beach and PV areas losing value.
We fully expect all areas of the South Bay to reflect declining median prices before the end of the year. While prices will be down on both a month-to-month and year-to-year basis, we don’t anticipate the median to fall below 2019 price points this year.
Total South Bay Sales Dollars
When the number of sales is decreasing and the median price of those sales is also decreasing, one has to assume the gross revenue will also decrease. Governor Newsome has been warning for several weeks that the 2022-23 fiscal year will not see the State level revenue surpluses California has been enjoying.
During the first quarter of 2022 gross revenue from real estate sales remained predominately positive, with year-over-year growth rates of about 6% per month. Since March the South Bay has only seen two instances of sales growth, 7% in the Harbor area for April and 3% in the Inland area for June. Every other entry on the chart is negative, with September declines averaging about 40%.
Cumulative sales for the first three quarters of 2022 were off by 29% compared to 2021. Our monthly sales dollars chart shows a zig-zag downward trend since spring of this year. Of course, 2019 is a more realistic point of comparison as a result of market gyrations created by the pandemic and our government’s fiscal response.
Comparing 2022 sales totals to 2019 yields a clearer picture of the current direction of the market. Instead of a sea of red ink, we can clearly see that 2022 sales have remained above those of 2019 with the exception of August. Sales started normally, then in March the Federal Reserve Bank announced a .25% interest rate hike, and promised more to come.
Buyers threatened with increasing monthly payments jumped into the fray and pumped sales up for a couple months. Then a new .5% increase, accompanied with the promise of multiple .75% increases throughout the year began a downward slide in home sales that is continuing.
Following the trajectory of the maroon line, and assuming the interest rates continue to increase, we predict 2022 sales will drop below 2019 again in October. The Federal Reserve Bank has already announced plans for another .75% increase in November, followed by a .5% increase in December. Adding another 1.25% will bring the full increase for the year to 4%. We envision the fall in sales growing steeper, bringing total sales below that of 2019 for the final quarter of the year.
Statistical Summary
This would be the heart of the discussion if we were dealing with a normal fiscal environment. Here we could talk about month-to-month changes and changes from the same month last year to this year. Instead we’re faced with an unanticipated side effect of the pandemic—out-of-control inflation followed by a steep recession.
The areas are: Beach: comprises the cities of El Segundo, Manhattan Beach, Hermosa Beach and Redondo Beach; PV Hill: comprises the cities of Palos Verdes Estates, Rancho Palos Verdes, Rolling Hills and Rolling Hills Estates; Harbor: comprises the cities of San Pedro, Long Beach, Wilmington, Harbor City and Carson; Inland: comprises the cities of Torrance, Gardena and Lomita.
Goodbye Marymount, Hello UCLA!
Marymount California University, is no more. But, shed no tears! The prestigious University of California at Los Angeles plans to open the site for classes in the fall of 2023-24. Escrow had not yet closed as of this writing, but all appears to be moving forward at good speed.
We are told the finalists included four developers and three educational institutions. We’re pleased that UCLA was the successful bidder. We’ve heard some of their ideas and look forward to having them as neighbors.
However, we’re also interested in what kind of potential the developers saw in this deal. There’s a total of 11 acres already developed as residential and 24.5 acres developed as a campus. What would that have looked like if a residential developer purchased the site?
The 24.5 acres, some of it with gorgeous ocean views, is the jewel in the transaction. A little “back of the envelope” calculation says that using an average of 15,000 square feet per lot, Which is about the average in that neighborhood, one could build about 70 high end homes at the location. New construction on similar sites is selling for about $7.5M today, giving a value for the finished project of approximately $525M. Not bad for a land purchase of $80M, especially considering we haven’t started looking at the 11 acres.
There exist some legal complications in the 86 unit, 11 acre property. Deed restrictions purported to require the land to be used to house students. That can readily be accommodated by an educational institution, like UCLA. Developers on the other hand might have to pay some serious legal costs to do anything else with the land.
And it might have been worth the legal expense. A quick look at the apartment building market in the South Bay shows roughly comparable buildings selling for about $420K per unit. That would make 86 units worth about $36M, almost half the stated purchase price.
We’ll never know what might have been. The entire South Bay can look forward though, to an educational revival. A refreshed campus with UCLA’s academic resources and access to the university program at AltaSea and other port projects is a great starting ground.
With four months left in a very chaotic real estate year, we want to take this opportunity to lay some ground work for understanding why the market has headed into a recession. And, to keep things on a positive note, we end with a couple of suggestions on how you might profit from this turn of events.
Some of the nation’s most respected analysts (including Ivy Zelman of Zelman & Associates and Mark Zandi of Moody’s Analytics) are predicting recessionary price drops ranging from 10-20% and lasting through the next two years. (Arguing that we’re only looking at a brief correction, pundits at Goldman Sachs and the Mortgage Bankers Association continue to predict single digit growth.) Meanwhile, here on the street, we’re watching prices drop across the board for the second month in a row.
In August we reported that median home prices across the Los Angeles South Bay fell from July, the prior month. Now looking at August sales we find all four areas of the South Bay showed declining median prices again. The month-over-month price drops ranged from 6% at the Beach to 25% in the Inland cities. (See bottom for description of areas.)
Underlining the month-to-month price slippage, three of the four areas also showed declining prices versus the same month last year. Only in the Harbor area are homes still selling for more than they did in 2021. Even there, median price has slid from 9% down to 4% above August of 2021.
2022 Compared to “Normal” Business in 2019
The past two years have seen real estate stumble with the Covid lockdowns in 2020, then skyrocket with the low interest rates in 2021. It’s worth a look back to 2019 to see how the current conditions compare to the most recent “normal” market.
Looking at sales volume in the period January through August of 2019, 1064 homes had sold in the Beach cities. So far this year only 905 homes have sold. That is a 15% drop in sales since the last normal year of business. The trend line for the Beach area has been sliding downward since April.
For the first eight months of 2019 the Harbor area showed sales of 2955 compared to 2945 for this year. That is a drop of .3% – a statistically insignificant change. However, the trend line has been dropping since March. August sales were up slightly from July, which was an unusually slow month for the Harbor area. We expect sales to continue a downward trajectory into 2023.
Palos Verdes home sales for the same period in 2019 totaled 537 versus 568 in 2022. The Hill is the only part of the South Bay where year to date 2022 sales exceed those of 2019. At 6% it’s a healthy increase, too. Despite being the best performing area in South Bay, Palos Verdes sales volume peaked in March and continues to slide. Sales in July were unusually weak, so August shows an upward step in the trend line.
Sales in the Inland area, very much like the Harbor area are down only .4% from 2019 sales for the same period. The difference is statistically insignificant, and the trend line is headed downward.
Declining sales volume creates a larger inventory of homes to sell. As the inventory grows, sellers have more competition and buyers become more demanding and prices start declining. We anticipate continuing growth of available inventory, followed in late fall or early winter by a spate a price drops.
Median Price Up 54% Since 2019
Palos Verdes homes have seen the greatest impact of the Covid-era buying mania. Comparing median prices from the first eight months of 2019 to the first eight of 2022, we find a 54% escalation on the Hill. Normal growth over a three year period would have created 9-10% in price appreciation. Expect much of that excessive price expansion to be erased over the coming months.
Compared to 2019, Beach area median prices have shot up by 32%. This is easily three times normal growth. As we see in the chart below prices started adjusting downward as early as May in the Beach cities.
Since 2019 median prices for the Inland area have climbed 30%. Here in the August 2022 chart below we see Inland area prices have been dropping steadily since May when the median was $910K. During that four month period values have slipped by over $50K.
In the Harbor area home prices have escalated 34%. From 2019 at $565K to 2020 at $607K the Harbor area median grew $40k. Then in 2021, it added another $90K reaching $700K. So far in 2022 the median has reached as high as $830K – another $130K increase, but has now dropped back to $725K, losing $105K off the June median.
Most home buyers are constrained by their income to a particular price range, and salaries have not increased at a rate even remotely similar to real estate prices. Recent studies have shown about 25% of potential buyers were priced out of the purchase market in California by the soaring Covid-era prices.
Interest Rate Shrinks Annual Sales Dollars
In total sales dollars for January through August of 2019, the South Bay weighed in with $5.3 billion. During the same period in 2020 the aggregate amount shrank back to $4.9 billion, followed in 2021 by an upward explosion to $7.9 billion. So far in 2022 the area has reached $6.9 billion.
Each time the Federal Reserve System (fed) increases the short term interest rate the pool of potential buyers shrinks again. As this is written, the Fed is preparing to increase the rate by at least .75% in mid-September and two more increases are anticipated by the end of 2022.
At the current rate of declining value, we estimate the 2022 annual sales value to be approximately $9.5 billion, a decrease of 27% from 2021. Remember that huge budget surplus California had last year? Do not anticipate another this year, and possibly not for a couple of years as the state works its way through this recession.
The Silver Lining in the Cloud
One theory of success in real estate is “Buy low, sell high.” Flippers subscribe to that concept, buying at the bottom, updating and selling at the top of the immediate market. Another theory, not as well supported, but statistically more profitable, is “Buy and Hold.” Buy a piece of property at the best price you can and use it or lease it but – never sell it.
A deep market adjustment doesn’t come very often, so when it does one should take maximum advantage. At the moment it appears there will be a heavy price contraction starting late this year. We’ll know better in late fall and early winter, but all indications today are that a wise property investor should be preparing to buy at the bottom of the market – soon. We constantly search the Southern California coast for outsstanding investment bargains. Tell us what you want to invest – we’ll tell you where to buy.
Methodology
For purposes of comparing homes in the LA South Bay, we have divided the South Bay into four areas. Each is composed of homes of roughly comparable style, geographically similar location and physical characteristics, as well as approximately similar demographic characteristics.
The areas are: Beach: comprises the cities of El Segundo, Manhattan Beach, Hermosa Beach and Redondo Beach; PV Hill: comprises the cities of Palos Verdes Estates, Rancho Palos Verdes, Rolling Hills and Rolling Hills Estates; Harbor:. comprises the cities of San Pedro, Long Beach, Wilmington, Harbor City and Carson; Inland: comprises the cities of Torrance, Gardena and Lomita.
The 2022 recession appears to be coming in stronger and faster than predicted. Year to date home sales in the South Bay have dropped -17% compared to 2021 sales through July. Month to month, the change from June to July was -12%. The July drop followed a lackluster June performance of only 1% over May which was itself down -13% from April.
Money was cheap and readily available in 2021, and the Federal Reserve Bank (Fed) was fore warning everyone that the mortgage interest rates were going to rise. The number of homes sold sky-rocketed, purchased both by owner-occupants and by investors hoping to snag interest rates at the absolute lowest in decades. Along with that came the bidding wars and the escalating prices. Looking back, one can readily see a correction in the making. At the time most experts were considering 2021 a trade-off for all the transactions lost during the 2020 lockdowns.
The last year we could consider normal was 2019. Compared to 2019, the number of homes sold during the first seven months of 2022 is nearly identical, hinting at a return to normalcy. However, a deeper look shows recent months dipping as much as -25% below 2019 sales volume. If sales volume continues to drop at this pace, we can anticipate starkly lower prices before the end of the year.
Steeply climbing interest rates have cost today’s buyers over 25% of their purchasing power so far in 2022. Some of those potential buyers will simply buy a less expensive home. Some of them will wait and save longer for the down payment. Some of them will become permanent renters. On the other hand, sellers have fewer options. They can decide not to sell, if that’s possible for them, or they can lower the price until a buyer can afford the home.
Median prices fell in all four market areas for July versus June of the current year. The overall drop was approximately -5%. (See chart below for detail.) So far in 2022, median prices have remained higher than those from last year. But, since April of this year median prices have consistently fallen on the year over year comparison. As noted earlier, we anticipate the median price dropping below last year sometime this fall or early winter.
“Should we wait to purchase?”
We hear this question a lot, and the answer is an unequivocal “No.” In the end result, chasing the elusive “bottom of the market” is a fool’s quest. By definition, when one recognizes the bottom of the market, it‘s already gone. We recommend that when you find a home that meets most of your needs and is within your budget, you should move on it.There are several reasons.
First, because the Fed is already projecting future interest rate changes which could easily eclipse the savings to be found in a correction. Alternatively, those future rates will prevent some potential purchasers from qualifying for a loan.
Second, because economics today is a web that reaches around the world. As we have seen just in the first few days of August; allowing grain movement on the other side of the world will affect our stock market, and available interest rates overnight. We live in a very volatile world and a perfect deal today may not exist tomorrow.
Sales Volume Down, Inventory Up
In March of this year there was essentially no inventory of homes for sale in the South Bay. Sellers were reporting literally dozens of competing offers on the few homes available. Today, in August, there is easily two months of inventory and homes are sitting on the market for increasingly long periods of time.
Sales in July fell in all four sectors. The Harbor area has now shown declining sales in four consecutive months. PV Hill sales have been off three of the last four months.
The Average Days On Market (ADOM) for the homes sold in July was 17, meaning it took 17 days from the time it was listed on the MLS until an offer was accepted. The ADOM for the homes currently active on the MLS is 46 days, a full month longer than those closing escrow in July.
A lesser known indicator of market condition is the number of homes that don’t sell before leaving the MLS. In July alone, 194 homes fell off the MLS. Of those, 41 Expired never having received an acceptable offer. The remaining 153 were removed because buyers were not showing interest at the listed price. Some of those sellers truly need to sell and will come back at an improved price. Most of them were hoping for a financial windfall and have set aside their plans.
Median Price Falling for South Bay Homes
The median price fell in July for all areas. The hardest hit was the Harbor area with a -6% drop in the median. The Hill was next, with a -5% loss, followed by the Beach and the Inland areas with -4% and -3% respectively.
Of the 116 homes sold at the Beach, 22 (19%) required a price reduction before getting an offer. The Harbor required 59 out of 329 (18%), the PV Hill 9 of 53 (17%), and the Inland area 17 of 153 (11%). Those were price reductions necessary to get an offer on the property, followed by a successful sale. Let’s look at properties active on the market, still trying to get an offer.
As this is written, the Inland area, shows 211 properties available with 77 having taken one or more price reductions already, without receiving an offer. That represents 35% of the currently available Inland homes. Homes at the Beach show 96 reduced of 228 (42%), on the Hill 53 reduced of 140 (38%), Harbor 215 reduced of 547 (39%).
So we see that nearly 20% of the homes sold in July needed a price reduction to get an offer. We also see that roughly 40% of the homes currently on the market have had one price reduction and may need further changes to stimulate offers.
Total Sales Revenue
The decrease in the number of homes sold in July, combined with the decline in median price for those homes pretty much guaranteed that the total sales value would drop as well. Across the South Bay revenue fell from last month by -16%. This will not make our tax assessor happy. Interestingly enough, Los Angeles County Tax Assessor Jeff Prang recently announced with pride a $122 billion growth in County property tax assessments as of January 1, 2022.
The Beach area fared the best, dropping only -2% in value. We noted quite a number of homes being sold as furnished rentals in July, like this one in Hermosa Beach. The Beach Cities are noted for their short stay vacation rentals (often referred to generically as AirBnBs) whether approved by the various cities, or not. Unfortunately there is no official accounting system for these properties. Even if one existed, many of the operators would be very resistant to a governmental accounting which could cause them taxation issues.
For the moment, Beach values seem to be the strongest of the South Bay. The Inland area followed with a -9% decline in total sales dollars. The Harbor area was next, off by -17%.
On the surface homes on the Palos Verdes Peninsula took the worst beating with a -41% decline in value from June sales. We remind our readers that the PV Hill is small by comparison to the other areas. As such, statistical measurements often appear distorted because many of the homes are unique and generate significant sales prices. Having said that, this month was a relatively mundane one for PV. Of the 53 sales, the low was an attached two bedroom, two bath condo which sold at $557K. The high sale was a six bedroom, 8 bathroom house in Rolling Hills which sold at $8 million. (For your valuation purposes, click here to see photographs and descriptions of the two homes.)
Lots of Red Ink
The table below shows the percentage of change in the number of homes sold and the median price of those homes two ways. The yellow shows change for the current month versus the prior month. The green shows change for the current month versus the same month last year.
From a seller’s perspective, these numbers would ideally all be black/positive. When any of them become red it shows a retrenchment in the South Bay real estate market.
From a buyer’s perspective the red ink is a good sign. It means purchasers can get more home for their money. For them, the real savings will come when that last column turns red.
We’ve said for years that land on the Palos Verdes peninsula is undervalued. We may not be able to say that much longer. Last month property on the Hill took another big jump upward in median price. That’s the second time in six months. When that yellow line peaked in February we found several new construction homes closed escrow in the same month boosting the median price dramatically.
PV Median Up $364K while Beach falls by $80K
This time we found two homes, selling in the same month, at over $10,000,000. To put that in perspective, during the past 12 months only four properties on the Hill have reached the $10M mark. So what are these rarefied houses that bring in over-the-top median prices? Let’s take a closer look. (Photos at link.)
The listing agent described 2005 Paseo del Mar as a single level with 5 bedrooms, 4 1/2 baths, formal living and dining rooms, 2 family rooms, pool, 4 car garage with gated entry and circular driveway. So what makes it worth $12.4M instead of $2M?
It seems 4582 square feet of house sitting on over an acre of land on the bluffs above the Pacific Ocean is worth about $10M more than if it had an inland address.
Similarly, 1417 Lower Paseo la Cresta is a grand estate offering over 15,000 square feet of lavish living space spread over 3 levels, with 9 bedrooms,13 bathrooms and two full kitchens. Additional highlights include the custom 15-seat theater, Italian Fantini mosaic pool, elevator, generator and an extensive home automation system.
Beach Cities Sales Down -34% From 2021
The Inland cities clearly leap-frogged the other three areas in volume of sales for June. Sales in the Inland area out-paced the rest of South Bay, erasing a -17% decline from May of this year and adding a +13% increase for June .
The next closest monthly sales volume was a +2% at the Beach. Harbor area sales showed the poorest comparable performance, dropping by -4% for the month, continuing a three month slide. Monthly sales volume in the Harbor area has declined 135 units just since March.
Let’s focus on the Harbor and that red line on the chart for just a moment. Remember this is an entry level market, where a little rise in the mortgage interest rate can quickly price a new buyer out of the running. Notice that sales in the Harbor area were at about 300 homes per month in January. By February a few buyers had noticed the interest rates climbing and took the leap.
Then March became the proverbial “last chance” to buy in the fast moving current market. Sales volume shot through the ceiling with a 61% increase in homes sold. Since then we have watched a classic collapse with prospective buyers melting into the woodwork, waiting for another opportunity.
Annual statistics are still reflecting the impact of two plus years of pandemic. Compared to June of last year, sales were down dramatically. The Inland area fared the best, coming in with a drop 0f -6% from 2021. Sales in the Beach cities and the Harbor area fell the farthest with a -34% and a -29% respectively.
Total Dollars Sold Up 71% In Just Two Years
Back in 2020, the first six months of the year had netted slightly over $3.1B in South Bay home sales. Fast forward to the first six months of 2022 and total sales is slightly over $5.3B. Restated, that’s a 71% increase in dollars spent on real estate in just two years.
Much of that increase was the result of the phenomenally low interest rates created by the Federal Reserve Bank (Fed) to offset the financial impact of the pandemic. It was good for all those people who wanted homes and had down payment money. Investors did especially well, though we saw another big expansion of the inequality gap.
Coming out of the pandemic, we’re seeing the four areas moving erratically. The steep climbs of 2020 and 2021 seem to be leveling off, as the Fed tries desperately to slow what is viewed as a runaway real estate market.
Total sales dollars in 2019 were $7.9B, in 2020 up to $8.7B, and in 2021 up again to $12.1B. Since mortgage rates are still climbing, it’s a little early for forecasting, but we anticipate 2022 total sales to come in at about $11.3B.
Where Are We Going?
Comparing last year’s market to 2022 shows a continuing decline in sales, while simultaneously a continuing increase in median prices. That may still change before the end of the year.
In May we saw the quantity sold drop into the red numbers across the South Bay. For June the sales volume is only off in the Harbor area, but the Hill and the Beach are both marginal. We expect sales to gradually slow as the year closes. Indications are the Fed will ratchet up the mortgage interest rate another 2% which should bring transaction volume down substantially.
May also saw the median price drop at the Harbor. Then in June the median fell for the Beach cities and the Inland areas, while the Harbor bounced back. We expect both the median and the sales volume to fall back into the red zone by the end of the year.
Sales volume should move first. Then as sales slow and buyers become more selective, sellers will begin retrenching on price. We don’t anticipate major price reductions until 2023. However, there are a lot of moving parts to this years economy. Events on the other side of the world may still make big changes here.
In a normal year one would expect April to be the turning point for the LA real estate market. March is still cold and the children are still in school for another 10 weeks. April’s the month when the weather turns warm, the flower buds poke up, and the buyers come out to start the spring buying season. It hasn’t happened that way this year.
Prices had gone through the ceiling by the end of 2021, much of the activity stimulated by fear of escalating mortgage interest rates. Usher in 2022–January and February were typically slow and in March home sales bounced up like an indicator of business as usual. But, interest rates continued to climb and April ended with the total number of home sales down instead of up. Likewise, total sales dollars were down across the South Bay.
Number of Homes Sold
Judging from the charts, entry level homes in the Harbor area were clearly the center of activity for South Bay real estate. As interest rates pushed against the 5% mark, panic set in among first time buyers who had been outbid multiple times. Prices went up as high as buyers could afford, a number that shrinks amazingly fast with each tenth of a percent increase in the interest rate.
Across the South Bay, the number of homes sold in April dropped by -4% from March, which had been an increase of 59% over the prior month. As we see from the chart below, sales were uneven between the various areas.
On the entry level front, at the same time Harbor area home sales were dropping off, Inland homes gained sales. On the high end, sales on the Palos Verdes peninsula were also facing declining numbers, while Beach area sales increased.
So far declining sales counts have been modest, but a decline overall, coupled with a decline in half of the individual areas covered indicates that buyers are pulling back. Part of the resistance is a matter of simply being priced out of the market. Another important piece is the anticipation of price corrections in the near future. We have heard multiple buyers say they are watching and waiting for lower prices later this year.
At this point we’re well into the second quarter of the year and it looks as though those folks may be on track for some savings. even some of our most gung-ho pundits are beginning to see a market downturn on the horizon.
Median Price Sold
Interestingly, Harbor area prices went up at the same time the number of sales went down.The March to April price increase was a modest +6% compared to a +21% increase over April of last year. Similarly, the Beach cities had a month over month increase of +4%, while showing +19% year over year. While sales prices are still rising in those areas, the increase is a fraction of what it was last year.
Sold prices on the Hill continued to slide downwards. Because the February increase in the median price was created by the sale of new construction, and that building phase is now sold out, a downward turn in median price is expected. We anticipate that leveling off soon.
In the Inland area the median price for homes sold during April of 2022, was +12% greater than sales in April of 2021. By comparison, the median price of those sold in March of 2022 versus April of 2022 decreased by -1%. It’s a modest decrease that points to the direction of the South Bay real estate market for the balance of the year.
Area Sales Dollars
The total dollar value of home sales in the South Bay usually tracks right along with the number of units sold. The few times it differs are important times like these when the number of homes sold is dropping, and/or the sales prices are dropping. Today, of the four areas we track, PV Hill has a declining number of sales, both in comparison to last year and in comparison to last month. As we noted above, the area also is declining in total dollars compared to last year and last month.
As we discussed in last month’s issue, some of the reason for the drop is found in new construction homes that sold at a much higher price than the typical Palos Verdes resale home. The rest of it can be found in longer days on market waiting for a buyer, and in price reductions.
At the opposite end of the spectrum, the Beach cities showed gains last month for both number of units sold and for the total sales value of those homes. The only decline this month for the Beach was in number sold compared to April of last year. Sales this April were off by -21%.
The Harbor area still trended upward in dollar value, both month over month and year over year. But, the number of units sold was down for both time measurements. The price competition was very stiff in what is generally an entry level market. During the past couple years, bidding wars and over-asking sales prices have kept the dollars high. The April numbers show that changing rapidly.
Total dollar sales for the Inland community increased 15% month over month. That was the highest growth of all four areas. Scanning those individual transactions showed an odd pattern. Sales in the price range from about $325K up to about $750K were a familiar mix of some under asking price, some at asking and some above asking. The degree of variance was about what one would expect. Unexpectedly, for sales over $750K, nearly every property sold above asking price, and in many cases well above asking.
We found no clear explanation for why this phenomena occurred. There is a suspicion that buyers who were priced out of Beach properties may have shifted their bidding wars into the increasingly popular parts of west Torrance. This theory is supported by the distribution of sales among the various neighborhoods.
In Summary
In the table below are the core statistics comparing April to March of this year, and comparing April of this year to April of 2021. The prevalence of negative numbers is convincing evidence that high prices and high interest rates are pushing the South Bay real estate market into a recession.
Notable Properties
One of the more interesting properties sold in April is a four bedroom, five bathroom home located in west Torrance. The home was purchased by the seller as their family home in 1990 for just above $360K. The children grew up and the parents remodeled in 2022 and sold the house.
As would be expected in a good neighborhood with a contemporary remodel, the home sold for over the asking price of $2.7M. The final selling price was slightly over $3M. and just happened to be almost exactly $360K over the asking price.
In the 32 years that family owned the home it appreciated at an average rate in excess of $84K per year. It’s the classic “American Dream.”