
The Federal Reserve Bank tries to keep annual inflation at around 2%. Over the past 12 months the median price increase of a home in the South Bay ranged from 7% (Inland area) to 32% (PV Hill). Clearly housing in the LA area is exceeding the desired inflation rate.
The recent Fed report to Congress stated, “Mortgage rates for households remain low despite recent increases.” In other words, the Fed considers 5% mortgage rates to be “low.” As part of the battle to control runaway inflation, the Fed is expected to implement rate increases. Estimates for how much higher we can expect mortgage rates to rise in the coming year range from approximately 1% to 2% more.
Rates currently at about 5%, we can already see an impact on sales volume and prices in our local monthly data. Real estate industry pundits are projecting an imminent recession. Some say “mild, in 2023.” Some are comparing the current market environment to the 2007 lead-up to the Great Recession. Keeping a probable recession in mind, let’s look at the March sales data.
Sales Volume
March is the month when South Bay denizens shake off the winter doldrums and get serious about real estate. The chart last year looked very similar to this. This year the Hill and the Beach were up slightly from last year. The Inland and Harbor areas increased at the same rate as in 2021. Compared to last year’s market, 2022 is distinctly more normal.
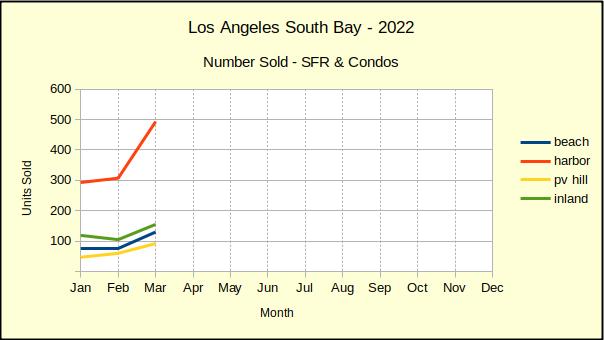
The chart makes it look like the Harbor area took an especially large leap in March. That’s just because the Harbor area is so much larger and so many more homes are sold there than the other three areas.. On a percentile basis, sales of Beach homes actually increased at a steeper rate. Sales at the Beach were up from the prior month by 71%, while Harbor area sales increased by 61%.
Normally, we would expect the sales volume to level off now and remain roughly a even line until winter when sales taper off again. If, in the battle to contain inflation, mortgage interest rates climb as fast as the Fed has indicated, we can expect to see the number of homes selling decline. We expect buyers who must buy will adjust the size of the purchase to meet their financing capability. Buyers who aren’t compelled to buy will probably delay and wait for better circumstances.
Median Price
Today, the best measure of home prices is comparing to last month. The market in 2021 was recovering, so some statistics are comparable, while others are still showing signs of impact from the pandemic.
March gave us a month-to-month downturn of -4% on the Hill. Of course, if you remember from last month, February saw escrow close on several new construction homes. Those units pushed the median price exceptionally high, so what we’re seeing now is a return to normal.
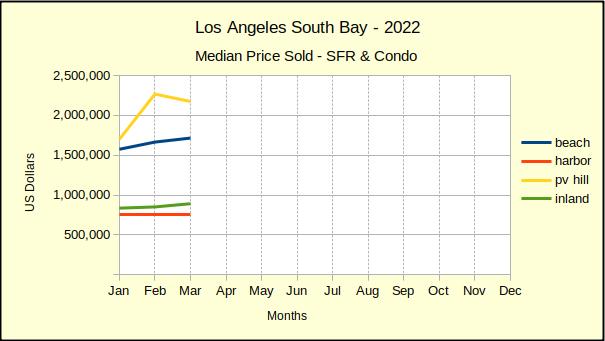
While median prices on the Hill were dipping, the Harbor area was flat. Prices there were +4% in January, slowed to +1% in February and had no change in March. This is the largest market area in the South Bay and is often a precursor for change.
The Beach and the Inland areas show continuing price increases of 3% and 5% respectively. Looking back to the first of the year, the Beach has been varied. The March price shift at the Beach is down from the February increase of 6%, but is up from the January decrease of -12%. The Inland numbers show steady growth from -2% in January to +5% in March.
Monthly Sales Dollars
The dollar value of March sales in the South Bay showed positive increases for all areas for the first time this year. This is important because normal growth in our capitalist system will almost always show the sold value from the current year to be larger than that of the preceeding year. The negative numbers from January and February are reflections of the troubled economics of 2021.
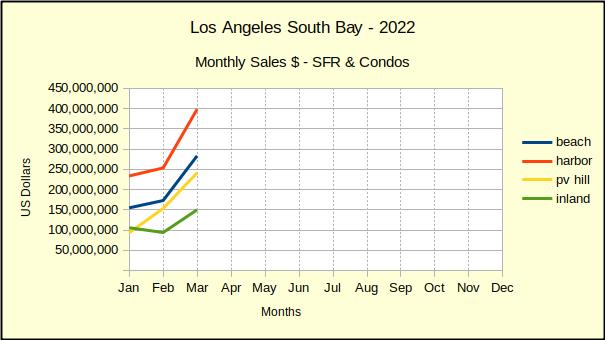
We expect the sales dollars to level out as the median price pulls back to a normal growth pattern. If the Fed is to realize any kind of reasonable slowdown for inflation, the monthly median prices have to stabilize at a rate of increase barely above zero. As of March the cumulative median for each area ranges from +3% to +20%. We’re not going to get to +2% inflation with those results.
The Statistics
Supposedly, charts are easier to read for most people. I like to include this table because it packs all the data from the three charts above, plus background detail, into a fraction of the space. Here we see the specific quanties sold in each area, plus the median price of the area, for the month of March.
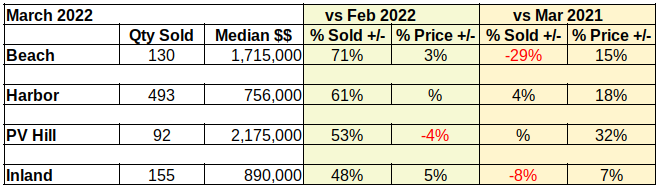
More importantly, the table shows at a glance how March 2022 compared to February of this year, and March of last year. All four areas currently have increasing sales, in part because the inventory is growing. In addition, there’s a bit of panic from the rapid interest rate increase.
At the same time, the table quickly shows that the median price has moderated in all four areas from what was happening in 2021.
Notable Sales
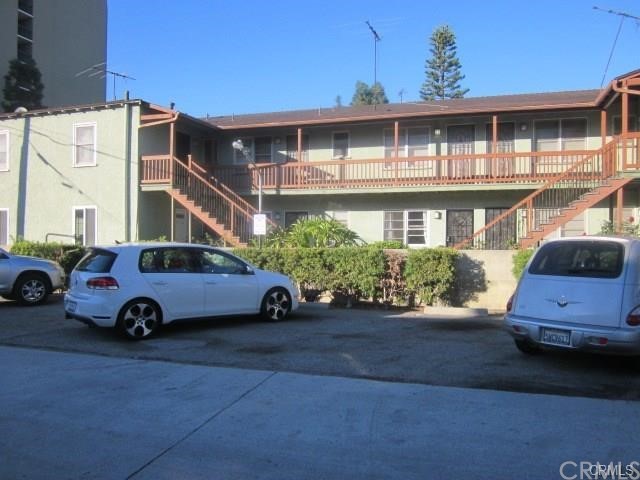
The South Bay in Los Angeles is a highly diverse area. In the distance of a few minutes it’s possible to drive from the lowest priced property sold in March to the highest priced property sold in March.
This studio condo in Long Beach sold for $249,900. It offers 441 sqft of airspace, no assigned parking, has an HOA fee of $149, and was originally built in 1913.
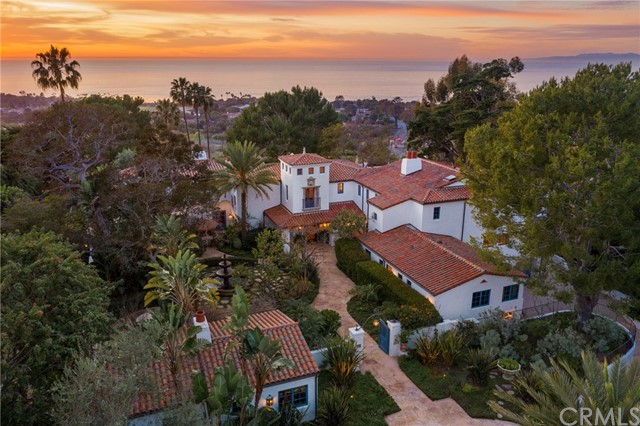
This 7 bedroom, 15 bathroom house in Palos Verdes Estates sold for $17,150,000. It offers 13,000 sqft on a 3 acre lot, has 5 garage spaces and was built in 2006.
Main photograph by Randy Jose on Unsplash