
As we discussed in this column last month, comparative analysis of real estate between “the year of Covid” and any other year will be relatively meaningless. Starting in August we may have something approaching useful data in the year-over-year category. Until then, the best guidance will come from the month-to-month numbers and paying close attention to buyers and sellers.
The Beach cities is a great example. A 2020-to-2021 comparison of March sales shows an increase of 136%. Compare that to the March-to-April decrease of 2% and we immediately see the dramatic difference. The table below shows how huge the difference is. The year-0ver-year statistics are all skewed way to the high side because there were significantly fewer sales in 2020 than in a normal year.
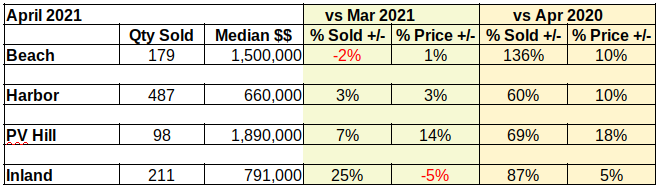
Moving on to the monthly statistics, let’s look at how the year is shaping up. There was a minor decrease of-2% in the quantity sold at the Beach last month. The rest of the South Bay showed increased sales, with the inland cities showing a big bump up, in addition to a lower median sales price.
Entry level buyers who can now afford to become home owners, due to pandemic stimulus interest rates, make up a big part of those added sales. Another sizable component is made up of investors who can make cash offers, then leverage their investment to do it again.
Slowdown in Volume of Sales
The chart below shows steep growth in the number of homes sold in all areas for March. Sales in the Harbor cities were especially strong. It looked like the bright light at the end of the Covid tunnel. But, in April we see sales level off everywhere except the inland cities. The pent up demand we spoke of last month seems to be easing already.
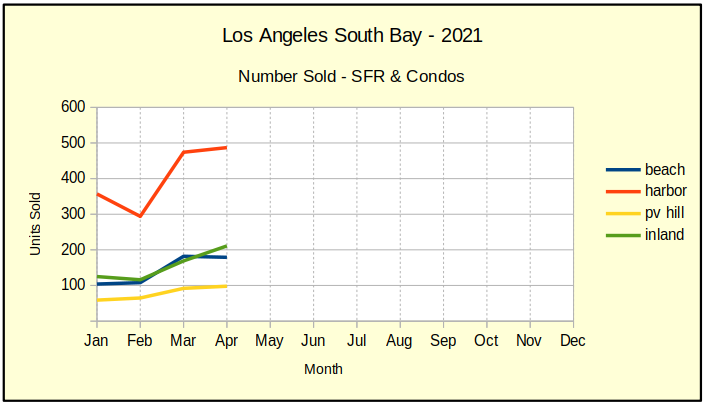
When the volume of sales drops off, there is typically a decline in the price point, too. So far prices have been on the ascendant. The low interest rates kept buyers in the market, and the shortage of homes drove the prices up.
Home buyers are typically most active in the months surrounding school vacation for students. No parent wants to change schools during a regular session. We’re in the month of May, and the sales stats coming out next month will give us a better picture of how much recovery we will see this summer.
Prices Level Out Across South Bay
Like the number of sales, the median prices have flattened and in some cases turned down this month. Palos Verdes homes seem to have taken a strong upward trend with a 14% jump in price. However, looking a little deeper we find there were two exceptionally large sales which combined to create an illusion in the charts. That yellow line should drop back down around $1.6M next month.
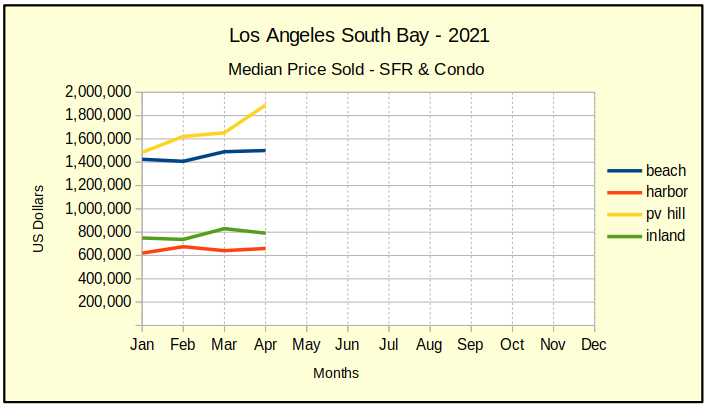
Considering the rate at which prices have been increasing over the 2020 prices, leveling off is a necessary thing. In each of the first four months of this year, home prices have escalated as much as they would in a normal year. Continuing at this rate threatens us with another “bubble” coming on the tail of Covid-19.
Total Sales Dollars Still Climbing
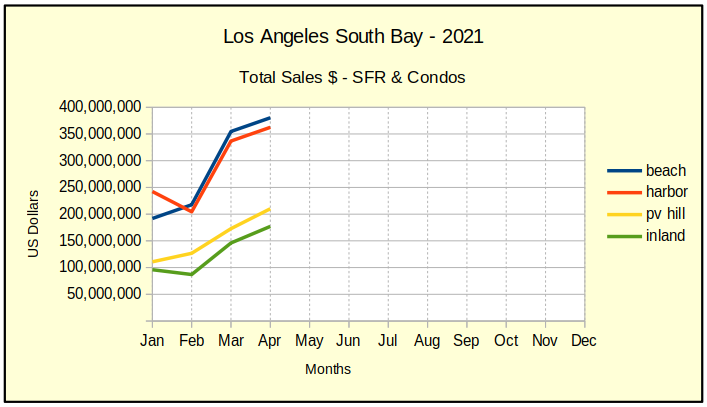
Elevated prices combined with increased sales last month to push total monthly sales dollars way up. The chart looks like everything is hunky-dory. If only we didn’t know this is growing out of the disaster we lived through in 2020.
Actually, we’ll be quite lucky if some excessive price increases are the only fallout from the pandemic. We’ve written a number of articles recently on the probability for a rash of foreclosures coming after June 30, when the prohibition of eviction and foreclosure come to an end. Stay tuned and we’ll keep you abreast of the situation as it develops.