
2020 versus 2021
2021 was a year of tears for many people. But, not so for most South Bay property owners. Briefly, median sales prices across the area increased between 9% (the Inland areas) and 24% (on the Hill). Those are incredibly large increases. To put it in perspective, the median price increase the previous year, 2020, was less than half that, ranging from 4% (at the beach) to 9% (Hill and Inland).
Similarly, the year over prior year sales volume for 2021 was up in a range from 18% (harbor area) to 22% (beach and hill). This compared to a range from decline of 6% (inland area) to an increase of 7% (hill) for 2020.
Along with median sales value increasing and number of units sold increasing, we also saw astronomical increases in total sales dollars for the year. The change from 2020 to 2021 ranged from 33% (harbor) to 52% (hill). That compared to a range from 2% (inland) to 20% (hill) for the transition from 2019 to 2020.
These huge percentages are uncomfortably like the years 2006 and 2007 leading up to the Great Recession. It’s highly unlikely that 2022 will continue at this pace. We anticipate the year starting out with listings priced on the high end, with subsequent price reductions as “distressed” properties come on the market with more appealing prices.
So called “distressed” properties include those which have been hidden from the market by the Covid-inspired moratorium on foreclosures and evictions. Now that lenders are allowed to process foreclosures, we are beginning to see properties come on the market as “pre-foreclosure.” Here in the South Bay we have yet to see any significant number of bank-owned property come on the market, though at least ten distressed homes have been listed in the past three months in Los Angeles county.
In the end, most real estate sales involve a family home where buying or selling is dictated by events beyond the property owner’s control rather than by market trends. Births, deaths and new employment top the list of reasons for transactions that will happen regardless of market conditions. If you anticipate a need to sell in the next few months, we recommend you consult with your broker/agent early. Ask about marketing or negotiating techniques that will deliver the best result in a slowing market given your circumstances.
Year-End Housing Sales Drop
Regular readers will recognize that we’ve been seeing the sales volume declining for a couple months now. On the one hand, it’s understandable because we report actual sales results, as opposed to seasonally adjusted results. Being the winter season, sales are slower.
On the other hand, nearly everyone has been ignoring the white elephant in the marketplace. Let’s face it, prices have gone up dramatically, the interest rate is climbing at a quickening pace, and inflation is on the rise. Combined, those factors foretell fewer qualified buyers, more inventory on the market and some pullback on the recent price increases. We’ll talk more about that next month when we take a first look at real estate in 2022. If you’re about to make a move and need information sooner, give us a call.
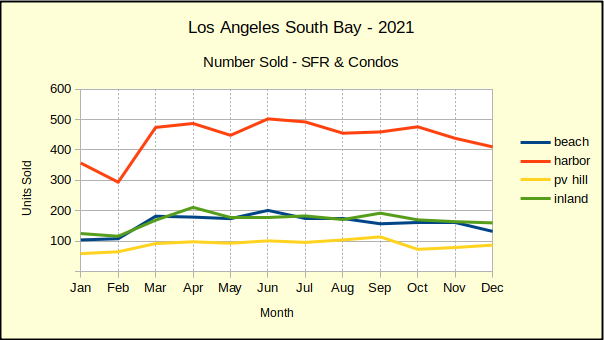
Sales quantity fell off from the November numbers everywhere except in the Palos Verdes area. There we found a healthy 10% increase in activity for December. (With a hundred or fewer units sold in any given month, statistics related to sales volume on the Hill can have some wild variations.) Sales rose by 10% from last month, but fell 11% from last year.
Harbor area sales slowed the most in the South Bay. Of course, sales there and in the Inland cities had increased dramatically early in the year. The confluence of low interest rates threatening to go up, with burgeoning demand from first time buyers, drove sales numbers all year. As the mortgage interest rate passed three percent, many of those first timers fell out of the market.
Year-End Median Prices Mixed
Palos Verdes homes brought in 24% more in median prices last year than the year before, which was 9% above 2019. Most of the 2021 increase came in the first three months of the year. Prices were stable for the summer before dropping in the fall. At the same time, Beach homes went up 19% in 2021, compared to a 4% increase in 2020 over 2019. Much the same in the Harbor area, median prices doubled, up 15% over 2020, compared to 7% above 2019.
In an interesting anomaly, prices in the Inland increased 9% over last year, which was 9% above 2019. It seems the purchasing mania and bidding wars didn’t have as much impact to Inland areas.
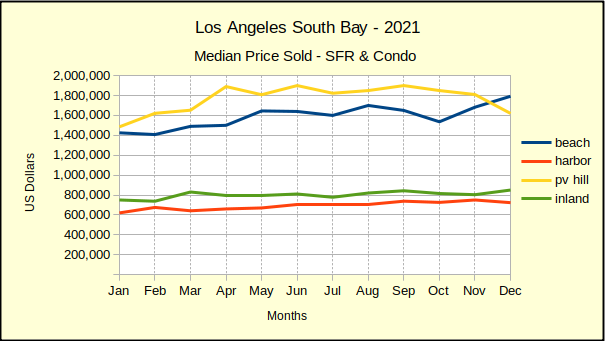
By mid-year all areas had seen one or two months of declining median prices on a month-to-month basis. As the year wore on, the “down” months grew and the “up” months shrank. Despite the year-over-year median price being up, three out of the final six months of the year saw declining median prices in all areas.
On a month over month basis, selling prices on the Hill were the most impacted in December, dropping 10% from November. Harbor area homes fell by 4%, while Inland property values were up 6% and homes at the Beach grew 7%.
The Beach areas enjoyed significant appreciation in 2021. Prices at the Beach started the year at just over $1.4M, moved quickly up to $1.7M in August, then lost $150K of those gains before springing up to close the year out at a median price of nearly $1.8M.
Year-End Total Sales Dollars
The total dollar value of all the homes sold in the South Bay in a given month or year is probably only useful to investors or economists. At the same time it can be instructive by way of demostrating market direction. For example, let’s look to total sales on a monthly basis.
In total dollars South Bay homes sales for 2021 were up 38% from 2020 sales. That compares to a 10% increase from 2019 to 2020. Looking at individual months, the bulk of that revenue increase happened between January and July. By August the 2020 to 2021 increases had slowed to single digits. By December, the Beach and Inland areas were already seeing monthly declines compared to 2020.
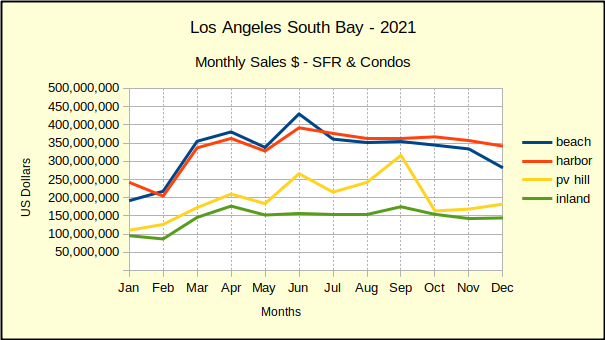
The December year-to-year decline in total sales dollars was only 5% at the Beach but compare that to an increase of 156% in April. The Inland areas dropped 3% for the same period, compared to a 159% increase in sales for May. Harbor area sales were up 8% compared to 106% in May. Palos Verdes December sales were up 2% compared to 228% in May.
What does all this mean? For most of 2021 we cautioned readers that year to year comparisons were problematic because in 2020 no one was truly prepared for Covid. Business exploded in the first three quarters of 2020. It took until August and September of 2021 to get past the previous year’s damage, so camparisons were even explicable. Until then nothing is there to compare to. Businesses were locked down. Consumers and retailers alike were hunkered down at home. That’s why 2021 annual percentages are so large–they’re an anomaly! Only the last few months of 2021 are valid comparisons to historically relevant statistics.
In Summary
From our perspective it looks like we’re headed into a correction. One might even look at it as a correction from a correction. It’s as though the real estate market over-corrected from the Covid collapse and boomed for about three quarters. Now we’re coming back down to some pretty solid numbers.
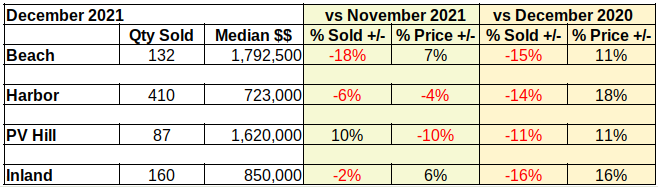
We expect January 2022 to look a lot like this table, with some moderation of the numbers. That moderation should continue into the year as sellers and buyers move closer together on their initial expectations. By the end of summer we predict the market will show the first indications of pulling together for another roughly 10 year cycle.
We like to think of the proverbial real estate cycle as three steps forward–one step back. It’s important to note that this is the “back step” of the cycle. As such, it’s probably the lowest price a purchaser can expect to see for that product in the next decade, if ever again. At the same time, it’s probably the last opportunity for a seller to trade up without having to make significant upgrades to the product, or taking a big hit for deferred maintenance. By 2023 we should be working on building long term market value.
Thank you for reading. Our lead photo is courtesy of Michael Fallon. See https://unsplash.com/@fallonmichaeltx . As always, we’re here if you have a question or want to bounce an idea off us.