The share of teachers able to afford homes near where they teach is dwindling rapidly. This year, teachers can afford only 12% of homes within 20 miles of their schools. This is a decrease from 17% last year. In 2019, before the pandemic, they could afford 30% of homes in their school’s area. Fortunately, there are options to help teachers.
The Department of Housing and Urban Development (HUD) is sponsoring a program called Good Neighbor Next Door, which sells homes in revitalized areas to certain government workers at half the listing price. This program is available to pre-K through 12 teachers as well as law enforcement officers and firefighters. Some of Fannie Mae’s programs, while not specifically aimed at teachers, have qualifications that teachers frequently are able to meet.
In addition to federal programs, there are also state and private programs to help teachers. California created the School Teacher and Employee program back in 2018. This specific program is discontinued, but is now folded into their MyHome program, opening it up to more people. The private program Homes for Heroes provides a 0.7% rebate on home purchases made through the organization’s specialists. It is available to firefighters, EMS, law enforcement, military, healthcare professionals, and teachers.
Home values have been increasing across the board in the US, and the percentage of homes valued at over $1 million seemed poised to hit a record in June of 2023, when the share reached 8.2%. That record wasn’t quite hit, as it actually belongs to the value of 8.6% in June of 2022.
The total value of the US housing market did hit an all-time record in June of 2023. The total was $46.8 trillion. For comparison, in June of 2022 — when the largest percentage were over $1 million — the total value was $46.6 trillion. This isn’t much lower, but it does show that either the top end is increasing in value, bringing the total value up, or there are more homes on the low end, bringing the share over $1 million down. Both of these are possibilities, since inventory is still low despite an increase in affordable living construction.
For quite a while, most buyers have been Millennials. This is predominately related to their age. The age range for the Millennial generation varies depending who you ask, but the National Association of Realtors (NAR) uses 24 to 42. This is considered to be the prime age range for first-time homebuyers as well as those moving from their starter home to their first permanent home. Because of this, Millennials have been the largest contingent of homebuyers. That’s no longer the case.
So who’s replacing them? One might expect it to be the generation just below them — it would make sense that as time goes on the younger generations fill the shoes of those before them. But the typical homebuyer has been around age 36, which is in the Millennial range, and much of Generation Z is still too young to own a home. It’s actually Baby Boomers making a comeback. The reason for this is economic, rather than generational. The current market is not well suited to homebuying. Those who are able to buy are generally those who can afford high-end homes. And one of the best ways to afford high-end homes is by having many more years of saving and building equity. Many Baby Boomers will have paid off their mortgage by now, and their homes would also be worth significantly more than they were when they were purchased. Half of Baby Boomers purchasing now are paying cash, something that Millennials without any equity are priced out of attempting.
Last week, the Federal Reserve, commonly known as the Fed, increased the federal funds rate by 0.25 points. The federal funds rate now sits at 5.25%-5.5%, the largest value in 22 years. In addition, the Fed made a statement regarding “determining the extent of additional policy firming that will be appropriate.” Policy firming refers to rate increases.
Barclays, a multinational bank based out of the UK, also noted a change in the Fed’s language regarding this policy. A prior statement by the Fed referenced “the extent to which additional policy firming may be appropriate.” Their new statement is significantly more certain about the appropriateness of additional policy firming, leading Barclays to believe that the Fed plans additional rate increases. Barclays predicts this will probably happen in September or November, which are the next two times the Fed meets.
However, it’s important to realize that the federal funds rate is not the same as mortgage interest rates. In fact, they aren’t directly related at all. Mortgage interest rates do frequently increase when the federal funds rate increases, but there are additional factors at play. These include demand and economic outlook. Both of these are somewhat mixed. Demand is not particularly high, but neither is supply. Our economy is currently in a recovery cycle, so it’s looking up, but isn’t necessarily stable. So, it’s definitely a possibility that interest rates increase some more, but not a guarantee.
The skyrocketing home prices affected homes across the spectrum of affordability. The luxury home market didn’t take as much of a hit in terms of sales, since wealthy buyers can generally afford to buy even with prices being high. But that doesn’t mean their prices didn’t increase. Nationwide, the median sale price of luxury class homes rose to $1.2 million this year, which is a 4.6% increase from last year. This is actually over three times the percentage increase for non-luxury homes, which increased 1.5% to $340,000. Both of these are record median prices. However, prices aren’t increasing everywhere.
Four major cities across the West Coast experienced double-digit percentage drops in median luxury home value from last year to now. The largest decrease was in San Francisco, where it dropped 12.7% to $4.8 million. The other three were Seattle, Oakland, and San Jose. Seattle’s luxury prices dropped 12.3% to $2.5 million. In Oakland, they decreased 11.1% to $2.8 million. San Jose’s decreased 10.3% to $4.3 million. Besides very high prices despite rapidly declining prices, these four cities also share something else in common. All four of them are major West Coast hubs for the tech industry. The tech industry has recently been hit by layoffs and stock market declines, so this is perhaps not unexpected.
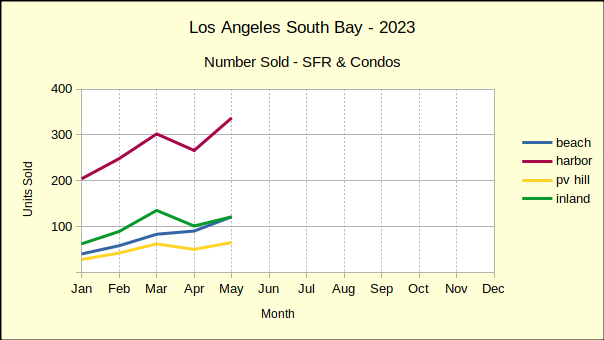
The number of homes sold in the Los Angeles South Bay during the first six months of 2023 is the lowest sales volume for a first half in the past five years. Fewer homes have been sold since the new year than sold during the same period of the worst year of the pandemic.
The first half of 2023 has ended with 24% fewer sales than the same period in 2022, which was itself down 15% from 2021. The peak of the market was early 2021, when interest rates were among the lowest in history, exploding the number of potential buyers. The lowest sales volume was during 2020 when 3311 homes were sold, which was still greater than the 3221 sold the beginning of this year.
Median Price Begins Downturn
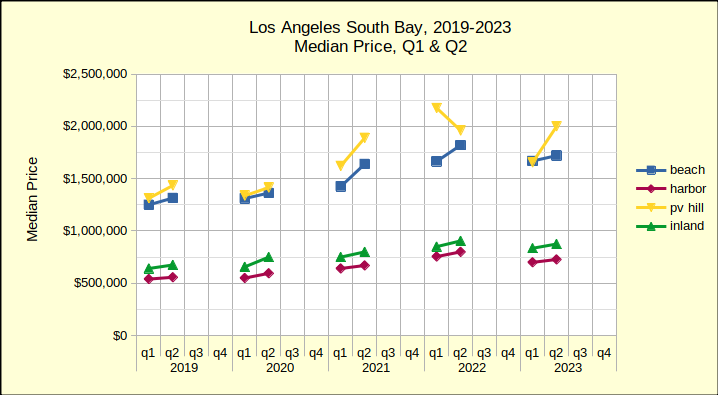
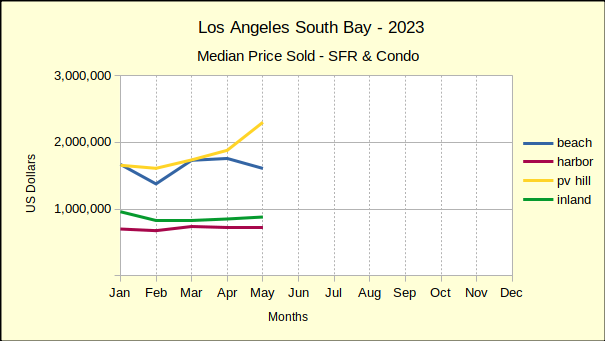
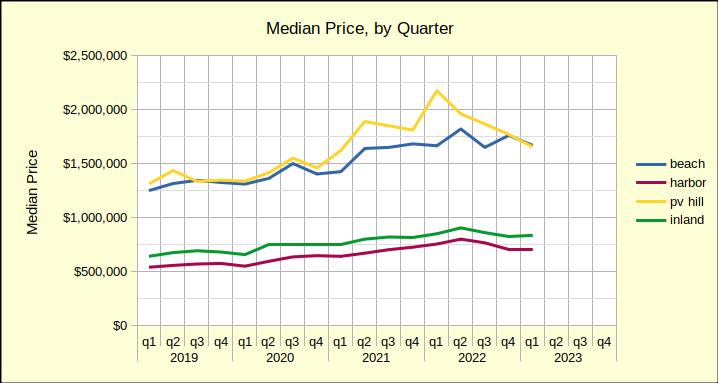
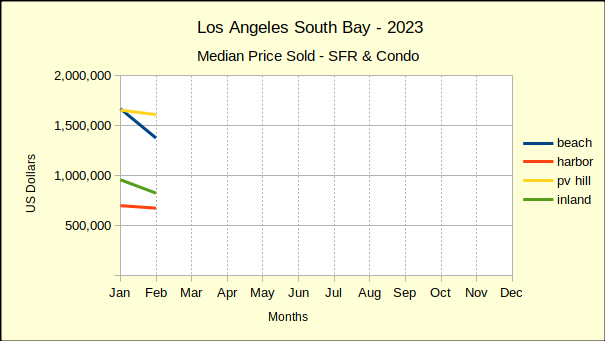
Coming right on the heels of the sales volume collapse is a drop in the median price. Prices today are down from where they were in 2022, which was the peak of the recent market. The chart below reflects the median price for the first and second quarters of the past five years. Typically, the first quarter is the slowest, with the number of sales increasing through the second quarter and then slowing again for the third and fourth quarters. Here the growth from Q1 to Q2 shows and we can see the change from year to year.
As always, bear in mind that the Palos Verdes Hill offers a comparatively small sample size, so a couple of significant sales can shift the plot lines dramatically on a chart. The chart above shows one such anomaly where PV the median price actually declines in the second quarter.
Looking across the years from 2019 all four areas show the same upward movement in median price until the second quarter of 2022. Then, comparing it to the second quarter of 2023, we can see the trend shifting downward. For example, the Beach Cities median fell from $1.82M in the second quarter of 2022 to $1.72M in the second quarter of 2023. The weakness in median prices is driven by increasingly steeper mortgage interest rates. Barring a change in market dynamics, anticipate this line turning into a steeper downslope for residential prices starting in winter of 2023/24.
When Is the Bottom?
The market is clearly taking a downward turn. Sales volume is off, median prices are turning down. Sellers are not putting properties on the market. Buyers aren’t buying. The few forecasters willing to make a guess this early are saying real estate won’t come back until 2025, possibly 2026. For those who are “waiting for the bottom of the market,” remember that by the time you read it in the headlines—you’re too late—the bottom is gone.
Beach Cities Sales Dropping Fast
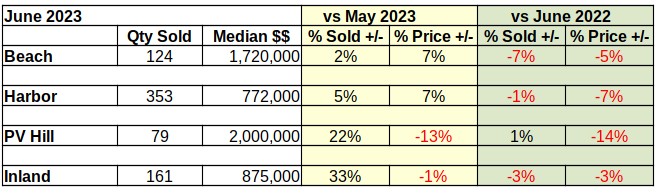
Median prices at the Beach have fallen 5% from last June, coming in this year at $1.72M, an even $100,000 below June of 2022. Year to year sales for June are down 7% from last year, at 124 units compared to 133 in June of 2022.
Month over month statistics have been highly volatile since the beginnning of 2023. Interest rates and prices have changed erratically, making short term forecasts nearly impossible. Month to month sales volume has bounced in a range from 2% to 45%. In just six months, monthly median prices in the Beach Cities have ranged between -18% and 26%.
Year to date sales volume at the Beach is down 25% from last year and is off a full 35% from 2019.
The year to date median is down 3% compared to 2022, though it is still 32% above the median in 2019.
Despite market conditions, homes in the Beach Cities remain highly desirable. For June, 78% of sales transactions closed within 30 days of listing and sold for 2.61 % above asking price. Beach homes also offer a great deal of diversity. June sales showed a 19 million dollar range between the low sale at just over $500K and the high sale at $19.5M.
Harbor Area Home Sales and Prices Down
Year to year-same month sales in the Harbor area have been negative since the first of the year. Prices were still holding up in June of last year, but sales volume had been dropping through all of May and June. As a result, the number of homes sold dropped a mere 1% coming into June of 2023. That looks good until compared with the year to date decline of 24%.
Market conditions in the Harbor last year gradually changed from joy for rock bottom interest rates at the beginning of the year to caution as sales tapered off and sales figures stated taking a hit. Median prices for June of the current year have fallen 7% from the June 2022 median of $830K.
Until now, the Harbor area has shown mixed results in the month over month statistics. For June compared to May sales volume was up by 5% (353 versus 337), while median price was up 7% ($772K versus $720K). Like the Beach Cities, the Harbor Area is following a more normal upward swing from the winter doldrums into the spring selling season.
That upward swing is not expected to go very high or last very long. At 1710 homes sold, year to date sales volume from January through June is down 24% versus 2259 sold in 2022. Sales volume is likewise down 17% from 2071 during the same six months in 2019. The variance in monthly sales is expected to drop into the single digits starting in July.
Median prices are down 4% compared to 2022 though still up 33% versus 2019. (Note: Using The Federal Reserve’s “target inflation rate”of 2% annually would have put the Harbor area median price increase at a little over 8%. That implies an “excess growth” of about 25% in median price during the pandemic buying splurge. Much of that difference, if not all of it, is expected to disappear over the next 18 to 24 months.)
June sales detail shows 77% of sales closing escrow within 30 days. Buyers were still bidding up, with the sales price exceeding the list price by 2.61%. The highest sale recorded in June for the Harbor was $4.25M; while the lowest was $527.5K.
PV Peninsula Volume and Prices Mixed
Palos Verdes, contrasting May versus June of 2023 shows a 22% increase in the number of homes sold for a monthly total of 79. At the same time, the median price dropped by 13%, falling to $2M even. Expectations for month over month statistics include fewer sales and more aggressive price reductions as 2023 wears on. The summer and fall months are projected to have weaker home sales, both in volume and pricing, as interest rates increase and buyers and sellers who “must move” run out of options.
Year over year same month sales, showed a volume growth of 1% (one sale), accompanied by a 14% drop in median price from $2.3M. That 1% increase is the first time in 2023 that any of the areas has shown positive growth in the number of homes sold. As such, and knowing that the PV Hill is considerably smaller that the other areas we measure, readers are cautioned about the wide swings in PV statistics.
Sales volume for the first six months of 2023 is down 26% compared to 2022 (326 homes in 2023 versus 438 in 2022. Similarly, sales are down 9% from 2019 when sales of 358 homes were recorded. Median prices of $1.8M for the same period are down 13% from 2022 prices of $2.1M and up 36% from $1.3M in 2019.
Market time has remained good, with 75% of sales closing withing 30 days. Sellers have enjoyed selling prices 2.3% higher than asking prices, a trend expected to disappear before the end of summer. Once again showing the range of homes available in the South Bay, the high sale in PV was $10M while the low was $610K.
Inland Area Makes Strong Showing
Sales volume of 161 homes in the Inland Area for June was up 33% over sales of 121 in May. With 33% more activity came a 1% reduction in median price, which fell to $875K after reaching $880K in May.
Comparing June of this year to June of last year showed a volume decrease of 3% from 166 in 2022. Likewise, this June showed a median price decrease of 3% from last year’s $905K.
Year to date volume for the first six months was down 68%, for 669 units sold, versus 869 in 2022. Going back to 2019, the most recent “normal business year,” sales volume was down 21% from 799 sold in 2019.
Median price of Inland area homes for the same six month period showed at $863K, down 3% from $887K in 2022; and up 32% from $652K in 2019. Days on market remained under 30 for 82% of the Inland area homes sold in June. Buyers offered 2.6% above asking price. The high market sale was $2.2M while the low was $390K.
For a long time, a new homeowner’s first purchase has likely been a starter home. A starter home means that the homeowner expects to live there a short time, sell once it appreciates, then buy a larger home. People generally live in starter homes between three and seven years. That trend is going away, though, for a few different reasons.
The largest contingent of homebuyers, and also first-time homebuyers, is currently Millennials, who are between 27 and 42 years old right now. This roughly corresponds to the 25 to 44 age range homebuyer contingent used by the National Association of Realtors (NAR). NAR discovered that among those in this contingent who bought a home last year, 40% planned to live in the home at least 16 years. Not only is this more than triple the average length of ownership of a first home, it’s also double the average length of homeownership overall. This value is 48% for the lowest age bracket, between 18 and 24 years old. For reference, Generation Z is currently between 11 and 26 years old.
The major reasons for this are economic. Interest rates have skyrocketed so high this year that those who have managed to find a home last year likely locked in a low interest rate. They’ll want to ride that rate as long as they can. Even those who weren’t able to find a low interest rate aren’t going to want to go through the hassle of finding a new home to purchase, as there simply aren’t very many homes available. Supply is lower than demand, and construction is still failing to meet demand, even as the construction rate inches back upward and demand has somewhat dropped off. They’re more likely to refinance once rates drop than look for a new home. Home prices are also a factor. Rising prices means needing to save up for longer, both before you buy your first home and while living there. There’s also a bit of a psychological factor here; if you need to wait a while to buy, you want it to be something worth the wait. There’s also another potential reason that economists may not notice at all, since it’s more cultural. Millennials are less likely than older generations to marry young or have children. This means they are also less likely to need a larger home. Their first purchase could look like a starter home, but it may actually be perfectly well suited to their long-term needs.
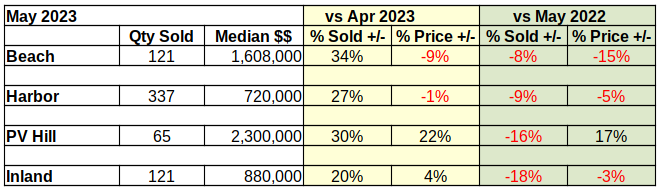
Compared to last month, South Bay home sales look very positive, except for a little tarnish in the Beach cities prices. The sales volume was up by substantial margins in all areas. Prices were mixed with a remarkable median price increase on the Hill. The only exception: After showing positive growth for the past two months, prices at the Beach took a substantial tumble in May.
Year over year activity was an entirely different story. Sales volume was down significantly from last year in all areas. Prices took a hit everywhere except on the Palos Verdes peninsula. (More about that below.) Entry level homes in the Harbor and Inland areas were impacted the least, though even a 3% drop in a single month is significant in the world of real estate.
We report actual statistics rather than “seasonally adjusted”.numbers. May is traditionally the launch into buying season in the South Bay, so a May increase in volume from April is to be expected. On the other hand, a 10-20% decrease from May of last year indicates a heavily retrenching market. Every month since the beginning of this year, the number of homes sold in the South Bay has decreased in comparison to 2022.
Similarly, median prices across the South Bay have dropped from the highs of 2022. There have been scattered instances of positive change, like the 17% increase over May of last year for PV. Overall though, prices have been collapsing at an ever more steeply declining rate since January.
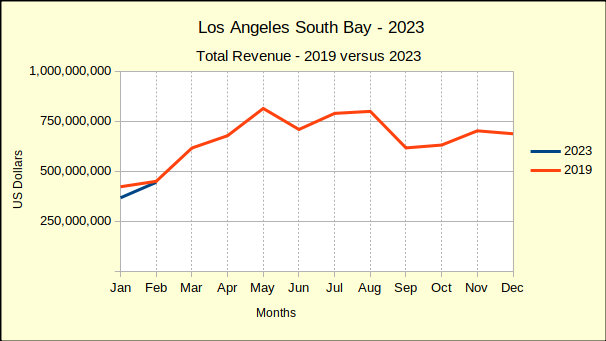
Much has been said about the steep rises and falls of sales volumes and median prices since the Covid pandemic hit in early 2020. That leaves 2019 as the last “normal” year of business. At the mid-year point we’ll give a more in depth comparison to 2023 to hopefully provide a more stable picture of the market. In the meantime, year to date statistics for the first five months reflect an overall decline of 23% in sales volume, and an increase of 33% in median price. The sales slowdown has most affected the Beach Cities with a drop of 39%, followed by the Inland area at 21%, the harbor at 19%, and finally the PV Hill with a 14% slip. A review of the changing median prices across that many years requires adjusting for desired inflation as opposed to uncontrolled inflation.
Beach Cities: More Sold at Lower Prices
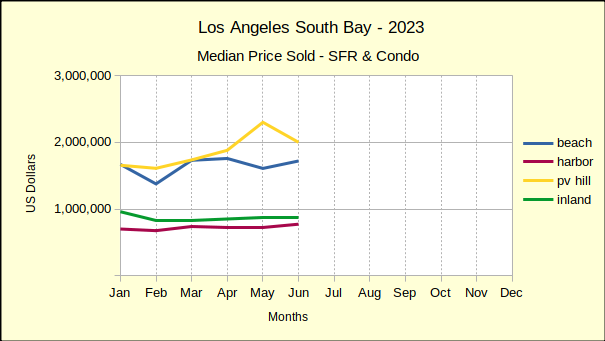
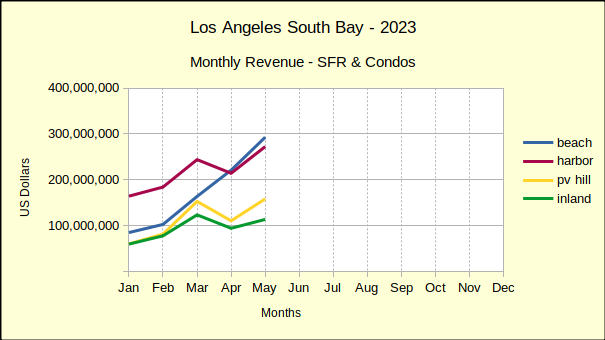
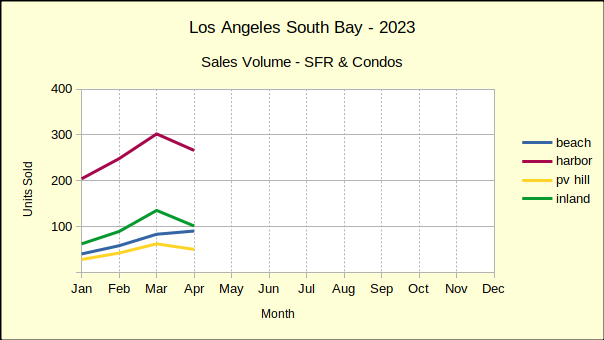
Monthly, the Beach Cities have been on a roll. Even in April, when the other three areas took a nose-dive, the Beach climbed steadily higher in both sales volume and median price. The blue line on the monthly revenue chart below shows surprisingly strong growth.
A closer look at the sales data shows some of the detail. Two of the 121 Beach area sales were on the Strand, with one selling at $18.6M and the other at over $15M. Sales in that rarefied atmosphere tend to be few and far between. In fact, one of those properties sat on the Multiple Listing Service (MLS) for almost exactly three years before it sold. With the April median price at $1.6M, the impact to the aggregate statistics becomes apparent quickly.
Market time for the Beach Cities in May was actually quite prompt, with 79% of the homes sold having spent less that 30 days on the MLS. Pricing was equally strong, with sales prices coming in at two percent above asking price. While the high sale was $18.6M on the Strand, the low was $530K at Brookside Village in Redondo Beach.
Harbor Area: Sales Up – Prices Down
As the red line in the chart below reflects, Harbor area sales entered the spring selling period with a bang! Sales volume was up 27% over April—but, remember April sales were down by 12% in the Harbor and down 13% across the South Bay. Downward pressure on prices has been showing up since the beginning of the year. Out of the first five months of 2023, month to month median prices of Harbor area homes have dropped three times. May saw a 1% decline, which was a repeat of April’s price slip.
Annual statistics cast a recessionary shadow across the picture. Looking back at May of 2022 shows the same month this year with 9% fewer sales and a drop of 5% in median price. Year to date, 2023 has lost 29% in sales volume and 5% in median price.
Compared to the first five months of 2019, the last “normal” business year, Harbor area volume was off 19%. The median price remains positive at 33% above the 2019 median. So far this year the median at the Harbor has declined an average of 5% per month. Given that rate, it’s reasonable to expect a total loss of the price gains since 2019.
Like the rest of the South Bay, the time on market for May was short as 75% of sold properties went into escrow within 30 days of listing. The low sale for the month was $269,500 and the high was $4M, a relatively high price in what is generally considered an entry level market. Interestingly, the high sale was originally listed at $9M in March of 2021, sitting on the market for two years before an accepted offer.
Palos Verdes: Home Sales & Prices Hot On The Hill
On a month to month basis, homes on the Hill came in with a 22% increase in median price, that being on top of back to back 8% increases for March and April. We’ve long said that homes on the Hill are undervalued. It looks as though that will soon be changed.
Monthly sales volume also jumped 30% for PV, though it has slowed since February and March when it was up 50% and 48% respectively. This pattern of sales increases slowing holds true for most of the South Bay. During the first quarter of 2022 the local real estate market was on fire, and then came the interest rate increases.
When the interest rates were bouncing around 5% during April and May of last year, the PV sales volume had already begun a long, slow decline. Sales figures were off by 30%-40%. So far this year, sales have continued to fall and are, in aggregate, now 31% below 2022 volumes.
Again on a year to date basis, median prices in PV are down 11%. Because the PV Hill has a comparatively small amount of homes, statistics can be volatile. June was the peak of PV business in 2022. While the summer months are typically busier and more competitive, expect this June to be less “exuberant” than May, or last June.
Like the rest of the South Bay, about 75% of homes sold on the Palos Verdes peninsula were active on the market for 30 days or less. On average, the sales price was 2.6% above the asking price.
Inland Area: Seasonal Bump In Sales and Prices
In May, the Inland area kicked off the spring selling season by pushing month to month sales volume upward 20%. While the volume of sales increased on a month to month basis, the median price went up by 4%. This seasonal bump in sales and prices contrasts sharply with the longer look of a year over year view. Comparing May numbers from last year to this year gives a reverse result. The number of homes sold in the Inland area fell 18% from May of 2022, and the median price fell 3%, dropping back to $880K from $910K last year.. The longer perspective shows a clear decline in sales accompanied by a hint of decline in median prices.
Looking at the first five months of the year shows sales volume off in total by 68%, or an average monthly decline of nearly 15%, another indicator of the slow market. It’s joined by a 1% drop in the year to date median price. On the positive side, 87% of the Inland area sales for May closed within 30 days of being listed. With business slip-sliding away, everyone involved is making the transactions happen as quickly and smoothly as possible. The high and the low sales figures for the Month were $1.7M and $310K, respectively. Sellers rejoiced at, and willing buyers paid, an average sales price of 2.9% above the asking price.
The high mortgage interest rates we’ve been experiencing have been the result of benchmark rate increases by the Federal Reserve. The benchmark rate isn’t directly tied to mortgage interest rates, but the benchmark rate does have a strong effect on interest rates. Now, though, no more rate hikes are expected, which should cause interest rates to level off, and then start to decline.
This levelling off followed by a decline is exactly what the Fed was aiming for with the rate hikes. It’s impossible for mortgage rates to drop without the real estate market, and in turn the economy as a whole, taking a hit. By raising rates above what they should be during a period of high prices, what the Fed has done is soften the blow by allowing the decline to be more gradual. Of course, this comes at the cost of significantly decreased affordability for the period of the rate hikes. Once interest rates fall below 6%, which should happen before the end of the year, the market should pick back up again. However, the effect may not be noticed until next year, as the end of the year is not generally a time of heavy market activity.
Builders have had it rough the past few years. The pandemic resulted in skyrocketing lumber prices as well as many job losses for construction workers. In order to get the most bang for their buck, builders started building luxury homes, which generally have a higher profit to cost ratio. But this couldn’t last long, as both market demand and legislation pressured them towards construction of affordable living homes, while at the same time, zoning restrictions made even this rather difficult.
Pressures on construction companies have started to ease up in most of the country, but not everywhere. Particularly in the West and Northwest, available land is an issue. Fortunately, builders may have figured it out and now have a new plan: Make smaller homes. It’s predicted that more affordable starter homes will become available within the next year or two, as 42% of builders are reducing the square footage of their homes. It doesn’t even require a big change — the nation’s largest homebuilder, D.R. Horton, is only reducing home sizes by an average of 2%. Builders are also planning to build more townhomes and duplexes, which take up significantly less space per unit than single-family residences.
The initial estimate of the median home price in California in the first quarter of 2023 was $760,260, for single-family residences (SFRs) only. Using this estimate, about 20% of California households could afford to purchase a median-priced home. This demonstrates a rebound from the last quarter of 2022, where it had dropped to 17% of households, down from 24% in the first quarter of 2022.
Affordability is weakest in Mono County, which experienced no change from its very low 7% affordability. The most affordable county has remained Lassen County, despise a slight drop from 54% at the end of 2022 to 53% now. Mendocino County had the largest increase in affordability, an increase of 12% from 14% at the end of 2022 to 26% now. No decreases in affordability exceeded 3% during the same time frame.
Though the US as a whole is significantly more affordable that the rather expensive California, the numbers show a similar trend. Affordability was higher in the first quarter of 2022, at 47%. It had dropped to 38% in the last quarter of 2022 before inching back up to 40% in 2023. Only three California counties — Siskiyou, Plumas, and Lassen — have a higher affordability rating than the national average.
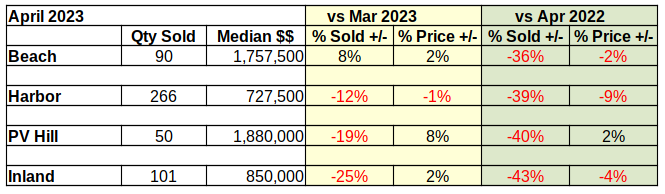
April of 2023 ended with a 40% drop in the number of homes sold across the South Bay compared to 2022. The median price was down 20% from last year in Palos Verdes and is up by a mere 1% at the Beach. Year to year median prices across the South Bay are down approximately 5%. Cumulative sales revenue for the first four months across the South Bay has dropped 39% from 2022 numbers.
Year to date, 2023 has been one of the slowest markets we’ve seen in recent years. Sales are off by 43% in the Beach Cities and are down by 22% across the South Bay compared to last year. Median prices escalated dramatically in 2021-2022, and are still above those of 2019 by 30-35%. However, the median has fallen in all four areas since late last year. We anticipate the median price continuing to drop until interest rates seriously decline again.
Business in the years between 2019 and 2023 was seriously impacted by the pandemic, and the massive government funds released to counter the effect of the pandemic. Looking back at 2019 and comparing it to 2023 offers a perspective on where the market is and where we can expect it to go during the balance of the year. Today we see a huge decline in the number of homes being sold. That has yet to translate into a significant decline in median prices, although 75% of year over year sales show prices falling.
At the same time the Average Days On Market (ADOM) has increased from about 7 days during the sales boom of 2021-2022 to about 30 days now. That’s a four-fold increase in the amount of time it takes to sell a home. For a seller who needs to move, that will feel like an eternity. It’s that sense of urgency that drives prices down and ultimately results in a shift of the market.
At the Beach “Sticky Prices”
Sellers in the Beach Cities had a good month in April—at least compared to March of this year. Compared to April of last year, the picture is far worse.
The number of homes sold in April was up 8% compared to March. That sounds positive, until the realization that sales volume was down 36% compared to April of 2022. At the same time, the median price was up 2% versus last month, and down 2% compared to the same month last year.
There’s a lot of talk among brokers these days about “sticky prices.” Recent sales at the Beach offer a good example of what that means. The statistics show that sales are down 36% from last year, however prices have only dropped 2%. Sales are falling because the number of viable buyers is down.
Interest rate increases have pushed the most tenuous group of prospective buyers out of the market. At the same time, sellers are still revelling in the boost to median prices that came with record low interest rates during the pandemic. Beach area sellers have yet to adjust to the reality of a re-trenching economy. That adjustment is “sticky prices.”
Harbor Sales and Prices Off
The neighborhood can affect how long it takes the median price to respond to changes in the economic environment. While sales volume and pricing has remained strong at the Beach, sellers and buyers in entry level communities are impacted more immediately by shifts in the economy.
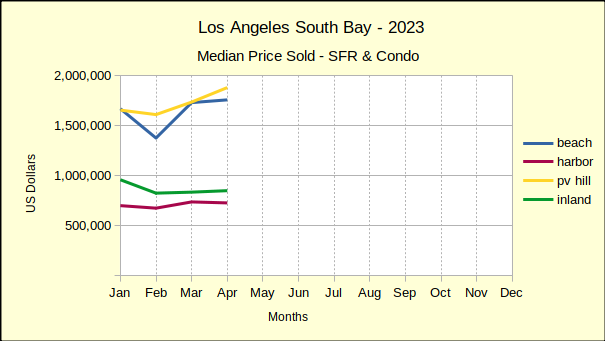
Thus we see the give and take of the market bring median prices into a stable range early in the year in the Harbor area. The red line in the median price chart below shows four months of reasonably steady prices. While month over month prices have shown only a 1% drop, the monthly sales volume has taken a 12% dive from March, as shown in the Sales Volume chart, above.
The monthly decline in sales was multiplied in the year over year statistics. April sales volume was down 39% from April of 2022. For the same period, the declining sales volume was coupled with a 9% drop in median price. So the entry level communities demonstrate a much quicker and deeper response to changes in the financial picture.
Part of that response is the time on market, which has risen from 15 ADOM in mid-2021 to 26 ADOM in April of this year. The increasing time required to sell homes contributes to the number of homes available on the market. Both factors contribute to falling purchase prices.
Palos Verdes In Extremes
Through 2021 and 2022 home prices on the Palos Verdes peninsula benefitted from the Covid pandemic more than any area in the South Bay. In the median price by quarter chart, shown below, the yellow line is seen jumping up and away from the blue line of the Beach Cities. Unfortunately for home owners on the Hill, that price boost has already pulled back into line with prices of Beach area homes.
Comparing the first four months of the 2023 to 2022 median prices on the Hill have dropped 16%. It’s a steep decline in view of decreases at 3% and 6% in the Inland and Harbor areas, respectively. Even more so when looking at the 1% increase at the Beach.
The statistics look much better when comparing Palos Verdes sales from 2023 to statistics from 2019, the last “normal” year of real estate business. Sales volume on the Hill is down a modest 13%–modest by comparison to the Beach, which is down 43%. In contrast, median prices in 2023, compared to 2019, are still showing positive growth of 30%.
So, if one were to take the Federal Reserve System position that 2% annual growth is a desirable target, where would prices be today? The median price in Palos Verdes in May of 2019 was $1.5M. Jump forward to 2023 and that becomes about $1.6M. The median on the Hill last month was $1.9M, which suggests further price reductions.
Inland – The Steepest Fall
From an investment perspective, homes in the Inland area of the Los Angeles South Bay are “bread and butter.” These are the homes, much like those in the Harbor area, which reliably increase in value over long periods of time at a slow and steady rate. Most importantly, they house the bulk of our community.
In the short term, Inland home sales volume is down 25% from March to April of this year. Median prices are up 2% for the same period. This is the steepest fall in number of homes sold in the four areas charted.
Year over year, sales volume is off even more at 43% below April of 2022, and prices similarly down by 4%. We expect a seasonal boost to sales for the second quarter, when families most frequently schedule moves. Beyond that, most predictions are for continued softening in the real estate market as the Fed struggles with inflation. (The April Consumer Price Index, [CPI-U] for Los Angeles metro was 5.2% for Housing.)
In the US in general, the market has been slowing down. This is leading to a higher inventory — in March 2023, the number of homes for sale was 9% higher than in March 2022. But this isn’t the case in California. In fact, for-sale inventory in California’s largest metro areas was actually down 14% between the same two months. The difference is most stark in San Jose, where inventory dropped 32%.
However, this does have a couple of explanations. Available inventory is a raw number. It doesn’t take into account the number of buyers. Home sales volume is more indicative of the number of buyers, and that dropped significantly more than 14% between March 2022 and March 2023, by 33%. Thus, the ratio of homes available per buyer is actually higher than it was last year. In addition, California is still being affected by lower construction rates, while it has recovered in many other states. The major reason is pushback from local homeowners who don’t want additional construction in their neighborhood.
Are you planning to have kids soon and need ideas for names? The Social Security Administration (SSA) just released the list of the most popular baby names last year. If you want to be trendy, you can pick something from this list. Alternatively, you can take it as a list of names to avoid. Either way, it could be useful information, or could simply spark your creativity.
Liam and Olivia are the top choices for boys and girls respectively, and have been for several years now. Liam has been #1 for six years, and Olivia for four. The rest of the top ten list for boys are Noah, Oliver, James, Elijah, William, Henry, Lucas, Benjamin, and Theodore. For girls, they’re Emma, Charlotte, Amelia, Sophia, Isabella, Ava, Mia, Evelyn, and Luna. Of all twenty of these names, Luna is the only one that has never been in the top 10 before now.
The SSA also provided data on which names are growing fastest in popularity. None of these names are anywhere near the top 10, but they’re gaining the fastest. For boys, they’re Dutton, Kayce, Chosen, Khaza, and Eithan. For girls, they’re Wrenlee, Neriah, Arlet, Georgina, and Amiri.
While construction rates have been low overall since the pandemic, construction rates can potentially vary significantly depending on the type of building you’re looking at. This can be the result of different levels of demand or zoning regulations. Recent zoning reforms have tried to push construction more towards multi-family residences, believing that zoning is the primary obstacle.
However, if recent numbers are any indicator, there simply isn’t much demand for multi-family residences. Construction starts on buildings with five or more units dropped by 6.7% in March. Permits for such buildings also fell sharply, by 24.3%. At the same time, construction of single-family residences (SFRs) increased by 2.7%, and SFR construction permits increased by 4.1%. Overall, construction starts dipped down 0.8% and permits decreased by 8.8%.
Even though this wasn’t the goal of the zoning reforms, not everyone sees this as a bad thing. SFRs being in higher demand could signal that more people are ready to buy as opposed to rent. However, since it’s not renters but potential landlords that would create demand for multi-family residences, it’s also possible that homeowners simply aren’t seeing the value in renting the units out, leaving potential tenants in the dust.
With how much discussions of real estate tend to pit buyers and sellers against each other, it’s easy to forget they’re often actually the same people. Many sellers are also buyers, either planning to buy to replace the home they’re selling, or already bought another home. This isn’t always the case, of course — it’s entirely possible that someone could have never purchased anything, inherited two homes, and sold one of them. But this isn’t most sellers. What this means is that market conditions that are generally considered to primarily affect buyers will also affect sellers.
Such as right now, where it appears that the high interest rates that are holding buyers back are also making sellers hesitate. The majority of homeowners now have an interest rate lower than the current rates, especially if they took advantage of ultra-low rates such as the rates during the pandemic. If these homeowners were to sell and buy a new home, they would be losing their low interest rate and gaining a high interest rate. For 82% of them, that may not be worth it. Over half of those considering selling right now are deciding to wait until interest rates drop.
For the past couple of years, house prices had been rising dramatically across the country. Here in California, we’re now starting to see prices drop since the start of this year. Prices are now falling in all 12 major housing regions west of Texas, as well as in Austin, TX. The same can’t be said everywhere, though. In the 37 largest metros east of Colorado, excluding Austin, TX, prices are still rising. Of course, markets can differ drastically by state, but such a clear divide between eastern and western US may be unprecedented.
Falling home prices was the expected result of the federal benchmark rate hikes. It seems to be working in the western US, as prices become too unsustainable to continue to increase. The regions with the most significant price drops are the ones that were rather expensive. But there are still other factors at play in the eastern US, driving prices still upward. Some areas, such as Hartford, CT and Buffalo, NY, never reached unsustainable home prices and remain rather affordable. They also have rather low inventory. These factors combined are keeping prices from dropping, leading to an 8% increase in prices in January. Florida is attracting many new employees with multiple financial companies relocating to Miami in 2021 and 2022. Prices are expected to eventually start falling even in the east, but don’t expect anything drastic. Low inventory across the country is preventing any sudden market collapse.
Most buyers are aware that homeownership has some extra costs associated with it. You can’t just pay the purchase price and be done. But it seems the vast majority aren’t prepared for just how high those costs can be. A whopping 90% of homebuyers in the past three years underestimated the hidden costs of homeownership, and 73% regretted some aspect of their purchase.
For a third of them, the culprit was property taxes. Even if you have purchased before, buying a new home in a high-priced market will probably drastically change your property tax values. A quarter or slightly over a quarter of respondents didn’t think roof work, renovations, or utilities would be so expensive. Annual expenses among respondents average $17,459 on top of mortgage payments. In hindsight, 57% of buyers know what they would have done differently. Among this subgroup, 42% would have purchased a home that didn’t require quite so much maintenance. It may cost more up front, but the annual costs could be significantly lower. 33% think they just needed to negotiate a lower price, and 29% would have gone for a lower-priced home to begin with. 27% believe it was simply the wrong time to buy, and they would have waited for a better deal.
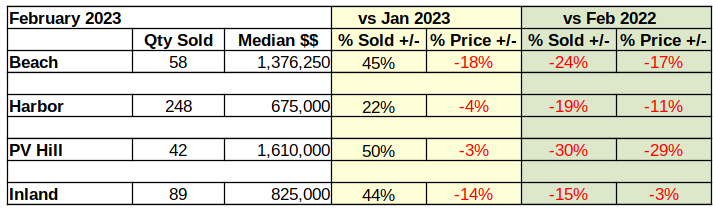
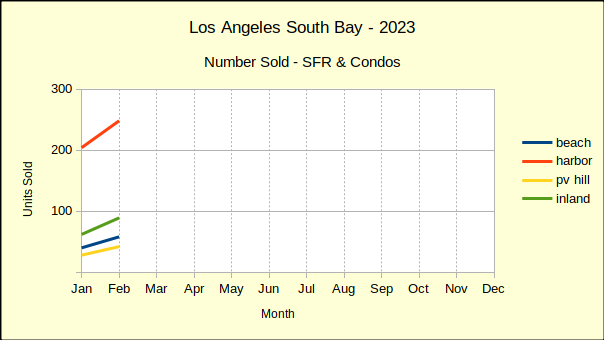
Last year ended with sales volume off, median prices coming down and revenue dropping fast. January showed little change. February of this year shows sales volume up from January by as much as 50%. The reason why is obvious–the median price is simultaneously dropping by percentages as high as 18%.
Comparing February activity to February a year ago shows significant declines in both sales volume and in median price. At that point in 2022 the market was just beginning to dip a toe in the recessionary waters. Now we’re wading into it.
The first week of March Fed Chairman Jerome Powell told Congress, “…the ultimate level of interest rates is likely to be higher than previously anticipated.” Powell’s pointed remark clearly tells us the most recent pause in interest rate hikes is momentary. The lowest local mortgage rates we could find at the time was 6.75%. As such, we anticipate rates in excess of 7% by summer.
February Sales Volume Climbs
About the second week of January mortgage lenders began loosening the interest rates in anticipation of a relaxation by the Federal Reserve. For the most part, local rates stayed below 6% until late in February when the Fed began dropping hints that inflation was still raging.
After a “soft” January, sellers in the market were dropping prices and buyers responding positively by making offers. Now that mortgage rates have resumed climbing, sellers will have to drop prices some more to remain attractive to buyers.
With only two months behind us this year, there are indications lenders will “see-saw” the rates throughout the year. Already this year we have seen retail mortgage rates moving up and moving down without influence from the Fed. It seems to be an effort to induce buyers to accept high interest rates based on the theory they were higher last week so this temporary reduction is a good deal.
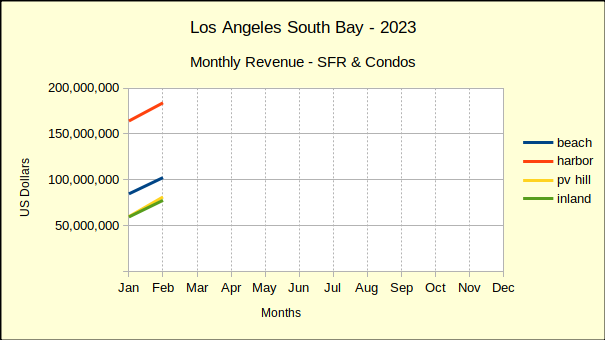
RevenueClimbs From January Depth
On a month-to-month basis, revenue across the South Bay is up 21% from January of this year. Don’t get excited—it’s only one month. January was one of the lowest performing months we’ve seen recently.
On a year-over-year basis, revenue is down 34% from last February! January was 38% lower than January of 2022. Year to date through February, revenue in the South Bay is down 36% and is expected to continue falling.
One of the more important statistics to note is how 2023 activity compares to 2019, which was the most recent “normal” year of real estate business. Across the South Bay real estate revenue for the first two months of 2023 is 7% below the same period in 2019. Restated, the South Bay has already lost over four years of gain in real estate revenue.
Median Price Slips, Volume Rises
More units of housing were sold in February than January, and the median price was lower in February. The Beach Cities saw a drop of 18% from January while the PV Hill held the decline to 3%. The Harbor area fell 4% and the Inland area dropped 14%.
Comparing February of this year to February of 2022 brought a harsher focus to the picture. All four areas have fallen from last years median price. The Beach is down 17%, the Harbor down 11%, the Hill is off 29% and the Inland cities down just 3%.
2023 Versus 2019 Shows a Sinking Market
The summary numbers comparing the first two months of 2023 to the most recent “normal” year of 2019 are not encouraging. Overall, sales revenue has fallen 7% below revenue figures for the same period in 2019. The Harbor area has fared the best, showing a 9% increase in revenue over January and February activity in 2019. Of course, that was four years ago and classic inflation would give that type of gain. It’s clear the “inflation on steriods” we’ve been experiencing is gone from the real estate industry.
The Beach cities provide an excellent indication of where the real estate economy is going. The first two months of revenue for 2023 is down 32%. Palos Verdes is down 2%, while the Inland area is up be a mere 1%. After four years of pandemic, recession, inflation and Federal Reserve manipulation the real estate market is tanking.
Disclosures:
The areas are: Beach: includes the cities of El Segundo, Manhattan Beach, Hermosa Beach and Redondo Beach; PV Hill: includes the cities of Palos Verdes Estates, Rancho Palos Verdes, Rolling Hills and Rolling Hills Estates; Harbor: includes the cities of San Pedro, Long Beach, Wilmington, Harbor City and Carson; Inland: includes the cities of Torrance, Gardena and Lomita.
Discrimination — sometimes legal, sometimes not — has kept Black homeownership rates below white homeownership rates for decades. Even now, Black homeownership rates are nearly 20 percentage points lower than the overall homeownership rate in California, at 35.6% versus 55% in 2021. Fortunately, it’s going up, albeit slowly. Between 2016 and 2021, the rate increased 2.5% percentage points.
Riverside County experienced the largest increase, going from 44% to 53% across the five years. However, the rate stayed the same or even decreased in some counties, including San Francisco where it’s remained just 22% and Santa Clara County which saw a drop from 30% to 25%. Even with the Black population in California only being about 6%, compared to the national value of 13.6%, it still accounts for over 2 million people. It certainly is difficult to find affordable non-rental housing for that many people, but there’s no reason it should be more difficult to house Black people than white people.