
March vs April
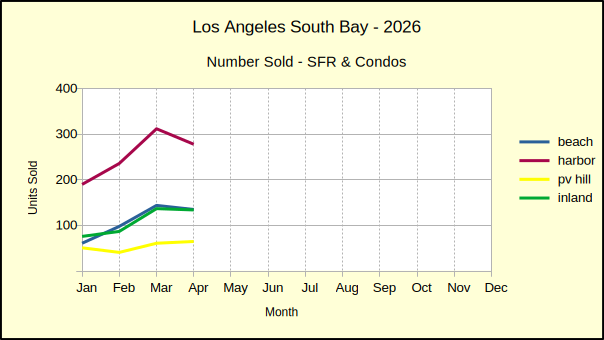
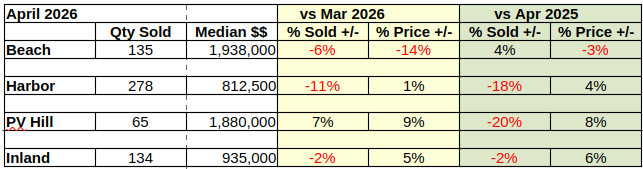
The number of homes sold across the South Bay during April fell 6% below March sales. The only growth occurred on the Palos Verdes Hill where 7% more homes were sold than closed escrow in March. The Harbor area took the hardest hit with a decline of 11% in home sales.
While the monthly median price is still mostly positive, April saw a 14% drop in median price for the Beach Cities. That significant fall for an area that is traditionally strong indicates prices may soon follow volume on the way down.
April 2026 vs April 2025
Comparing this April to the same month last year finds the number of homes sold in the South Bay dropped 10% over the past 12 months. The Harbor and Hill areas took the worst beating, losing 18% and 20% respectively. Only the Beach area came in positive, with a mere 4% increase in sales—a collapse from the 31% growth the prior month.
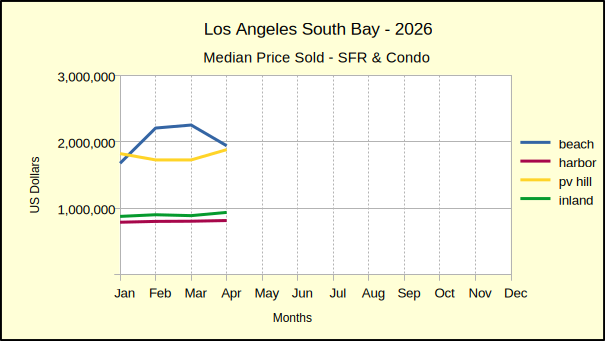
On an annual basis, the median price was much like the monthly. Once again, only the Beach Cities showed red ink. This time with just a 3% loss in value. Median prices have had far ranging swings since the first of the year. The year started with a 40% decline in the median for the Beach area. The highest increase in median price was 10%, also at the Beach.
2026 Year to Date vs 2025
For the first four months of the year, sales volume has slipped by 6% across the region. In the same time frame, median prices have dropped modestly everywhere except the Harbor area, where prices are maintaining a 3% boost over the first four months of 2025.
Year to date sales and prices likewise show the negative impact of inflation. Price resistance is showing up both in purchases and in leases.
The Outlook for May
Sales volume has been negative three months out of four so far this year. March countered in all areas, but April took back the increases everywhere except the Beach. A quick look at the number of homes sold already in May does nothing to improve the outlook. At this point the best to be hoped for is going from double digit losses to single digit losses, with maybe an occasional positive.
Median prices are treading a borderline. If sales volume continues to slip, as everything indicates, prices will suffer. The market is essentially in stasis, and fewer active buyers will force price reductions from sellers who often have no choice but to sell.
On the other hand, all the wars could end and we could go back to building and selling homes for people.
Stats for the Detail Minded
Beach :
M-m, vol: 135, -6% med: 1,938,000, -14%
y-y, vol: 4%, med: -3%
ytd, vol: 6%, med: -2%
vs 2019: vol: -8%, med: 66%
Harbor:
M-m, vol: 278, -11% med: 812,500, 1%
y-y, vol: -18%, med: %
ytd, vol: -13%, med: 3%
vs 2019: vol: -18%, med: 48%
Hill:
M-m, vol: 65, 7% med: 1,880,000, 9%
y-y, vol: -20%, med: 8%
ytd, vol: 2%, med: -8%
vs 2019: vol: 4%, med: 36%
Inland:
M-m, vol: 134, -2%, med: 935,000 5%
y-y, vol: -2%, med: 6%
ytd, vol: -6%, med: 0%
vs 2019: vol: -9%, med: 39%
Beach=Manhattan Beach, Hermosa Beach, Redondo Beach, El Segundo
Harbor=Carson, Long Beach, San Pedro, Wilmington, Harbor City
PV Hill=Palos Verdes Estates, Rancho Palos Verdes, Rolling Hills, Rolling Hills Estates
Inland=Torrance, Lomita, Gardena
Photo by Brandon Brown on Unsplash