Here we wrap up 2019 and prepare for 2020, with a tumultuous election at hand and threats of an economic slowdown rearing in the local news. Our first thought is to look for a baseline from which to measure all the changes. So we did some research and assembled actual sales data from the last few years here in LA’s South Bay. Let’s walk, quickly, past some history.
Through 2015 nearly all real estate only became more expensive. Regardless of where you were in the country, or what kind of property you were considering, prices were only going one direction–up. Then, in 2016 the real estate world started changing. Our little corner of the the west coast is no exception. While some areas stand out as successes, others are showing signs of stress.
Torrance prices in the selected zip codes were varied, ranging from a low of 0% in 90505 for 2018 up to a high of 10.2% in 90503 for 2017. You read that correctly–Torrance prices have not gone negative yet! North Redondo Beach has also run positive every year, though 2019 looks like it will end with a mere .7% increase for the current year.
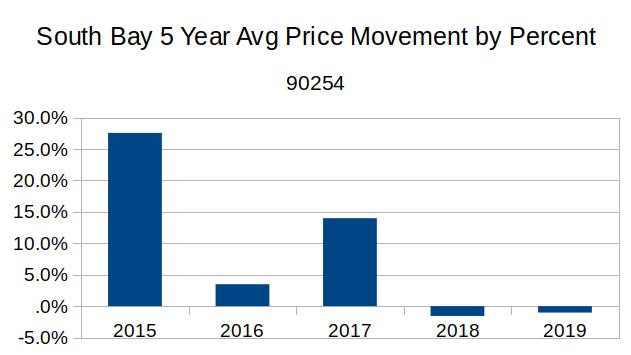
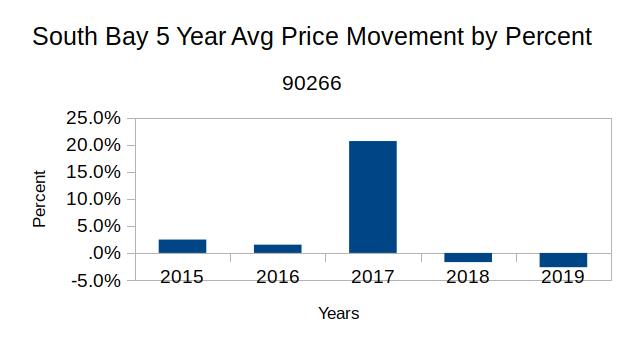
Manhattan Beach is a star performer, with average sales prices consistently above $2,000,000. Surprisingly, the city with the largest average increases is Hermosa Beach, with a price increase of 27.6% in 2015 and another huge price jump 0f 14% in 2017. Both cities declined in 2018 and 2019. Manhattan Beach was down by -1.7% and -2.6%, respectively. Hermosa Beach dropped by -1.6% and -1.0%, respectively.
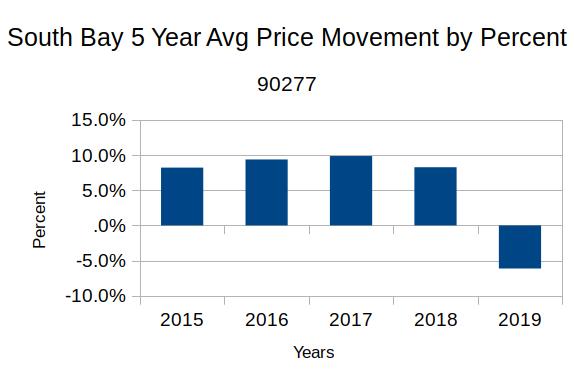
While Manhattan and Hermosa were making one or two big jumps, south Redondo plugged away with annual increases between 8% and 10% until 2019. Unless something big happens in the final quarter of the year, 90277 will drop by about -6% this year.
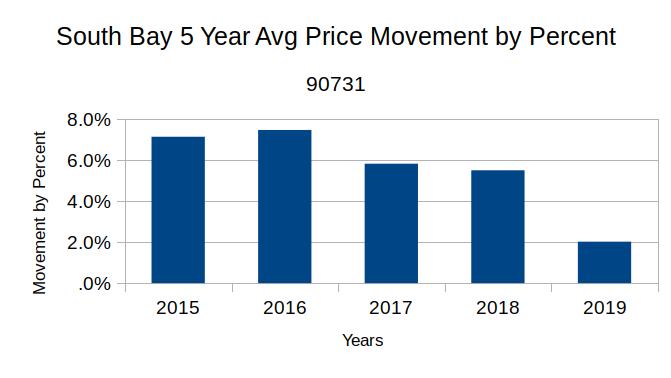
San Pedro has turned in a solidly positive set of numbers, too. The 90731 zip code is poised to show a 2.0% increase for 2019, down from a high of 7.5% in 2015. The 90732 zip code has slipped into negative territory with a forecast drop of -1.5% this year. Prior years have been over 8% increases, demonstrating the desirability of those harbor and ocean views.
The Palos Verdes Peninsula has proven to be quite a “mixed bag” of ups and downs in average sales prices. Rancho Palos Verdes followed a predictable path of gradual increases up to 6.2% in 2018, with a projected decrease of -2.0% this year. The 90274 zip code was all over the map though. It started with an 8.4% increase in 2015, dropped into negative territory the following year with a -4.7%, then dropped another -.8% in 2017, only to jump up by 8.7% in 2018. We’re currently forecasting a 1.5% increase in those prices for 2019.
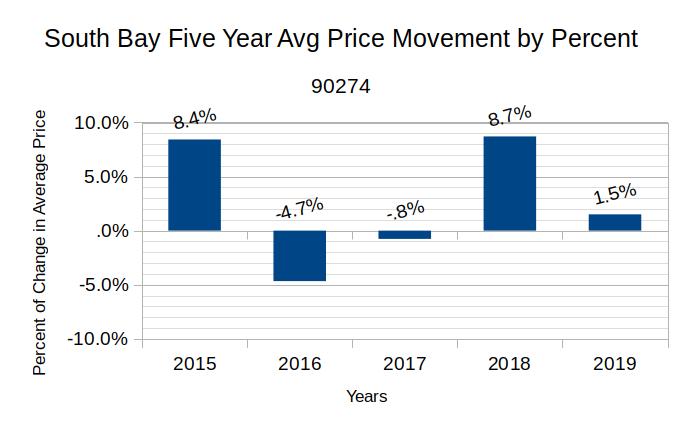
If you live in the 90274 zip, and are interested in values, give us a call. We are working on a more detailed analysis of where and why distinct PV neighborhoods are seeing values shift on a differing pace. It’s very possible the age of homes in parts of the 90274 zip has pushed them into a “sweet spot” for upgrade or redevelopment. Alternatively, there could pockets not impacted by the economics of the greater community.
Check your city on the chart above. Are your property values still climbing? Or have they already hit the top and started back down?