South Bay Real Estate Speculation?

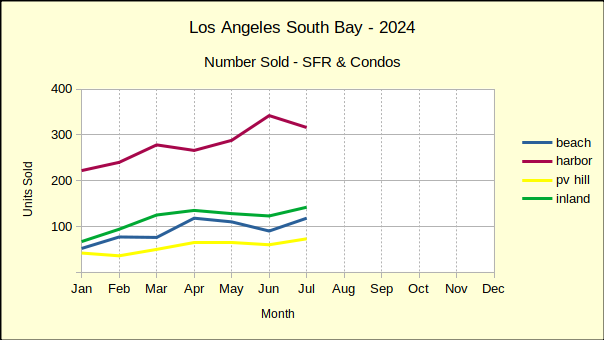
As 2025 rolls by the real estate market in the Los Angeles South Bay continues to slide downward. January started the year with 11% more homes sold than in 2024. Now, with June in the books, the difference is 0% growth in sales across the South Bay. From month to month the numbers are up and down, but the end result is down.

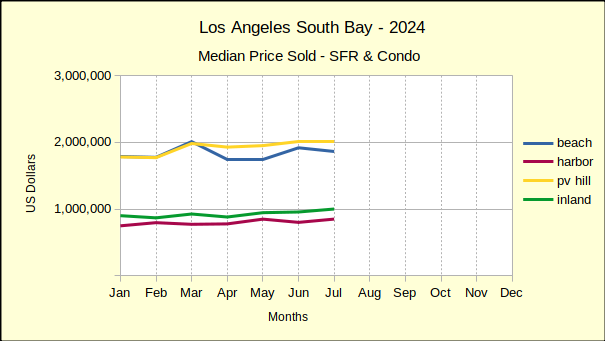
With the exception of the Beach cities, the same thing is true for the median price. The four areas of the South Bay are distinguished from each other by the basic appeal of each area to potential home owners. Comparing real estate from 2024 to 2025 shows a distinct difference between the Beach cities and the other three areas.

Consider the sales volume, for example. Across the South Bay the cumulative change in the number of homes sold for the first half of each year, shows a 7% increase. However, the Beach area measured in at a 26% increase. The Harbor area was 4%, Palos Verdes peninsula was 2%, and the Inland cities were 3%. Different South Bay buyers are definitely viewing things differently.

Looking at the median price shows a similar story. In the same order, Beach was 11%, Harbor was 1%, Palos Verdes was -1% and Inland was -1%.

Clearly, buyers in the Beach cities have a different perspective than those in the rest of the South Bay. It would take some serious research to study the various purchases, what type of buyer was involved, how the property is currently being used, and how big of a premium the buyer was willing to place on the property, etc., in order to understand the motivations. An early guess is speculation. Buyers with sufficient available resources are speculating that the value will continue to go up without interruption. There might also be some number of those buyers who believe short term rentals will help defray the carrying costs. And probably a few who just want to live at the beach.

The key tying them all together though, is speculation. Those Beach area buyers believe the economy is going to hold and their purchases are going to further advance in value. That opinion appears to be changing though. The June median results for the Beach shifted from positive to negative in what may be an indication of the direction of our economy. We’ll be back next month with an update.

Beach: Mostly Down

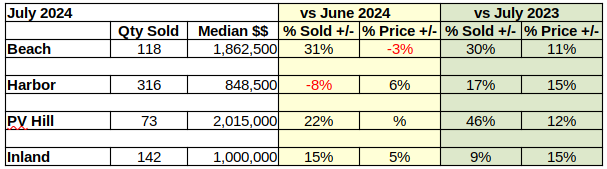
Compared to May the Beach cities real estate performance was a bust. June is the second “down” month in succession for the Beach. At 117 units sold, monthly sales volume dropped 4%, after dropping 2% in May. Median prices in the Beach area have been negative since February. The median for June was a mere $5000 below last month’s $1.9M, leaving a statistically insignificant 0% drop.

In year over year sales volume, the Beach did much better, with a 30% increase in the number of homes sold over June of 2024. However, median price took a nosedive from June of 2024, falling from positive 9% in May to a negative 1% in June this year.

Contrasting the first six months of 2025 to the first half of 2024 lends the Beach cities a win. While the South Bay as a whole saw an increase of 7% in the number of homes sold over those sold in 2024, the Beach area jumped by 26%. For the same period of time, Beach prices climbed by 11%, far better than any of the other three areas.

As a point of reference, the number of Beach homes sold in the first half of 2025 is 17% below the number of sales in 2019, the last “normal” business year before the pandemic. Over the same time frame, median prices have increased 54%.

Harbor: Mostly Up

Real estate in the Harbor area showed surprising resilience in June. With 335 homes sold, sales volume was up 14%. At the same time, the monthly median price of $838,000 at the Harbor was up 3% from the prior month.

In the only decline for the Harbor in June, the annual sales volume slipped slightly with a 2% decline. This was offset by a 5% increase in the median price over the same month last year.

Year to date statistics brought even more positive news for the Harbor area. Sales volume for the first six months of the year was up 4% over sales in 2024. The median price was also up, with a modest increase of 1%.

Much like the Beach cities, when looking back to pre-pandemic real estate, the sales volume is 18% below that of 2019 while the median price is up 46%.

Hill: More Down

On the Palos Verdes Peninsula, the only positive number for June was the median price, which rose from $1.85M in May to $1.94M in June, for a 5% increase. Heading the opposite direction, monthly home sales dropped by 34%, ending the month with 49 sales.

In comparison to 2024, PV cities lost ground in sales and in prices. The number of homes sold fell by 18%, while the median price lost 4%.

With the first half of 2025 in history, homes on the Hill appear to have settled in with modest sales volume increases accompanied by small decreases in price. As of June, homes sales are up by 2% and the median is down 1%.

Compared to the first six months of 2019, Palos Verdes volume is off by 9%. For the same period, the median is up 44%.

Inland: And More Down


After four months of sales growth this year the Inland area flipped with a 20% drop from last year. Running the opposite direction from the sales decline, the median price jumped by 11%, coming in at $965,000.

Year over year statistics likewise ended with a drop in the number of homes sold and an increase in the median price. Compared to 2024 sales volume was down 7%, while the median climbed 1%.

At mid-point in the year, the Inland area is posting a 3% increase in sales over 2024 business. That number seems quite reasonable, especially when compared to the monthly sales which range from 18% increase to 20% decrease. While the total number of sales is down, the median price for the first half of the year is up 1%.

Continuing the year to date comparison with pre-pandemic activity, the Inland area is showing sales at 14% less than 2019, combined with a median price at 38% higher than then.

Beach=Manhattan Beach, Hermosa Beach, Redondo Beach, El Segundo
Harbor=Carson, Long Beach, San Pedro, Wilmington, Harbor City
PV Hill=Palos Verdes Estates, Rancho Palos Verdes, Rolling Hills, Rolling Hills Estates
Inland=Torrance, Lomita, Gardena

Photo by Matthew Davis on Unsplash

South Bay Real Estate Bonanza

July brought a bonanza—of sorts—to real estate in the Los Angeles South Bay. Sales volume, which had been falling below last year for three of the last four months jumped up 20%. Granted, July was an unusually slow month in 2023, compared to most years including 2024.

Month over month showed a comparable increase. Total sales volume was up 6% from June to July. The only negative for monthly sales was in the Harbor area where activity was off by 8%.

More importantly, year to date through July, sales volume was up 1% across the South Bay compared to the same period in 2023. With over half the year past already, some growth is a positive sign. This close to November on a presidential election year, one would expect the market to be looking better than it has been.

In fact, The number of homes being sold has still not recovered from the pandemic. Sales this July were 22% fewer than they were in July of 2019! As discussed previously, because the mortgage interest rates were temporarily at rock bottom, about 40% of the homeowners in California currently are “trapped in a mortgage they can’t afford to leave.” This promises to maintain downward pressure on home sales for the better part of a decade. Paradoxically, the reduced inventory is contributing to rising prices.

More homes were being sold in July, and they were being sold for greater prices. Annual increases in the median price were up 15% in entry level neighborhoods. At the Beach and on the Hill median prices didn’t reach quite as high, but were still more than 10% above July of 2023.

Monthly pricing showed the contrast between high end and entry level homes more clearly. In the Beach area the median dropped 3% from June, while on the Peninsula, there was no change in the median price. In contrast, the Harbor and Inland areas rose 6% and 5% respectively over June numbers.

Comparing the first seven months of this year to last year shows inflation continues to plague the real estate economy. Median prices rose in a range between 6% and 9% in the South Bay during the period.

Beach: Highest YTD Sales Volume Increase

Sales in the Beach cities jumped from 90 homes in June to 118 in July for a massive 31% monthly increase. This was matched by a 30% annual increase over July of 2023. Month to month statistics, as well as same month last year comparisons have shown tremendous variability this year.

The rapid fire changes precipitated by the pandemic, and subsequently by the Federal Reserve in an effort to keep the economy under control, created wild swings in the number of homes sold. At the same time the shifts in median price were less frequent and considerably less wide-ranging.

Today, looking at the year to date summaries for both, sales volume and median price, the numbers have moderated greatly. Sales volume at the Beach measured against last year has ranged from negative 27% to positive 33%. That huge range smoothed out to 6% growth in the year to date view.

Likewise, the median price, which has been a bouncing ball, declined 3% from June and increased by 11% over July of last year. Comparing the year to date from 2023 to 2024, the median settled in with a 6% increase for the longer term perspective.

Harbor: Highest YTD Median Price Growth

Monthly sales volume in the Harbor area fell 8% to a total of 316 homes sold in July compared to 342 sold in June. Annual sales moved the opposite direction, rising 17% from July of 2023 to July this year. For the first seven months of 2024 sales have fallen 1% compared to the same period last year.

Median prices had fallen 6% in June and have reclaimed that loss with a 6% growth in July. The new median, $848,500, is a 15% improvement over July of 2023. Year to date the median price is up by 9% in the Harbor area over the same seven month period in 2023.

Interestingly, every month this year has been a growth month for the year over year median price at the Harbor. The lowest increase has been 4% in March and again in June. The highest has been 18% in both February and May.

Hill: Highest Median Price In South Bay

Monthly data for the PV Peninsula came in with 73 homes sold for a 22% increase in volume over June. Annually, sales showed a 46% increase over July of 2023, a welcome change from the 24% drop in June vs June numbers. Year to date sales posted a 4% increase in volume over the same seven months in 2023.

PV registered a 12% annual increase in median price to $2,015,000 in July, so far the highest median in the South Bay for 2024. It doesn’t quite reach the $2,300,000 of May, 2023, but is one of the more impressive months in recent years. The monthly increase from June was negligible, but the timing in 2023 coincided with a downward shift in median sales prices. So, the change shows up as a 8% increase in the year to date median.

Inland: Median Price Hits $1,000,000 First Time

Sales volume for the Inland area jumped in July—up 15% month to month for a total of 142 homes sold, and up 9% since July of last year. Being past the halfway point of the year boosts the value of the the year to date statistics which come in at a mere 2% through July.

At the same time, the July median sales price for the Inland cities climbed 15% above July 2023 and hit $1,000,000 for the first time! Last year’s number was pretty run-of-the-mill so lends some import to this year’s improvement. The 2024 year to date median price calculation supports the strength shown by the monthly and annual numbers with a solid 7% increase over 2023.

Why Use Median?

A brief comment on median price and why it’s often used in real estate: Averages are used for a great many things in making comparisons, and for things that change frequently, averages do a great job. Medians, on the other hand, minimize the ‘jerky’ nature of averages and show directional movement better than a lot of up and down action.

A median is exactly the middle of a group of numbers, so that half are higher and half are lower. So the impact of a single outlier number shows less distortion on the longer term trend line of the values. In other words, it’s easier to see what your investment will likely be worth in 10 years.

Most of us don’t buy houses often enough to care about movement over the last 30 days. We’re interested in staying put for 10 years, plus or minus. The median trend will show us the most likely path.

Beach=Manhattan Beach, Hermosa Beach, Redondo Beach, El Segundo
Harbor=Carson, Long Beach, San Pedro, Wilmington, Harbor City
PV Hill=Palos Verdes Estates, Rancho Palos Verdes, Rolling Hills, Rolling Hills Estates
Inland=Torrance, Lomita, Gardena

Photo catalina_from_wayfarers_chapel.jpg by Carl Clark