Home Sales Volume Shrinking
Sales volume, the number of homes sold in a given area, over a given period, can change for several reasons. Lack of available inventory can result in fewer sales because a suitable home cannot be found. Inflation will increase prices, reduce the pool of qualified buyers and lower the number of sales. War makes buyers and sellers nervous about the future and hesitant to conduct business.
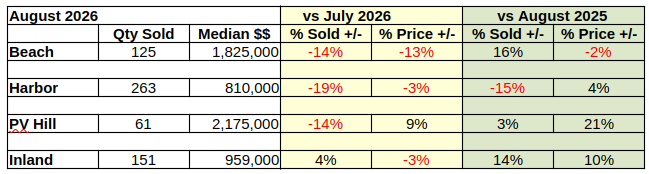
All of these factors and more contributed to a 12% decline in monthly sales across the South Bay for the month of August. As always, different markets move in different ways. While the rest of the South Bay lost sales in double digits, the Inland area grew by 4%.
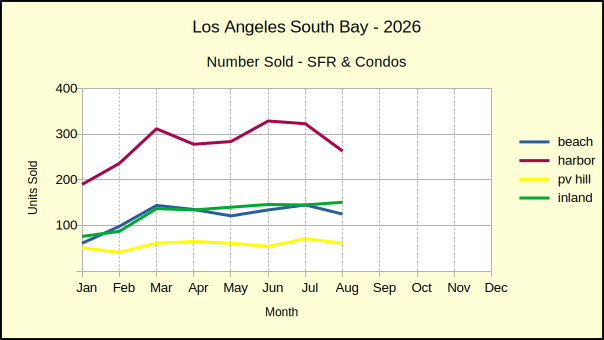
Shifting to look at August of 2026 compared to August of 2025 gives a whole new look to sales volume. Instead of dropping by 12%, sales across the region only dropped by 1%. Instead of just the Inland area growing, on a year over year basis, only the Harbor area lost sales volume, dropping by 15%.
Looking at a single month of data provides only a limited perspective. Opening up and viewing sales numbers for the year to date helps determine the direction of sales history. With eight months of accumulated sales, 2026 comes in with 3% fewer home sales than the same period in 2025. Using the broader time span also shows the bulk of the South Bay region slipping in sales volume. Only the Beach cities show positive growth of 7% for the eight month period. With the largest volume in the region, the Harbor area dropped 8% in sales. The Inland area, the second largest also fell, but by an insignificant margin, charting at 0% change.
One impact on sales volume is frequently overlooked because the cause lies back in the pandemic years. A significant number of homeowners purchased their homes when interest rates were artificially held at the bottom of the scale to help keep the economy moving. Many others refinanced at those same rock-bottom rates. Very few home owners are selling those properties. Monthly payments for them are comparatively so low they can be rented at a profit big enough to justify holding them indefinitely.
Comparing 2026 sales to 2019, the most recent pre-pandemic year, shows an 18% decline in home sales. Knowing 3% of that 18% is the current loss from 2025 hints that about 15% is holdover from the pandemic “solution” to money movement. With current mortgage rates hitting 7% interest versus around 3% for pandemic era loans a key reason for low inventory and low sales volume becomes apparent.
Home Prices Still Rising…for Now
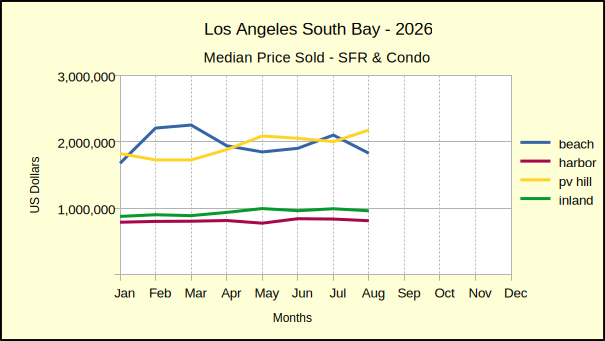
High median prices is another key reason for fewer homes selling, and ironically is a reason the artificially low inventory is finally rising. When mortgage interest rates were being used to stimulate the pandemic economy, it rapidly created a seller’s market and price wars were everywhere. Over about two years time the annual increase in median price jumped from ~7% to ~20%, before dropping back to single digits again.
The result catapulted median prices to a ~45% premium over 2019 prices as of last month. On an annual basis the median has increased at ~5% as opposed to the Federal Reserve target of 2%. The rapid increase in median price pushed a lot of buyers out of the market because of larger down payments and insufficient income to qualify for the monthly payments. Combined with the return to higher interest rates, homes sales slowed and the inventory started growing.
This year sales volume and median prices in the South Bay dropped precipitously in April. For the most part the monthly declines have been small and scattered, but the accumulated impact already shows decreases in the year to date sales volume and median prices.
The Outlook
September is bringing even higher mortgage interest rates which promise to slow home sales further. As sales slow, the inventory of available homes will increase. As the inventory grows sellers will reduce prices and accept lower offers in order to move on with life. The cycle will continue until something interrupts it.
We’re living in a volatile world, subject to change in any number of ways. Currently the economy is battered by trade disputes and border disputes across much of the world. Climate change is rampant and West Asia is on fire. None of this bodes well for local real estate. Barring total disaster, next month will bring a third quarter update. See you then.
Stats for the Detail Minded
Beach:
M-m, vol: 125, -14% med: 1,825,000, -13%
y-y, vol: 16%, med: -2%
ytd, vol: 7%, med: -2%
vs 2019: vol: -9%, med: 46%
Harbor:
M-m, vol: 263, -19% med: 810,000, -3%
y-y, vol: -15%, med: 4%
ytd, vol: -8%, med: 3%
vs 2019: vol: -25%, med: 46%
Hill:
M-m, vol: 61, -14% med: 2,175,000, 9%
y-y, vol: 3%, med: 21%
ytd, vol: -3%, med: 2%
vs 2019: vol: -13%, med: 45%
Inland:
M-m, vol: 151, 4%, med: 959,000, -3%
y-y, vol: 14%, med: 10%
ytd, vol: -0%, med: 6%
vs 2019: vol: -12%, med: 42%
Beach=Manhattan Beach, Hermosa Beach, Redondo Beach, El Segundo
Harbor=Carson, Long Beach, San Pedro, Wilmington, Harbor City
PV Hill=Palos Verdes Estates, Rancho Palos Verdes, Rolling Hills, Rolling Hills Estates
Inland=Torrance, Lomita, Gardena
Photo by Daniel Stiel on Unsplash