
There’s that moment in time where everyone stops breathing—waiting for something to happen. Right now the real estate world is holding its collective breath, waiting for the economy to do whatever it’s going to do.
Month Over Month
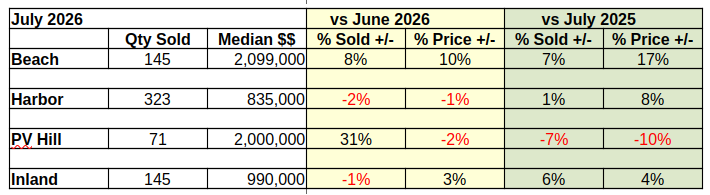
Residential real estate sales in the Los Angeles South Bay ended July with some improvements over June, and some declines. The Beach area led the field as the number of homes closing escrow climbed by 8%, accompanied by a 10% increase in the median price compared to last month.
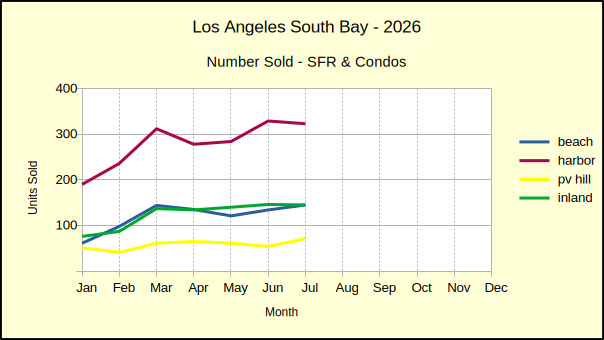
Sales volume on the Hill jumped by a startling 31%, partly driven by comparison to an unusually slow June with only 54 sales compared to 71 homes sold in July, the busiest month so far this year. The steep increase in home sales didn’t translate into a higher sales price, though. The median fell 2%,
Other monthly results were modest, ending with an overall increase of 3% more homes sold from June to July. Median prices were mixed for the month.
Same Month Last Year
Given the hyper-local arena of the South Bay, annual changes in sales volume and in median price tend to be better indicators of market direction than monthly variations. Comparing this July to July of 2025 shows a solid 3% increase in number of sales, with the Beach area up by 7% and the Inland area up by 6%. Home sales in the Harbor area, which represents roughly 50% of the sales for the region, held back at 1%.
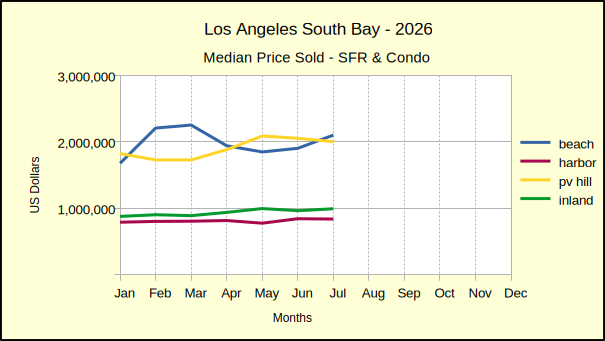
Year over year the median price climbed appreciably everywhere except on the Palos Verdes Peninsula. The PV area median plummeted 10% compared to last July. Once again the Beach area came in strong with a 17% jump in median price. The Harbor area increase in median price was more modest at 8% and the Inland area trailed with a 4% bump up.
2026 Year to Date vs 2025
Seven months into the year the number of homes sold in the South Bay is down 3% from what it was at this time last year. Basically sales volume has fallen everywhere except the Beach, where sales are up 6% year to date.
Since the pandemic the median price of homes has accelerated by phenomenal percentages. Here in the South Bay prices have increased by nearly 50% and we have become accustomed to seeing those rates of inflation. So, it’s particularly apparent when the year to date median price shows a decline.
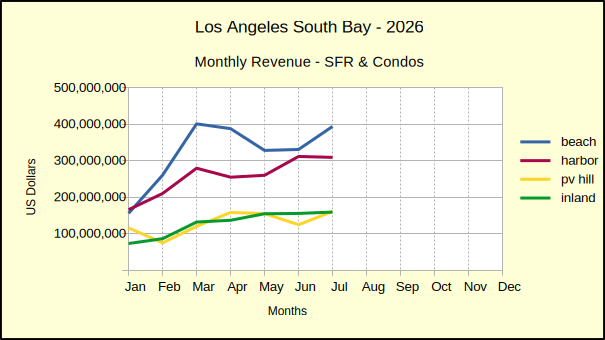
July is showing a decline of 3% for the Beach area and a 3% drop in the PV Hill area. These are the premier neighborhoods where for months prices rocketed into the atmosphere with double digit increases. Now the collected declines from across the year are bringing the median price down. The drop could be viewed as a correction—adjusting the price back down after over-shooting the mark. However, if the median price continues to slide as summer fades and fall arrives, it could be viewed as the beginning of a recession.
The Outlook
The South Bay market is definitely tamer than it was early in the year. The summer months are seeing shifts in both sales volume and median price in the single digit range as opposed to the big double digit movement of the first quarter.
The number of homes sold always slides down before the median price follows. It’s a simple thing. First buyers can’t afford to buy, then owners under pressure drop the asking price. In a normal market prices slip, the price change is absorbed and everyone goes on their way. This is not a normal market. Real estate was pounded by COVID-19, shot into price spirals with rock-bottom interest rates, then chased by a war economy.
The number of homes sold year to date is 17% below what was sold during the same period in 2019. The accumulated dollars spent on that reduced sales base increased by 59%. Judging from the market response, most potential buyers for those homes did not get a 59% increase in cash flow. It seems obvious that median prices are going to have to decline before we return to anything resembling a normal market.
Inflation is currently running at about twice what the Federal Reserve considers acceptable, and a good deal of that problem lies in the Housing segment of the CPI. The general consensus is to expect continued correction pending a change in the world economic situation.
Stats for the Detail Minded
Beach:
M-m, vol: 145, 8% med: 2,099,000, 10%
y-y, vol: 7%, med: 17%
ytd, vol: 6%, med: 2%
vs 2019: vol: -10%, med: 48%
Harbor:
M-m, vol: 323, -2% med: 935,000, -1%
y-y, vol: 1%, med: 8%
ytd, vol: -7%, med: 2%
vs 2019: vol: -23%, med: 42%
Hill:
M-m, vol: 71, 31% med: 2,000,000, -2%
y-y, vol: -7%, med: -10%
ytd, vol: -3%, med: -1%
vs 2019: vol: -10%, med: 40%
Inland:
M-m, vol: 145, -1%, med: 990,000, 3%
y-y, vol: 6%, med: 4%
ytd, vol: -2%, med: 5%
vs 2019: vol: -11%, med: 38%
Beach=Manhattan Beach, Hermosa Beach, Redondo Beach, El Segundo
Harbor=Carson, Long Beach, San Pedro, Wilmington, Harbor City
PV Hill=Palos Verdes Estates, Rancho Palos Verdes, Rolling Hills, Rolling Hills Estates
Inland=Torrance, Lomita, Gardena
Photo by Elena Takmakova on Unsplash