Sales Volume Still in the Dumps
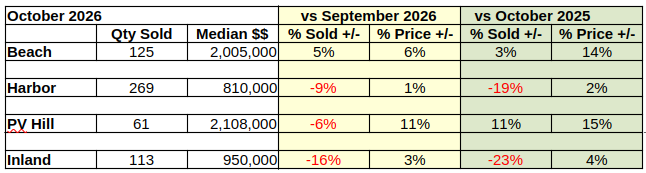
Comparing the number of homes sold in October with the number sold in September shows an 8% drop in sales across the South Bay. The month to month sales figures have bounced up and down all year in a range from down by 12% to up by 42%. This month, only the Beach area managed to stay positive, with a 5% increase over last month’s sales.
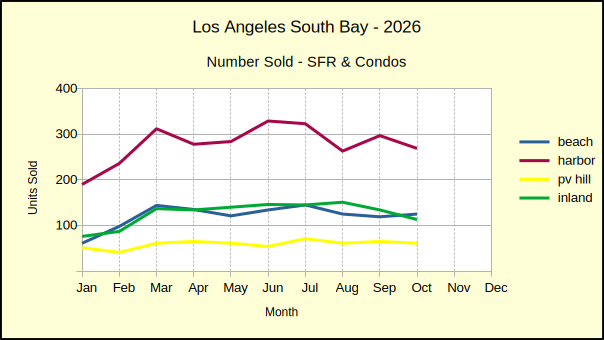
The 8% monthly decline amplifies in the year over year sales comparison. Across the South Bay, October sales were 13% lower this year than in 2025. Since the beginning of the year, the number of homes sold in the region has fallen below last year’s sales in all but three of ten months. The Beach cities have held up the best with only three of ten months reporting slower sales than last year. At the opposite end of the action, the Harbor, largest of the south bay areas in volume, only found two months of black ink in 2026 sales volume.
In fact, the year to date statistics for 2026 bear the story out, giving the Beach area 8% growth for the year compared to the same period in 2025. Otherwise, sales volume dropped 4% in the South bay as a whole. The Harbor area is down 10% from 2025 year to date numbers. The Palos Verdes and Inland sales count is off by 4% and 3% respectively.
Because 2019 was the last year of “normal” business before the Covid economic era hit, there are occasional surprises. Right now, it’s interesting to note that sales volume, or the number of homes sold for the year to date is down across the region by 18%.In other words, one out of every five sales has yet to return to the market place. The 2026 year to date home sales total is 31% higher than it was in 2019, despite nearly 20% reduction in sales.
Median Prices Show Heavy Inflation
October versus September median prices showed increases in every area. Homes sold on the Hill had the largest increase, at 11%. The Beach area came in next with a 6% gain, followed by the Inland area at 3% and the Harbor trailed with 1% price growth.
Year over year trends looked very similar with Palos Verdes registering a 15% increase, the Beach with a 14% bump up, the Inland area at 4% and the Harbor area at 2%. October is the first month of 2026 where all four areas showed an increase in the median price, whether on a monthly or on an annual basis.
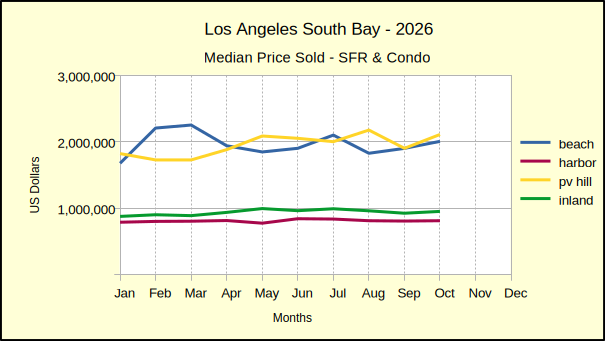
Ten months into the year finds the median price at the Beach in the negative by a minuscule .3%, The other three areas show small growth year to date. The Harbor area showed a solid 3% while the Hill came in with 2% and the Inland area rose most with a 4% increase in the median price. Year over year prices for 2025 ended with similar moderate growth—following what was first considered to be explosive annual growth in 2024. Looking more closely, the “strong increases in median price” that year obscured significant annual decreases in every area in 2023. Historically more an aberration than a direction.
The Outlook
At the moment, all indications point to another weak year not only for the number of homes selling, but also for median prices. Given the price of residential real estate has contributed to the out-sized inflation of recent years, a year of flat prices should be welcomed by buyers. Sellers and investors may be disappointed, though.
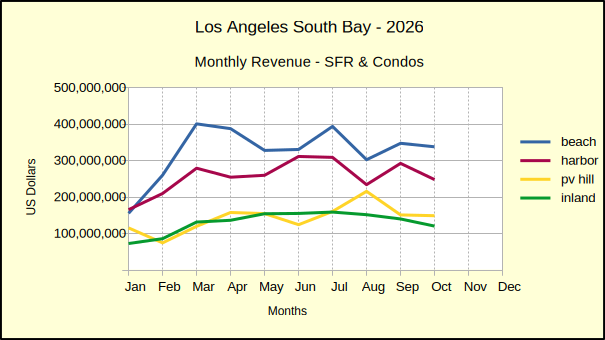
Despite the slowdown in sales volume, the inflated prices have maintained the gross revenue (and related property tax revenue). One notable trend is: the Beach cities show the least impact from falling sales. Generally speaking, the Harbor and Inland areas have been harder hit by the drop in sales volume and have experienced smaller increases in median price. Thus revenue increases have remained in the single digits while Beach area buyers have been willing to push revenue growth into double digits.
So far in 2026 the South Bay real estate market has gradually slowed. It’s still stronger than the state-wide or national statistics, so check back next month for an update.
Stats for the Detail Minded
Beach:
M-m, vol: 125, 5% med: 2,005,000, 6%
y-y, vol: 3%, med: 14%
ytd, vol: 8%, med: -0%
vs 2019: vol: -6%, med: 49%
Harbor:
M-m, vol: 269, -9% med: 810,000, 1%
y-y, vol: -19%, med: 2%
ytd, vol: -10%, med: 3%
vs 2019: vol: -25%, med: 44%
Hill:
M-m, vol: 61, -6% med: 2,108,000, 11%
y-y, vol: 11%, med: 15%
ytd, vol: -4%, med: 2%
vs 2019: vol: -12%, med: 47%
Inland:
M-m, vol: 113, -16%, med: 950,000, 3%
y-y, vol: 2%, med: 4%
ytd, vol: -3%, med: 4%
vs 2019: vol: -14%, med: 39%
Beach=Manhattan Beach, Hermosa Beach, Redondo Beach, El Segundo
Harbor=Carson, Long Beach, San Pedro, Wilmington, Harbor City
PV Hill=Palos Verdes Estates, Rancho Palos Verdes, Rolling Hills, Rolling Hills Estates
Inland=Torrance, Lomita, Gardena
Photo by Marwan Abdalah on Unsplash