A mortgage buydown is an option to pay an extra upfront fee to reduce your mortgage interest rate. They come in two types: permanent or temporary. Permanent mortgage buydowns last for the entire length of the loan, resulting in decreased interest expenses at the cost of an upfront fee. Temporary buydowns last for a specified length of time, and typically are gradually phased out over the course of the buydown period. However, it’s possible for the upfront fee of a temporary buydown to exceed the interest reduction.
The decision of whether to take a permanent buydown or no buydown is relatively simple and only depends on whether you think you can afford the upfront payment. The decision of whether to take a temporary buydown or not is more complex. At first glance, those with a higher upfront fee than interest reduction can seem like a scam — paying more now in order to pay more over the course of the loan? Seems like a terrible idea. And it would be, if it were you as the buyer paying the upfront payment. However, with temporary buydowns, unlike with permanent buydowns, it’s most often something that the buyer requests that the seller pay for as part of the negotiation process. This way, the buyer gets to pay less in mortgage interest for a short time, and the seller pays extra to guarantee that the sale goes through. And if the upfront fee is less than the interest reduction, the buyer also has the option to pay for a temporary buydown themselves if the seller doesn’t want to.
It can be very attractive to pay off your mortgage early. The reason for this is both financial and psychological. Paying down the principle means you’ll be paying less total over the duration of the loan than if you simply made the minimum payments, since interest is based on the principle, not the original loan amount. It will also give you some peace of mind to know that you no longer have any mortgage payments. But those aren’t the only factors at play, and depending on your financial situation, it may actually be better to keep making steady minimum payments.
Of course, if you can barely afford the minimum payments in your budget as-is, the decision is made for you. However, there could be reasons for someone who can afford to put a bit more towards payments to instead hold onto it. One reason is that mortgage interest payments are tax deductible. You may be paying more in mortgage payments, but paying less in taxes. Whether or not this is in your favor in your specific situation is a question for a tax professional. Another is the effects of inflation: as prices and therefore the cost of living continue to increase over time, as long as you make only minimum payments, the total amount you will have owed by the end of your mortgage doesn’t change at all. That means the amounts for payments made towards the end of the loan’s life tend to have lower value in terms of purchasing power, and may be less of an economic burden than other payments you may need to make.
The latter reason doesn’t mean much if you aren’t spending the money on something else, but there’s a good chance you should be. Savings funds, such as retirement funds, and investments both require money to be put into them to gain a profit later. If you don’t have money to invest, you won’t get any in return. Even holding onto the money can be useful, in case it’s needed for emergencies, or a very good investment opportunity crops up.
Every city in California is required to present a general plan for housing development, which is to be updated each year. The general plan must take into account housing needs based on the population and expected population growth. However, what the general plan doesn’t account for is zoning laws, which currently take precedence over the general plan. This means cities can feign considerations in their general plan while implementing zoning laws that combat their own plan. Even cities that mean well may not be able to get sufficient votes to modify their zoning laws in accordance with the general plan.
That will change beginning January 1, 2024. Under AB 821, development plans that don’t meet zoning ordinances may still pass if the ordinance they fail to meet is inconsistent with the general plan. AB 821 allows for two possible outcomes in this scenario. The local agency controlling development applications has 180 days to either amend the zoning law that is inconsistent with the general plan, or simply process the development application regardless of failure to meet zoning laws. Note that this law doesn’t actually force changes in zoning ordinances. Nothing happens to zoning ordinances that aren’t challenged by a development application designed to further the general plan, and a very stubborn local agency could simply delay processing by up to 180 days, and then possibly a further 90 days in court.
A kitchen remodel can be extremely effective at increasing both the value and the utility of your home. But it’s also costly, and if done improperly, can be a huge money sink. Too many homeowners neglect to plan their kitchen remodel adequately and end up regretting some of their choices.
Most plans to remodel the kitchen begin with the idea that something is missing or wrong with the current kitchen setup. This could be various things, such as insufficient counter space, odd direction of workflow, or not enough storage, or perhaps you just want an island and don’t have one. However, it’s important to recognize that space is finite. Whatever changes you make, you’re probably sacrificing something else to make it happen. Plan out where you are going to place appliances — both large and small — and how much storage you will need. Consider how you intend to navigate the kitchen while using it, and ensure that the path is both clear of obstacles and sensible. For example, if you fry up some eggs for breakfast every day, you’ll probably want the stove to be relatively close to the refrigerator, and if you make coffee at home, your coffee maker should be near where the coffee is stored.
Another common error is choosing the trendiest materials and colors for your kitchen. It may garner the most interest now, but if you aren’t selling immediately, it’s a mistake. Whatever’s in fashion now will probably be more expensive than other options and isn’t any more likely to stand the test of time than any past trend. Timeless designs and neutral or classic colors will always be at least serviceable.
SARAH LEE GUTHRIE Holiday Show Fri, Dec 01, 2023, 8:00 PM, Doors 7:00 PM
Sarah Lee Guthrie sings originals plus the iconic folk songs made famous by her father Arlo, grandfather Woody and their comrades in music. Enjoy holiday cider and sing-alongs.
Sarah Lee Guthrie’s bright vocals prove that she is a force to be reckoned with in her own right. Over the past 2 decades, she has continued her ancestral legacy, touching the hearts of folk fans nationwide.
She released 6 albums so far, including her 2009 family album Go Waggaloo, featuring Arlo, her then-young children and unused Woody Guthrie lyrics. The album won a Golden Award from The Parents’ Choice Foundation.
And watch for their Thursday, November 30, 6:30-9PM show at the Banana Leaf & Beach Cities Social, 1408 S Pacific Coast Hwy, Redondo Beach, CA 90277
SoCal favorites, Andy & Renee, along with their band Hard Rain, have taken their unique sound and multi-instrumental skills to venues large and small all over the world. Named, “Best of The Beach” for many consecutive years by The Easy Reader, their seventeen CD and three DVD releases have also won them countless awards. They are known for their numerous energy-packed live performances and have made a name for themselves as producers and performers of Dylanfest, an 8-hour music festival attended by hundreds of fans and featuring many of L.A.’s top musicians annually in the Spring.
As always, Jodi’s Songwriter Showcase will be held the third Tuesday of the monthat Project Barley in Lomita. NO RESERVATIONS – Get there early to get a table! Put it on your calendar for November 21!!
Project Barley serves excellent Food (Gourmet Pizza, gluten free/vegan options, wings, sandwiches, salads), wine, and award winning beer. Food served till 8:30pm. 2308 E Pacific Coast Hwy, Lomita, CA 90717 https://projectbarley.com/
The Performers
Jodi Siegel
Jodi Siegel was born in Chicago, IL. The Home of the Blues! She eventually relocated to California and began playing and singing in countless blues, R & B, pop and original music bands throughout Orange County, San Diego and Los Angeles. Over the years Jodi has opened for and or shared the stage with many respected musicians including: Albert King, Robben Ford, Robert Cray, J.D. Souther, David Lindley, Fred Tacket and Paul Barrere (Little Feat) and countless others. Her songs have been recorded by Maria Muldaur (“So Many Rivers To Cross,”-cowritten with Daniel Moore and “If I Were You”-cowritten with Danny Timms) Marcia Ball (“So Many Rivers To Cross.”) and Teresa James (“Come Up and See Me Sometime”-cowritten with Danny Timms)
Abby Posner
Abby is an award winning, multi-instrumentalist, a featured artist on both CMT and the Americana Festival this year, and has composed music for commercials, TV, Radio and movies. Touring throughout the US and beyond, Abby has built a strong, loyal following. She has opened for such artists as Phranc, Sierra Hull and Dustbowl Revival. Her style goes from Americana/Country/Folk to pop, rock and even jazz. She has a fun rapport with her audience and is very entertaining! For more information go to: https://www.abbyposner.com/
Steve Wood and Beth Fitchet Wood
Keyboardist Steve Wood and guitarist Beth Fitchet Wood have a long, checkered past in music, together and separately (Honk, Kenny Loggins, Jackson Browne, Sting, Paul McCartney, Dave Mathews and film composition). Their music expertly combines folk, pop, rock and jazz with soaring vocal harmonies and well crafted songs that are lighthearted, serious, romantic, sarcastic and always unpredictable!
Beth has recorded a dozen well received solo albums in folk, jazz, pop and children’s music genres, and produced the decade long weekly Laguna Beach Songwriters Showcase, “Beth’s Tuesdays”. Beth has also received multiple awards for her songs over the years including winning the Best Song(s) award at the Tucson Folk Festival in 2009 for “Red Red Sky” and “Peace in the Valley.” Both Steve and Beth are impossible to categorize into any one genre; they do them all! They also have a fun onstage banter and are fun to watch and to listen to! For more information on both Steve and Beth go to: http://www.bethfitchetwood.com/http://www.stevewoodmusic.com/
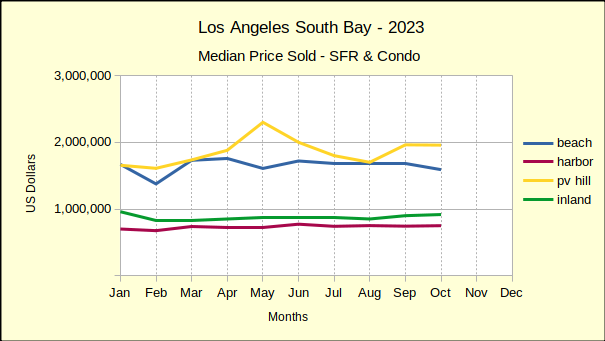
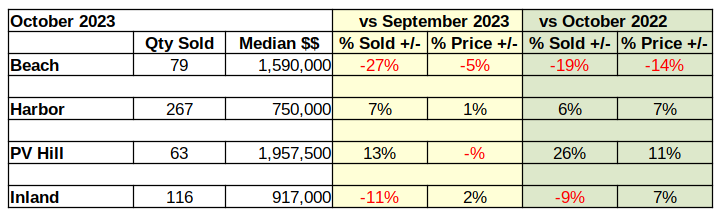
Home sales on the Palos Verdes Peninsula chalked up an impressive set of statistics in October. Comparing the October 2023 sales to October of last year showed a stunning 26% increase in sales volume beside an equally impressive 11% increase in median price. At the opposite end of the spectrum the Beach Cities October sales volume fell 19% from 2022, while the median price dropped 14%.
Elsewhere across the Los Angeles South Bay volume and prices were mixed with the general trend leaning toward decreased number of homes sold and prices struggling to stay level with last month while often slipping below.
Year To Date Sales Continue to Drop
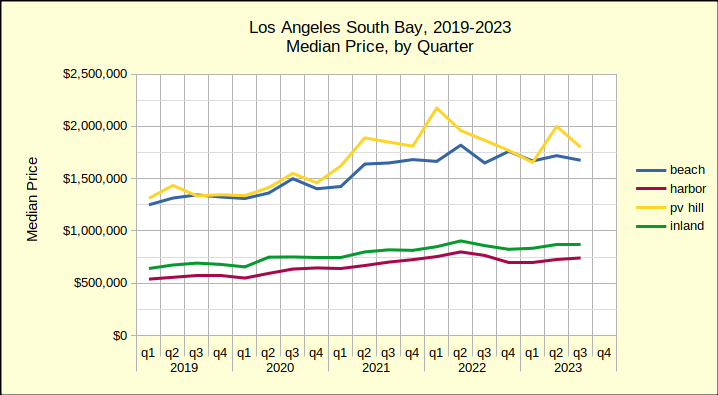
In between the highs and the lows real estate activity in the South Bay has been mixed for the months of August through October. While many commentators are cautiously hopeful, it must be noted that year to date comparisons continue to show significant declines in the number of homes sold, with an average drop of 18% from 2022 for the first 10 months of the year. Likewise, median prices are falling for the January through October time frame. For example, median prices on the Hill were up in October, but have fallen 4% year to date compared to last year. Similarly the Beach area median is down 3% and the Harbor area is off 2%.
Sales volume is clearly down. By this time in 2022 sales were at 6700 units versus 5500 this year. Many buyers have been “priced out of the market” and many sellers are resisting the idea of “prices going backward.” The result has been a lot of deals not being made.
Year to date, the deals that have been consummated are still generally at median prices above last year, however the most recent three months have shown at least half of sold homes required price reductions to make the sale. With winter setting in, we expect continued reductions in both the volume of sales and in the prices of sold homes.
Home Sales at the Beach Hit a Wall
Throughout the year real estate in the Beach Cities has maintained spotty growth. Sometimes median prices improved, sometimes sales volume. But, October brought a wall of red ink for the Beach. Month over month sales volume plummeted by 27%, while the median price dropped 5% from September when it was flat at $1.7M.
Year over year transaction volume dropped 19% from September of 2022. The median price fell 14% for the same period.
Looking at the year to date statistics showed more declines with sales volume for the first 10 months of 2023 coming in 16% below that of 2022. At the same time, the median price was off by 3%.
In prior downturns the Beach area has been among the last to respond to market negativity and one of the first to recover. If the pattern repeats, sales at the Beach will continue to show predominately negative numbers for the late fall and winter months. Most chroniclers project a return to positive market conditions in late 2025 or early 2026 in general.
Harbor Volume and Prices Turn Upward
Home sales in the Harbor area moved from all negative last month to mostly positive this month. Sales volume on a monthly basis jumped from 24% down in September to a 7% increase in October. Similarly, the month to month median price went from -1% to +1% in October.
Annually, the number of homes sold in the Harbor area increased by 6%, a significant change from having fallen 26% in September. The median price came in at $750K, up by 7%.
That’s only the second time this year the Harbor area median price has come up into the positive range when compared to 2022. Overall, the year to date median sits at $739K, 2% below last year’s number of $756K. Sales volume for the Harbor is off 20% year to date. The number of homes sold for the first 10 months is 2824, compared to 3535 in 2022.
Palos Verdes Homes Star in October Sales
Home sales on the Hill came in at 63 homes sold with a median price of just under $2M. Month over month that represented a 13% growth in sales volume and no measurable change in the median price.
On an annual basis October sales were up 26% over the same month in 2022. This year’s median price was up by 11% over last October.
While these numbers reflect impressive growth it’s important to remember that the number of transactions on the Palos Verdes peninsula is quite small, which results in some dramatic percentile shifts. For example, the annual percentage of change in the median price so far this year has ranged from a low of -29% to a high of 17%. By comparison, the Harbor area where monthly transactions number in the hundreds, has an annual range from a low of -11% to a high of 7%.
On a year to date basis, the Hill showed a more common face with the January through October sales volume down by 20% from 2022. During the same time frame median prices fell by 4%.
Inland Area Sales Volume Down, Prices Up
In a surprising turn of events, the Inland area has shown an increased median price for both the monthly and for the annual sales figures. The median price came in at $917K this October, which was 2% above the September median. On an annual basis, the median was up by 7% over the $860K of October 2022.
With 116 units sold for the month of October this year, the sales volume was 11% lower than it was this September. The monthly decline was even greater than the drop of 9% for the year over year comparison to last October.
Year to date, the Inland area has outperformed the balance of the South Bay on median price and on sales volume. For January through October there is no discernible change to the median price from 2022 to 2023. In the same time frame the sales dropped by 14%, the smallest decline of the local areas.
Beach=Manhattan Beach, Hermosa Beach, Redondo Beach, El Segundo Harbor=Carson, Long Beach, San Pedro, Wilmington, Harbor City PV Hill=Palos Verdes Estates, Rancho Palos Verdes, Rolling Hills, Rolling Hills Estates Inland=Torrance, Lomita, Gardena
In September, the share of homebuyers paying all cash was 34.1%. This is the highest it has been since the beginning of 2014, and an increase of 4.6% from September 2022. However, this doesn’t mean homes are more affordable; in fact, it’s the opposite.
While it’s true that a significantly higher share of buyers are paying all cash, there are much fewer sales overall. Total sales decreased by 23% over the past year. Compare this to a decrease of only 11% for all cash sales. Cash sales aren’t going up, rather sales overall are going down, and cash buyers are less affected.
The reason for this is high interest rates, since cash buyers don’t care what the interest rate is for a mortgage loan they aren’t getting. Interest rates fluctuate up and down on a daily basis, but rarely change by much at a time. But in this case, they hit a two decade high in September at 7.2 and then continued an upward trend into October, almost reaching 8%. As of last week, they had started to drop back down. Despite this decrease, with how erratic rates can be, that isn’t a sure sign that rates are now trending downward.
Certainly, one of the benefits of a home inspection is peace of mind that the property you’re buying or selling doesn’t have any major issues. However, some issues can be hidden even after an inspection. Home inspections are typically visual assessments by a single individual. Some things could be missed, particularly if the home is large, and problems that are difficult to see visually can easily escape notice.
If a mold, mildew, or pest problem is easily seen by a home inspector, it means the damage is already done. You’ll need specialists to detect these issues before they arise. The same is true of faults in the foundation or structure as well as environmental hazards such as lead and asbestos. There are also some things that records may show but that an inspector wouldn’t have any knowledge of without access to these records, such as outdated plumbing and wiring and unpermitted home renovations.
Halloween is upon us. If you’re expecting trick-or-treaters, you’ve probably already done all your preparations. But just in case you’re doing things last minute, or just want to check to make sure everything is okay, here are some tips to ensure trick-or-treaters’ safety so that their Halloween scares don’t become an actual danger.
While low lighting can produce the type of ambiance you may want for Halloween, it’s not a good idea. Kids can easily trip and fall, especially if your decorations require cords. Don’t use candles, either, since they are potential fire hazards. Of course, you should also make sure to keep hazards away from where kids are likely to be walking — which does include your lawn, even if you have a walkway. The risk is greater if your decorations can potentially cause jump scares, so try to avoid that type of decoration.
Tripping isn’t the only danger to kids’ health. Strobe lights and fog machines can cause seizures or asthma attacks. Pets can be a threat if not properly secured, and can cause scares if they can see the kids even if they can’t reach them. Even if you love baking homemade treats, don’t give them to kids — you don’t know what allergies they may have.
Next weekend, we have a Hard Rain Halloween Party, Saturday, Nov. 4th. We love Halloween, and we just had to have a dance party with the band! You don’t want to miss this….It’s always a great time! Dressing up is optional, but always fun!
Soulful, bluesy singer-songwriter gaining national attention for his TV soundtrack hits. His recent album, American Silence earned rave reviews from NPR Music, Rolling Stone and many more.
Dubbed “one of the most important American songwriters working today,” by 88.5 KCSN Los Angeles, Chris Pierce rose to international prominence when NBC primetime series This Is Us featured his song We Can Always Come Back To This. The single then reached #1 on the Billboard Blues chart and was nominated for several awards.
With his raw acoustic accompaniment and his unmistakably heartwrenching vocals, he aims to unite his listeners, inspiring them to rise up and stand for what is right.
Pierce was diagnosed at 15 with Otosclerosis, a rare hearing disorder that caused him to lose his hearing in one ear and become partially deaf in the other. In spite of this, his passion for music only grew and inspired him to dig deeper in his skills. Thanks to his determination, he has had the honor of performing with many incredible artists including Al Green, B.B. King, Aaron Neville and Seal, and will be on tour this fall with Neil Young
For more details see https://grandvision.org/event/chris-pierce-friends/
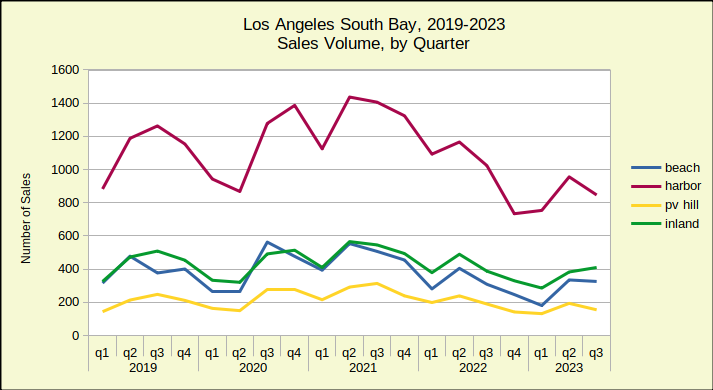
The summer selling period for real estate in the South Bay showed mixed results for August and September. July was down across the board, but both the volume of sales and the median price was able to rebound in some areas. Notably, the Beach Cities come out of the third quarter with median prices up by 2% over last August, and up by 3% over September of 2022. That growth wasn’t enough to make up for earlier this year when median prices were down by as much as 17% in year over year sales.
Year To Date Prices Down Across the South Bay
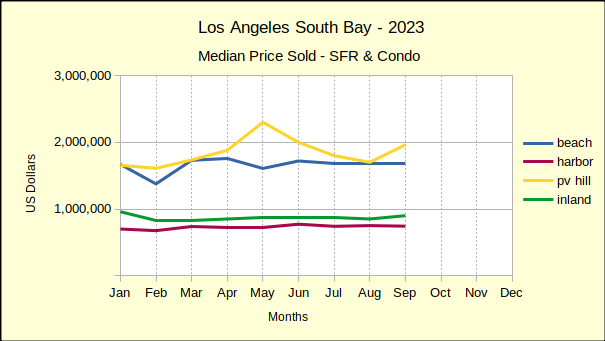
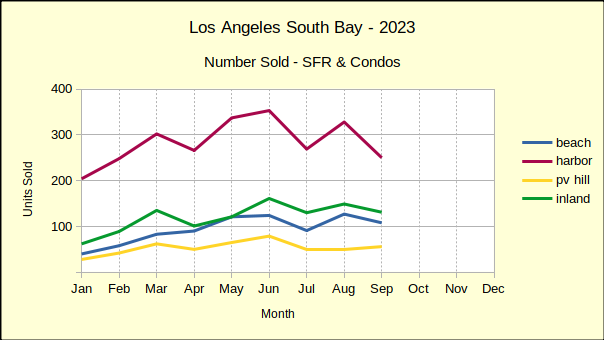
Comparing the first nine months of 2022 to the same period in 2023 shows median prices at the Beach down 2%, the Harbor down 2%, the Hill down 8% and the Inland area down 1%. Similarly, the number of homes sold dropped at the Beach by 15%, the Harbor by 22%, the Hill by 23% and the Inland area by 14%. On average across the South Bay sales volume was off by 20%.
To some extent this validates the supply versus demand theory. With interest rates above 7%, many potential sellers (who are simultaneously buyers elsewhere) have simply changed their plans. They’ll wait for interest rates to abate before trying to move. The California Association of Realtors reports that the number of homes sold across the State has fallen for 27 consecutive months. Locally, a couple of neighborhoods have shown year over year improvement a couple of times, but overall, the last time sales volume was positive across the South Bay was September of 2021, 24 months ago.
Because there are so few homes available for buyers in a must move situation, those buyers are forced to buy despite high interest rates and despite elevated prices. Mortgage interest rates are currently testing the 8% number, and are expected to stay there into 2024. Most forecasts expect the number of sales to drop even further, possibly offset by an increase in renters and a corresponding increase in rental prices.
Things don’t happen very fast in the real estate market. We mentioned earlier that sales have been declining here for 24 months already. But, prices are still up and interest rates are still climbing. Currently, we expect to see a shift in the pattern this winter. As time goes on, more and more sellers will surrender to the inevitable and lower their asking price. Coupled with an increasing number of short sales and foreclosures, that will create the key metric the Federal Reserve is looking for to quell inflation. Most pundits are suggesting 2025-2026 for the bottom of the current down-trend and the beginning of a recovery.
A Home or a House?
Are you buying a home? Are you looking for a neighborhood that matches your personality? Are you looking for schools for your children? And nearby businesses for your family needs? That’s a home. If you’re looking at the appreciation rate for the zip code and how much you can leverage, that’s a house. The difference becomes important when the real estate market is rocky. When you’re buying a home, you’re looking at time over generations. Percentages on a loan mean little then because the property can be refinanced many times before it belongs to the family.
Are you looking for a house? Are you measuring the appreciation and the cost to income ratio? Are you looking for a distress sale and a rock-bottom price. Now is the time to put your cash away. Make no mistake—cash will be required! That’s not to say you can’t finance part of your investment, but count on having “skin in the game.” Your lender will require it. Over the next twelve months, accumulate as much cash as possible, and make your broker your best friend. You want a constant finger on where good deals are happening and you want to be one of the first on the scene. The “bottom of the market” is a hypothetical point. Your best deal can be anywhere in the area and any time in the downturn. It just has to meet your investment requirements!
Beach Cities Holding Strong Over 2022
The median price of homes sold in the Beach Cities was flat for August and September, following a 2% drop in July. Coming in at just under $1.7M the month over month price has been mostly down for the first three quarters of the year. Following a similar pattern, the month to month sales volume has fallen after a strong start in early spring.
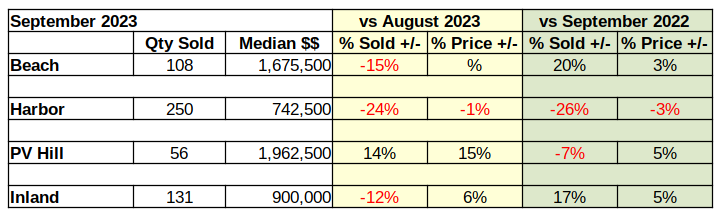
In year to year comparison, both August and September have shown a modest improvement over the same months last year. Median prices were up 2% in August and 3% in September. This improvement comes on the tail of four straight month of declining median prices. Supporting the growth in median price, sales volume was up 23% in August and 20% in September. The positive numbers at the Beach are a welcome respite following 21 months of falling volume.
Looking at year to date 2023 versus 2022, median prices are down 2% and sales volume is down 15%.
Harbor Volume and Prices Slipping
September found home sales in the Harbor area fell in all measures. On a month to month basis, sales volume dropped 24%. At the same time, median prices fell 1% below the August median.
Year over year showed the number of homes sold down by 26% and the median price down by 3% from September of last year.
Year to date for the first three quarters of 2023 sales volume was off by 22% while median prices dropped 2%.
This is a pattern we expect to see repeated again and again during the coming two years. First the sales volume declines steeply, and median prices begin a downward trend. Then as the sales volume continues to decline, sellers begin to panic and the few active buyers tighten up on the terms of their offers. The cycle typically continues until falling commodity prices and weak employment numbers convince the Federal Reserve inflation is under control. Then it will start lowering the interest rate and allow markets to float free again.
Palos Verdes Transactions Volatile
The PV Peninsula came through September with positive numbers for the month, though the annual and year to date numbers suffered some slippage. Sales volume for September came in 14% above August and the median price was a respectable 15% above the prior month.
Compared to September of last year, home sales on the Hill fell by 7%. That decline was countered by a 5% increase in median price over the same month in 2022.
Like the rest of the South Bay, PV suffered downturns in the year to date statistics. The first three quarters of 2023 ended with a 23% downward slide in home sales volume, accompanied by an 8% fall in median price.
Inland Area Sales Volume Mixed, Prices Up
The Inland area performed surprisingly well in September. Home sales in the Inland area typically mirror those in the Harbor area. Last month brought a surprise when the median price climbed 6% above August. This positive note came despite a 12% drop in sales volume.
September of 2023 compared to September of 2022 brought even more surprise with a 5% increase in median price as well as a 17% jump in sales volume.
Year to date activity for the first nine months of 2023 compared to the same time frame in 2022 fell in line with the rest of the South Bay, Sales volume fell by 14% and median price by 1%.
Beach=Manhattan Beach, Hermosa Beach, Redondo Beach, El Segundo Harbor=Carson, Long Beach, San Pedro, Wilmington, Harbor City PV Hill=Palos Verdes Estates, Rancho Palos Verdes, Rolling Hills, Rolling Hills Estates Inland=Torrance, Lomita, Gardena
The Tenant Protection Act (TPA) was originally passed in 2019, and outlines the conditions under which a landlord can legally evict a tenant. The TPA has been revised and updated in the past, and is receiving a new update with the passage of bill SB 567. The new law goes into effect April 2024, and adjusts the requirements for no-fault evictions, as well as setting the fine for a landlord’s violation of the laws at three times the cost to the tenant plus additional fines.
Under current regulations, a landlord can perform a no-fault just cause eviction if the landlord or their immediate family intends to occupy the residence, or the landlord intends to demolish or substantially renovate the residence. Under SB 567, mere intent isn’t enough. Rather than only planning to occupy the residence, the landlord or relative must have already occupied it for at least 12 continuous months as their primary residence. Demolition or renovation plans require a written notice including permits, a description of the plans, and an expected duration, as well as the opportunity for the tenant to re-rent the property at the same price if the plans don’t go through. There are other conditions under which a landlord can perform a no-fault just cause eviction, but they aren’t affected by SB 567.
It’s very common to submit late payments, for any of various types of bills or loans, including mortgage loans. Sometimes people just forget to pay. Sometimes they’re waiting for their next paycheck. Maybe some bills are more lenient on late payments than others, so they’re prioritized lower in the budget.
Whatever the reason, most people assume the only downside to a late payment is an extra fee. That’s not the case. The occasional late payment won’t have any impact, but repeated late payments do show up on your credit report. This will reduce your credit score and make it more difficult to qualify for a loan. If possible, you should make sure to pay bills on time, even for small things like phone bills.
Have a bit of extra space in your house, and wish you could use it for something, but aren’t in a position to downsize? You can rent out single rooms, even if your home is a single family residence. It can even be a basement, if it’s large enough to serve as a bedroom. That way, the extra space doesn’t go to waste, and you even earn a bit of extra income. Of course, not everyone wants strangers living in their home, so this idea may not be for everyone. But if you don’t mind or even would prefer another occupant, it’s a win-win for you.
Keep in mind that renting out a room is still renting something out, and you must still follow regulations. Read up on the Fair Housing Rules if you don’t already know them, and talk to an expert, particularly if there’s something you’re unsure about. And of course, the same guidelines apply for finding a tenant. That means being very specific with what’s being offered and what sort of tenant you’re looking for, making sure to request background and credit checks as well as references, and meeting the prospective tenant in person before signing the deal. If you don’t want them in your home before you’re sure you want them as a tenant, your first meeting can be in a public space, like a coffee shop — though keep in mind your tenant will want to see the property before they sign.
Fall may not be the single most common season to buy or sell a home, but it’s certainly one of the most common. It’s a good idea to get your home staging right for the season, because it’s not a time that you want to miss out on opportunities.
Fall makes it more difficult to set the stage, but that makes it all the more important. You’ll want to rake leaves in front of your house, because leaving them makes the area look less cared for and therefore less appealing. Shorter days in autumn mean it will get dark earlier. Make sure to amp up the lighting so people can actually see the home they’re attempting to buy. Also note that prospective buyers are likely to spend more time inside the home, as autumn weather tends to be unpredictable. Maintain a comfortable temperature in your home and highlight appealing aspects of the home’s interior. If you really want to go all out, fresh baked cookies are sure to feel cozy to your buyers.
Many people may consider hardwood floors to be the fancy, expensive option. But there’s a reason hardwood is more expensive than other types of flooring. It has several benefits that make it an excellent choice if you are planning to update your flooring.
Hardwood is one of the most durable flooring options. Vinyl and laminate floors scratch and dent easily, and the damage can be permanent. Carpet needs to be replaced frequently, and you may also need to remove it if it causes allergy issues. Even if your hardwood floor is damaged, in many cases, it can be solved with sanding or refinishing. Chances are, if the damage is severe enough to warrant replacing hardwood flooring, the same would be true if you had that sort of damage to any other type of flooring. Because of how long hardwood can last, it’s potentially a money saver despite the higher upfront cost — not to mention it also improves your home’s value when you eventually go to sell it.
With all the color and pattern options available for vinyl and carpet flooring, it may seem like hardwood is the boring option. It doesn’t have to be. Hardwood is also available in several colors, textures, and grain patterns. Granted, the available colors are mainly various shades of brown. But the neutral tone makes it easy to accent with rugs and decor that can be exchanged at low cost whenever you want a change.
You may have been told that a listing is contingent or seen a list of contingencies. But what is a contingency, exactly? A contingency is a condition that, only if met, causes a transaction to proceed as normal. It’s a way to protect both the buyer and the seller in case something goes wrong. It both assures the seller that the transaction will go through as long as the condition is met, and may enable the buyer to renegotiate or back out if it isn’t met.
Not every contingency is something the seller can necessarily provide, though, so it’s never a guarantee of a successful transaction. There are several types of contingencies. There is one that the majority of sellers can meet without any effort, and that is a title contingency. This specifies that the seller must be able to demonstrate that they have clear title to the property. In most cases, this isn’t difficult, but things such as inheritance could complicate this. A couple types of contingencies relate more to the buyer. These are financing contingencies and sale contingencies. Transactions with financing contingencies are contingent on the buyer being able to acquire financing. Sales contingencies refer to the sale of the buyer’s current property. This is normally used when the buyer is reliant on funds from the sale of their home in order to afford the new home. The last two common contingencies rely on a third party, an inspection contingency and an appraisal contingency. As the name might imply, these make the transaction contingent on a successful inspection and an appraisal at or above the purchase price respectively.