This is a once a month (every third Tuesday) show that is designed as a listening room for world class songwriters, to play their original music in an intimate setting. NO COVER BUT DONATIONS ARE STRONGLY ENCOURAGED AND GO TO THE SONGWRITERS. Project Barley serves excellent Food (Gourmet Pizza, wings, sandwiches, salads), wine, and award winning beer. Food served till 8:30pm. No reservations so arrive early to get a table. This month we are proud to present: David Serby/Ed Tree, Nick Justice/Richard Stekol, Jodi Siegel and Barley Unplugged!
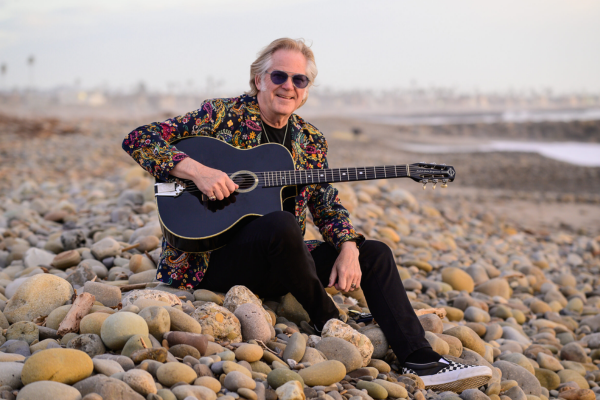
DAVID SERBY (w ED TREE))
The Southern California-based country-rocker David Serby has made a name for himself with his evocative, gritty portraits of SoCal life that are both personal and universal. The LA-native has a unique perspective because he spent much of his childhood in a small farming town in Illinois before returning to Southern California as a teen.
Serby doesn’t shy away from Southern California’s many warts, as he demonstrates throughout his upcoming release, Low Hanging Stars. The record’s roadhouse rockers, country shuffles, and south-of-the-border two beats, are populated by a cast of maybe not quite losers, but certainly too lost to find the winners circle down-and-outers, and it is full of the clever word-play and heartfelt and introspective lyrics for which he is known.
This will be Serby’s sixth record with producer/guitarist Edward Tree. His previous, critically acclaimed releases include I Just Don’t Go Home (singer-songwriter); Another Sleepless Night and Honkytonk & Vine (roadhouse honky tonk); Poor Man’s Poem (folk); and The Latest Scam (rock).
Serby’s influences include the classic country artists played by his father on the family hi-fi- Roger Miller, Marty Robbins, Johnny Cash, Willie Nelson and other Nashville stars – as well as the edgier country rockers discovered by Serby as a Southern California teen – The Blasters, Dave Alvin, Rank and File, X and Dwight Yoakam to name a few.
Serby has remained an active member of the vibrant Southern California roots music scene for the last twenty years, and he has twice played the Palomino Stage at the Stagecoach Festival in Coachella, CA, opening for among others, Willie Nelson, Lucinda Williams, The Old 97’s, Robert Earl Keen, Kris Kristofferson and Rodney Crowell.
NICK JUSTICE (w RICHARD STEKOL)
Nick Justice hails from the Bronx, NY. He came out west in 1980 and fronted a few bands (Guns for Hire, Nick Justice Band, Chords of Fame) in the emerging cow punk era in southern California. Playing on bills with the Blasters, X, The Plimsouls, The Go Go’s, The Beat Farmers and The Bangles who were all going somewhere while he was going nowhere Justice fled to the Northwest living in Seatlle for most of the 90’s playing throughout the Northwest as a traveling troubadour for a decade mostly playing coffee houses, house concerts and juke joints. Justice came back to LA in 200o and quit the music business but never stopped writing. In 2015 he called up a few old friends like Greg Leisz, Bobby Cochrane and put out and EP “The Cry of the Street Prophet”. 4 records quickly followed in succession including 2019’s critically acclaimed “The Road Not Taken” with Richard Bredice (Jules Shear, Fallout Boy, Missiles of October, David Lindley) at the helm producing all 4 records. Justice’s newest release “Rope the Wind” charted at #1 on the Roots Music Report Top 50 Folk Rock Album Chart in April 2021.
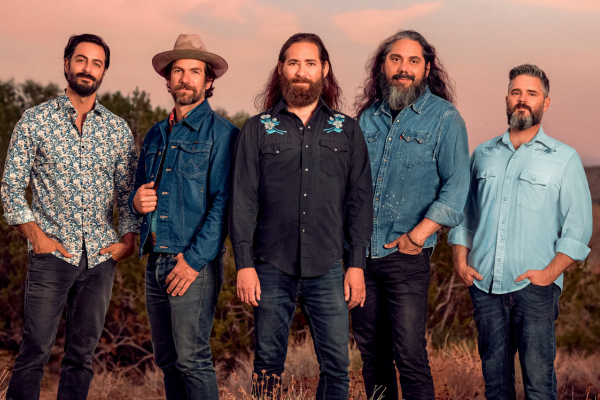
BARLEY UNPLUGGED
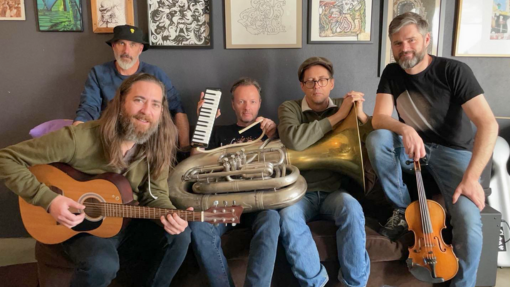
Barley is feel good Americana band with a beach country vibe. Barley, who’s fearless leader lead singer/trumpet players and songwriter, Brent Reger, is also one of the owners of the three Barley Breweries located right here in the SouthBay. Barley, is a band of music brothers, with excellent harmonies, cool songs and seasoned musicianship! “It’s more of a family than a job. It’s not a job for us. We enjoy it and we have a good time together,” said Reger. There’s a lot of them in the band, eight to be exact: Brenton, Chris, Jason, Jay, Nate, Russ, Rusty, and Stephen. This band has stuck together for 10 years, playing all around the beach cities.
“Everything happens at the beach. We love the South Bay,” said Reger. Some of the members are from the South Bay and the rest have been here for years. It’s where they draw their inspiration from. Barley writes and performs their own music. Their sound they say is similar to the Beach Boys.
“Our music encapsulates that beach vibe. It’s a little folky. It’s a little beachy,” said Reger. They normally play with their full band – drums – guitars, bass etc….but for a few special shows, they do an unplugged type show where they sit on stools, and play and sing their songs accompanied by acoustic guitars. You can really hear the lyrics and their beautiful harmonies.
JODI SIEGEL
Jodi Siegel, originally from Chicago, IL, is a singer, songwriter and guitarist. Over the years Jodi has opened for and or shared the stage with many respected musicians including: Albert King, Robben Ford, Robert Cray, J.D. Souther, David Lindley, Fred Tacket and Paul Barrere (Little Feat) and countless others. Her songs have been recorded by Maria Muldaur, Marcia Ball, Tommy Ridgley and Teresa James.
She has recorded two CD’S; Stepping Stone and her latest CD, “Wild Hearts,” produced by Steve Postell (Immediate Family, David Crosby, Eric Johnson, Robben Ford, Iain Matthews), is filled with great songs, cool grooves, intimate, smart lyrics and some of the best of the best musicians in Los Angeles today including; Mike Finnigan (organ, piano), Hutch Hutchinson, Abe Laborial Sr., Alphonso Johnson (bass), Russ Kunkel, Michael Jerome Moore, John Ferraro, Arno Lucas (drums, percussion), Joe Sublett (Saxophone) and Maxayne Lewis and Clydene Jackson (background vocals). Each song has a soulful delivery with an undeniable down-home elegance. It has received great reviews by Patrick Simmons (Doobie Brothers), Maria Muldaur, Walter Trout, David Mansfield (T Bone Burnett), Leland Sklar, Mike Finnigan and Doug Macleod to name a few.