The fall musical program at the Grand Annex starts this month. Don’t miss some of these great shows. And, there are more at this link: https://grandvision.org/grand-annex/


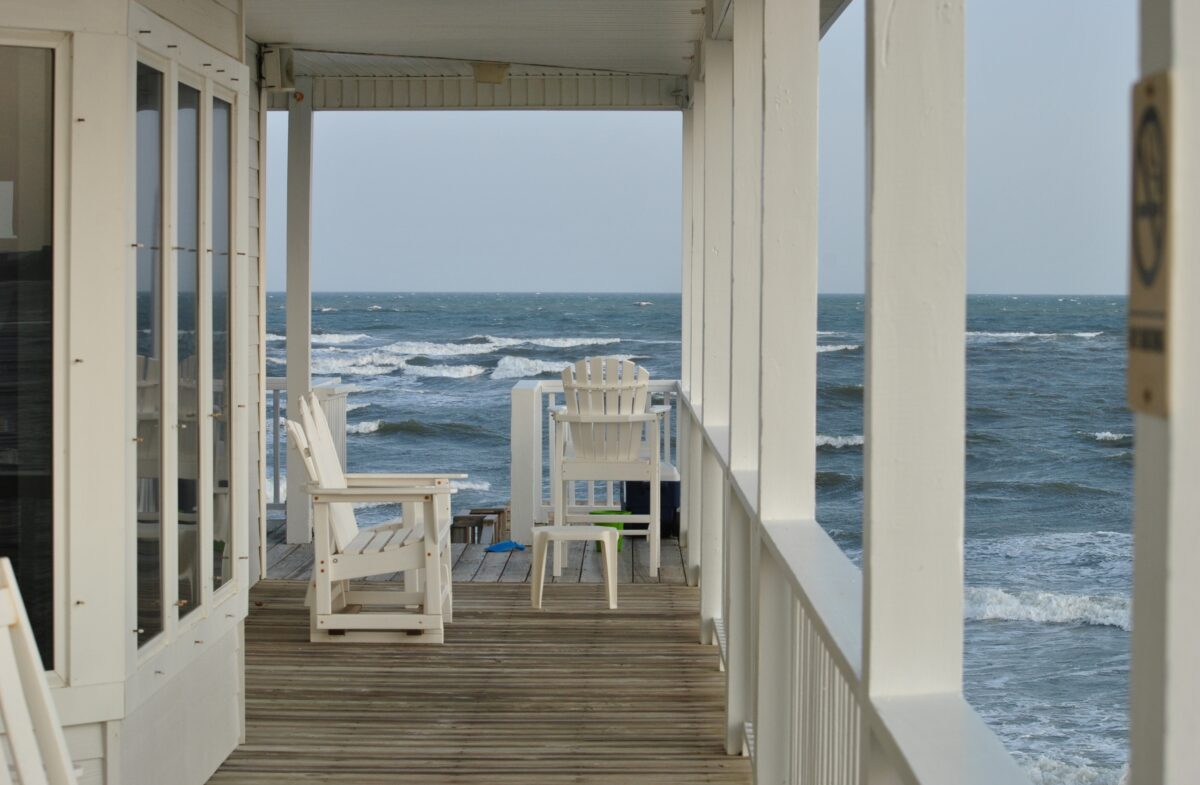
Sounds of Real Estate at the Beach
The fall musical program at the Grand Annex starts this month. Don’t miss some of these great shows. And, there are more at this link: https://grandvision.org/grand-annex/
In August the South Bay real estate market showed some slowing of what has seemed a continuing slide into negative numbers. Closed transactions showed a partial recovery from the July report of declining sales and declining values, across both the past month and the past year.
August showed positive growth over July in sales volume except for transactions on PV Hill. Median prices compared to July were down except at the Harbor.
Annual statistics were similarly mixed with notable increases in sales at the Beach and Inland areas. Median prices compared to August of last year with modest increases in the Beach Cities and Harbor Area.
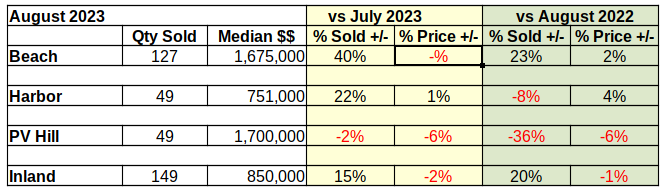
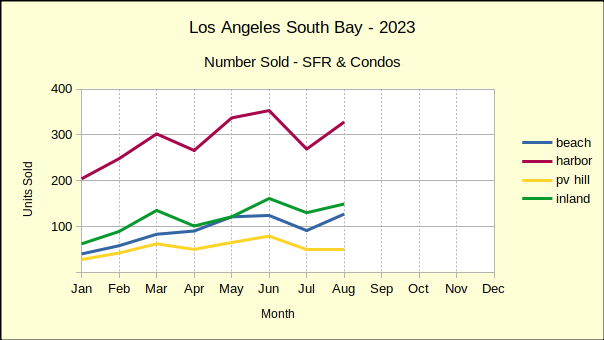
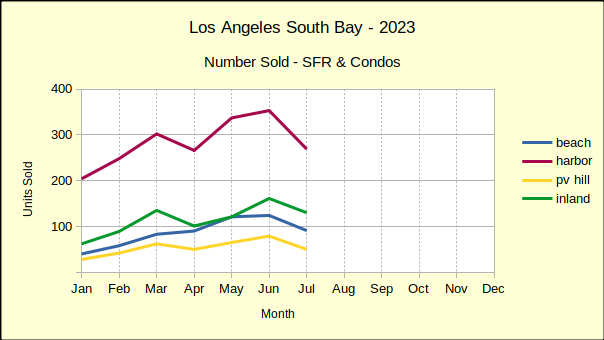
Sales volume at the Beach seemed surprisingly strong, however a look back in history reveals weaker than normal sales in July of this year and August of last year. The 127 units closed in August was much more in line with expectations, than the 91 sold in July or the 103 sold in August of 2022. Sales in a normal year would come in at about 125-135 units, showing that the Beach Cities are currently close to a normal number of transactions for the month.
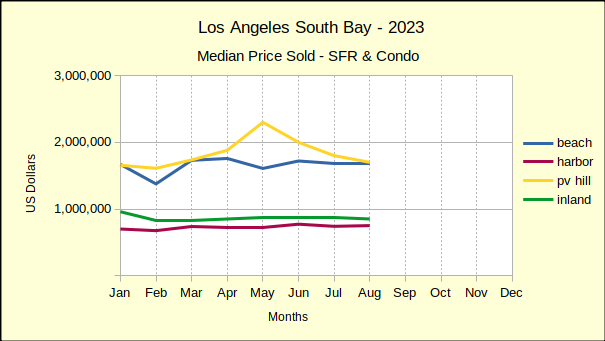
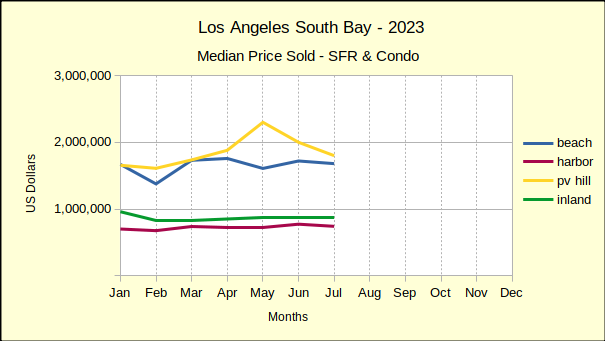
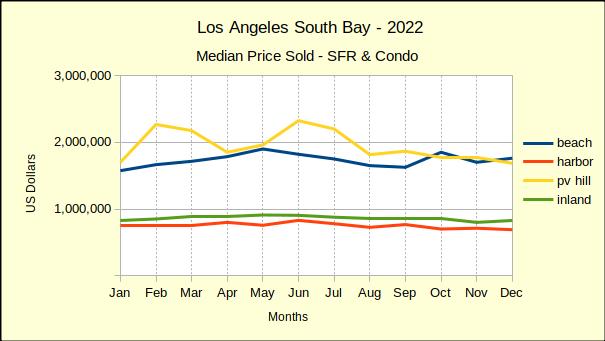
Median prices came in negative compared to July, though less than a 1% drop. Last year’s weak sales led to an increase of 2% in median price this August, despite an overall downtrend for the year. Hypothetically, assuming the Federal Reserve policy of 2% growth, median price at the Beach should have been about $1.62M in August. As the market stabilizes from the pandemic, the median has steadily dropped from a high of $1.76M in April to the August actual of $1.67M..
Year to date transactions showed a continuing decline in sales volume (-19%) and median price (-4%) versus 2022. Likewise, sales volume was off 31% compared to the baseline year 2019. Median price is still coming in positive compared to the baseline, up 28% from 2019.
Looking at August versus July of this year shows Harbor area sales volume up a healthy 22%. While the month over month numbers are positive, sales are off 8% compared to the same month last year. For perspective, note that in 2019, the last normal year of business, there were 436 homes sold compared to 328 this August. Using that reference point, monthly sales are off by 25%.
Median price for last month was $751K, up 1% from July and up 4% over August of last year. Going back to 2019, the median was $575K, giving the current median price an increase of 32% over our baseline year. At the same time, the high median for this year was in June at $772K, and the lowest was $675K in February.
Year to date, the number of homes sold at the Harbor is down 22% from last year and likewise 22% from 2019.That decline in sales volume is driven by the increased median price which is up 32% compared to the first eight months of 2019. Being generally an entry level market, the Harbor area has shown a drop in sales every month of this year. Likewise, the year over year median price has dropped every month until August.
Sales and median prices were mixed everywhere in South Bay except for the PV Hill. All the statistics for August went down on the Hill. Month over month saw a drop in sales of 2% and decline in median price of 6%. Both are modest changes by comparison to most of the South Bay, but are indicative of the direction of the market in general.
Looking at August of last year compared to August of 2023 shows a dramatic decline of 36% in sales volume. Closed escrows dropped from 77 units last year to 49 this year. Annually, median prices dropped 6%, the largest drop of the four areas.
It’s important to note that in 2019, which being the most recent ‘normal’ year of business, August saw 90 units sold on the Palos Verdes peninsula. Monthly sales volume has dropped off by nearly 50% from the reference year.
Year to date through August shows sales volume down 25% from last year, with median prices falling by 10% over the eight month period. Comparing to 2019 year to date volume is off 21%, while median price comes in at 32% above the 2019 figure.
The disparity created during the pandemic is gradually leveling out as the year goes on. Palos Verdes median prices have fallen six out of eight months this year. The same has been true of the balance of homes sold in the South Bay.
From July to August transactions in the Inland area climbed 15%. Simultaneously, median prices fell by 2% for the month. January kicked off the year with a 16% increase in the median price. February saw that pricing promptly reverse and fall 14%. Since then sales volume has gradually dropped each month and median prices have shifted into a pattern of decline.
Year over year pricing numbers are nearly identical with a 15% jump in median price for January, followed by dropping prices every month since. Similarly, most of 2023 has seen falling sales for homes in the Inland area. So far, August has been the only month with growth in closed transactions.
Year to date statistics compared to 2022 have been much the same with the number of homes sold dropping by 17% and the median price down 2%. In keeping with the rest of the South Bay, comparisons to 2019 reflect sales falling 18% while the median price remains 32% above what it was before the pandemic.
The number of homes being sold has consistently fallen this year. Likewise, the median price of sold homes has generally been falling since the beginning of the year. The driver behind this has clearly been mortgage interest rates rising from under 3% to over 7% in a matter of months. The Federal Reserve managers have been very upfront about continuing these rates into the foreseeable future.
Most estimates state that about one third of potential buyers can no longer afford to continue with their purchase plans. We see a continued decline in the median price, as sellers find it impossible to sell at the price points reached during the pandemic. When ‘’time on market’ increases without a sale, sellers who ‘must sell’ will gradually lower prices.
Polls are showing those who aren’t compelled to sell are finding it hard to let go of mortgage interest rates below 5%. This reluctance, combined with the sliding median prices, will contribute to more stagnation in the market.
Photo by Carl Clark
South Bay’s favorite folk-rockers open the new Grand Annex season September 16, 8pm, with their phenomenal homage to Carole King and her album, Tapestry. This promises to be an outstanding show, led by the unforgettable playing of Andy Hill and the sumptuous voice of Renee Safier. For tickets to see and hear the performance, go to https://grandvision.org/event/andy-renee-hard-raintapestry-tribute-to-carole-king/.
Andy Hill and Renee Safier with their band Hard Rain have been referred to as “America’s best kept secret.” Performing over 200 shows a year, the band delivers a style of Americana folk-rock that’s thoughtful, musical, danceable and full of memorable hooks. The duo are also behind “Dylanfest” the day-long music festival, now in its 33rd year, celebrating the music of Bob Dylan and featuring over 70 of L.A.’s best musicians.
With 17 CDs and 3 DVDs in their pocket, Andy & Renee have won countless awards, including “Americana Group of the Year” by the LA Music Awards, “Best Duo/Group” at the International Acoustic Music Awards and a Regional Emmy for their PBS concert special “Black Box Opens – Andy & Renee.” Their relatable lyrics, unforgettable melodic content and tightly crafted arrangements have brought together fiercely loyal audiences up and down the West Coast in the US and Canada.
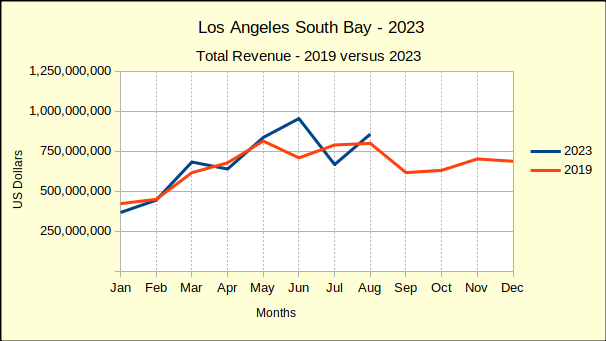
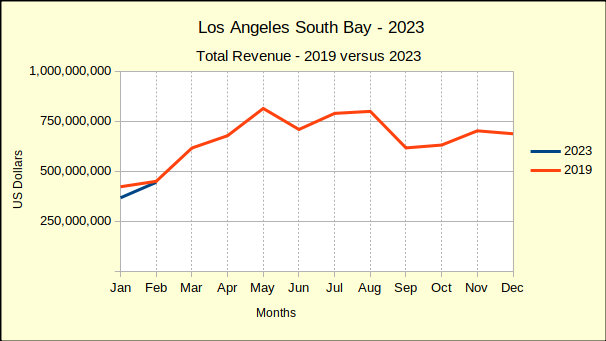
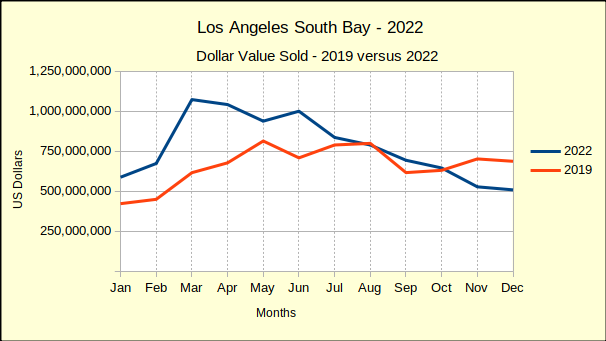
Year to date through July, the gross revenue for South Bay is a mere 3% above that of 2019. At the same time, sales volume, the number of homes sold, is 23% below the sales of 2019. By most standards, 2019 was the pinnacle of real estate business prior to the turbulent years of the Covid pandemic.
Many sources compare current business to that of the pandemic years, partially because it’s easy and partially because the “numbers look better.“ Undeniably, the statistics do look more favorable, however, this analysis takes comparisons beyond the normal “last month” and “same month last year” to include 2023 versus 2019. This allows our readers to see 2023 in a historical context and to more readily recognize the unfolding recession.
While median prices are still above those of 2019 right now, we project the median prices will also drop below the 2019 level before this recession ends. On a month to month basis, prices are falling approximately half the time. On a year to year basis, 2023 prices have dropped below 2022 medians 82% of the time. Median prices for June and July of 2023 fell below 2022 in all four areas both months. Buyers and sellers should anticipate the bottom of the recession in late 2024, or possibly 2025. Normal growth should return in 2026.
The July report from the Federal Reserve Bank (Fed) notes that inflation is expected to continue above the target of 2% through 2025. Accordingly, the Fed efforts to “restrain” the economy (meaning increase interest rates) will continue into 2025. The report indicates that while housing costs are slowing, they continue to increase at inflationary levels, necessitating further reduction.
In the meantime, buyers who are financially able should plan to acquire desirable properties at substantially better prices than will be available after recovery begins. Sellers who anticipate a need to sell before the economic turn-around, should look toward selling sooner rather than later, to minimize the impact of the down-trending market.
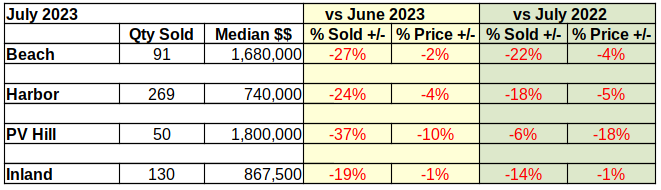
From June to July the number of homes sold in the Beach Cities fell 27% and those sold for a median price of 2% less. Some of the decline in sales is attributable to fewer homes available, as sellers hold properties off the market in hopes of improving conditions. Even more is a result of buyers who have lost significant purchasing power as mortgage interest rates have rocketed to over 7%.
Compared to July of 2022, the number of homes sold this July dropped 22% with a decline in median price of 4%. This set of statistics is somewhat deceptive in that last July the real estate market was still in the early stages of the downturn. As the current year progresses, year over year figures will demonstrate the slide more clearly.
Comparing the first seven months of 2023 to both 2022 and 2019 (the most recent year of business not impacted by the pandemic) shows the drift of sales and prices. The number of homes sold fell 24% from 2022 (802 homes) to 2023 (607 homes), while it was down 35% from 2019 (930 homes). The Fed dropped mortgage interest rates to essentially zero during the pandemic to keep the general economy afloat, which resulted in rapid price escalation which ultimately made purchasing a home unaffordable for about 25% of potential buyers. Then to control the resulting inflation, the interest rates jumped up around the 7% mark, which further slowed the real estate market by “pricing out” another 10-15% of buyers. With fewer buyers and stagnating prices, sellers are reacting by pulling property off the market and delaying planned sales.
Median prices fell 4% from 2022 and are still 28% above the median price of Beach Cities homes in 2019.
Sales volume in the Harbor area has held up better than the Beach, possibly because median price has taken a greater hit. On a monthly basis, 24% fewer homes were sold (269 in July versus 353 in June). Comparing July of 2023 to July of last year, only 18% fewer closed escrow (269 versus 329).
Generally being an entry level market, the Harbor area tends to react faster to changes in market condition. More upscale neighborhoods frequently “stick to the price” for a longer period of time when markets are declining. Month to month median price dropped 4% in July to $565K. For July of 2022 versus July of 2023, the median fell 5%, from $780K to $740K.
Year to date through July, sales volume was off 24% from last year. Median price was down 4% when compared to the same period in 2022. Looking back to 2019, the number of homes sold during the first seven months of 2023 dropped by 21%. Median price for the same time frame shows up at 32% higher than 2019. Given the median price dropped 4% over the past month (from $772K to $740K), it’s reasonable to project the Harbor area median will end the year near $600K, as it was in 2019.
Month over month, the number of homes sold on the PV Hill fell from 79 units in June to 50 in July, a decline of 37%. At the same time, the median price dropped 10%, ending the month at $1.8M. This despite a high sale of $12.5M, up from the high of $10M in June.
Year to year, July volume dropped 6% from 53 units in 2022, while median price plummeted 18%, from last year’s $2.2M. Palos Verdes is a unique community with large homes on large lots, many of them highly custom. Combined with the small overall number of homes, these properties truly need to be assessed on an individual basis for realistic projections.
Comparing cumulative sales data for January through July, volume is down 23% and median price is down 17% versus last year. Going back to the stable year of 2019, the number of sales is down 16% while the median is up 34%.
Interestingly, if the Fed’s annual 2% inflation target is added to the years between 2019 and 2023, the median on the Hill would be $1.5M today, instead of $1.8M. Under those circumstances, it would only take a decline of $300K to erase all gain from the past three years. Not a comforting thought for anyone who purchased recently.
The Inland area typifies a classic “middle of the road” performance in the real estate world. Generally the homes are everyday family properties, the sales trends are at the middle of the current South Bay market, and everything seems to happen with minimum drama. So there is little surprise at the minimalist 19% decline in monthly sales volume, the lowest of the South Bay. Likewise there is no shock the Inland cities came in with the lowest monthly price decline, a mere 1% below June.
Similarly, the annual sales volume showed July of 2023 only 14% below last July and the median price just 1% below the same month a year ago.
Year to date for the first seven months of 2023 compared to 2022 looks much the same. The number of homes sold dropped by 22%, 799 in 2023 versus 1021 last year. The median price fell 2% to $868K from $883K. Looking back to the 2019 sales volume for the same time period, the Inland area is off by 18% for the current year. Much like the rest of the South Bay, the median price in 2023 ($868K) remains above that of 2019 ($662K) by 31%.
Photo by Alexander Simonsen on Unsplash
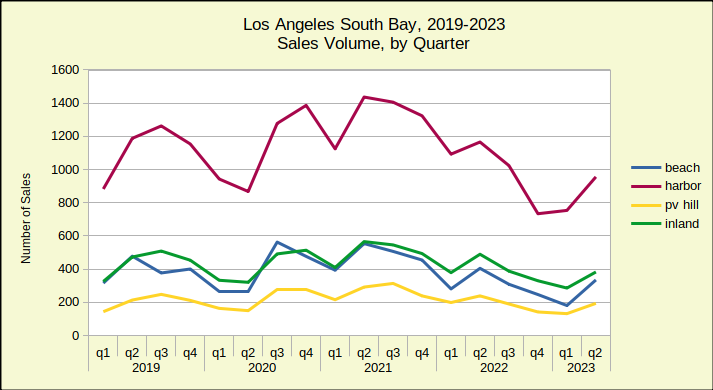
The number of homes sold in the Los Angeles South Bay during the first six months of 2023 is the lowest sales volume for a first half in the past five years. Fewer homes have been sold since the new year than sold during the same period of the worst year of the pandemic.
The first half of 2023 has ended with 24% fewer sales than the same period in 2022, which was itself down 15% from 2021. The peak of the market was early 2021, when interest rates were among the lowest in history, exploding the number of potential buyers. The lowest sales volume was during 2020 when 3311 homes were sold, which was still greater than the 3221 sold the beginning of this year.
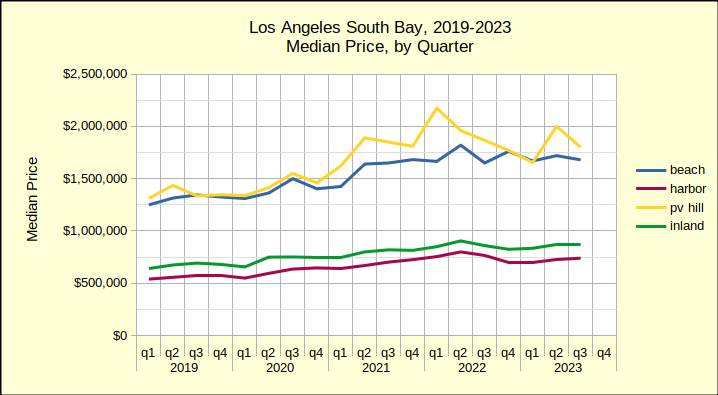
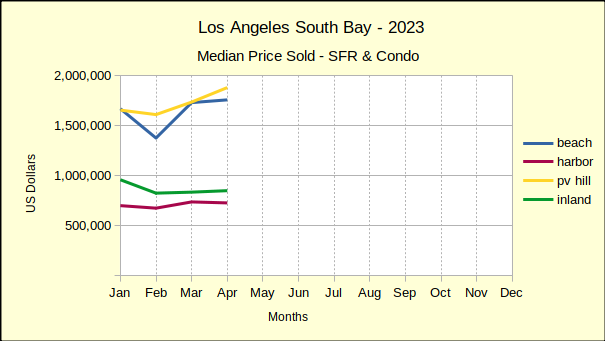
Coming right on the heels of the sales volume collapse is a drop in the median price. Prices today are down from where they were in 2022, which was the peak of the recent market. The chart below reflects the median price for the first and second quarters of the past five years. Typically, the first quarter is the slowest, with the number of sales increasing through the second quarter and then slowing again for the third and fourth quarters. Here the growth from Q1 to Q2 shows and we can see the change from year to year.
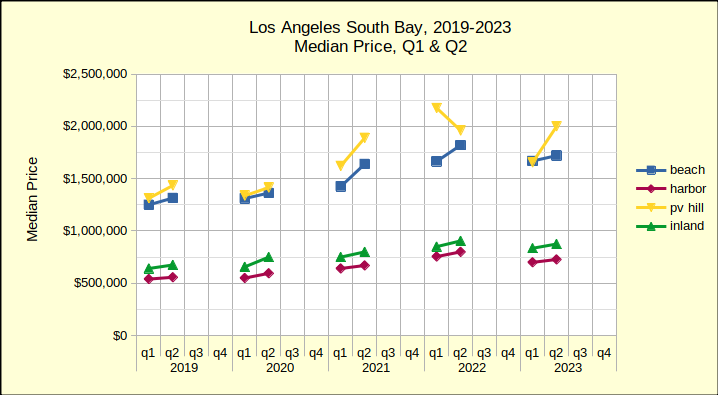
As always, bear in mind that the Palos Verdes Hill offers a comparatively small sample size, so a couple of significant sales can shift the plot lines dramatically on a chart. The chart above shows one such anomaly where PV the median price actually declines in the second quarter.
Looking across the years from 2019 all four areas show the same upward movement in median price until the second quarter of 2022. Then, comparing it to the second quarter of 2023, we can see the trend shifting downward. For example, the Beach Cities median fell from $1.82M in the second quarter of 2022 to $1.72M in the second quarter of 2023. The weakness in median prices is driven by increasingly steeper mortgage interest rates. Barring a change in market dynamics, anticipate this line turning into a steeper downslope for residential prices starting in winter of 2023/24.
The market is clearly taking a downward turn. Sales volume is off, median prices are turning down. Sellers are not putting properties on the market. Buyers aren’t buying. The few forecasters willing to make a guess this early are saying real estate won’t come back until 2025, possibly 2026. For those who are “waiting for the bottom of the market,” remember that by the time you read it in the headlines—you’re too late—the bottom is gone.
Median prices at the Beach have fallen 5% from last June, coming in this year at $1.72M, an even $100,000 below June of 2022. Year to year sales for June are down 7% from last year, at 124 units compared to 133 in June of 2022.
Month over month statistics have been highly volatile since the beginnning of 2023. Interest rates and prices have changed erratically, making short term forecasts nearly impossible. Month to month sales volume has bounced in a range from 2% to 45%. In just six months, monthly median prices in the Beach Cities have ranged between -18% and 26%.

Year to date sales volume at the Beach is down 25% from last year and is off a full 35% from 2019.
The year to date median is down 3% compared to 2022, though it is still 32% above the median in 2019.
Despite market conditions, homes in the Beach Cities remain highly desirable. For June, 78% of sales transactions closed within 30 days of listing and sold for 2.61 % above asking price. Beach homes also offer a great deal of diversity. June sales showed a 19 million dollar range between the low sale at just over $500K and the high sale at $19.5M.
Year to year-same month sales in the Harbor area have been negative since the first of the year. Prices were still holding up in June of last year, but sales volume had been dropping through all of May and June. As a result, the number of homes sold dropped a mere 1% coming into June of 2023. That looks good until compared with the year to date decline of 24%.
Market conditions in the Harbor last year gradually changed from joy for rock bottom interest rates at the beginning of the year to caution as sales tapered off and sales figures stated taking a hit. Median prices for June of the current year have fallen 7% from the June 2022 median of $830K.
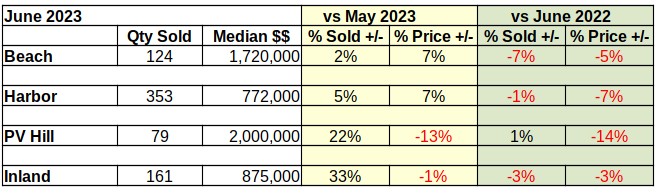
Until now, the Harbor area has shown mixed results in the month over month statistics. For June compared to May sales volume was up by 5% (353 versus 337), while median price was up 7% ($772K versus $720K). Like the Beach Cities, the Harbor Area is following a more normal upward swing from the winter doldrums into the spring selling season.
That upward swing is not expected to go very high or last very long. At 1710 homes sold, year to date sales volume from January through June is down 24% versus 2259 sold in 2022. Sales volume is likewise down 17% from 2071 during the same six months in 2019. The variance in monthly sales is expected to drop into the single digits starting in July.
Median prices are down 4% compared to 2022 though still up 33% versus 2019. (Note: Using The Federal Reserve’s “target inflation rate”of 2% annually would have put the Harbor area median price increase at a little over 8%. That implies an “excess growth” of about 25% in median price during the pandemic buying splurge. Much of that difference, if not all of it, is expected to disappear over the next 18 to 24 months.)
June sales detail shows 77% of sales closing escrow within 30 days. Buyers were still bidding up, with the sales price exceeding the list price by 2.61%. The highest sale recorded in June for the Harbor was $4.25M; while the lowest was $527.5K.
Palos Verdes, contrasting May versus June of 2023 shows a 22% increase in the number of homes sold for a monthly total of 79. At the same time, the median price dropped by 13%, falling to $2M even. Expectations for month over month statistics include fewer sales and more aggressive price reductions as 2023 wears on. The summer and fall months are projected to have weaker home sales, both in volume and pricing, as interest rates increase and buyers and sellers who “must move” run out of options.
Year over year same month sales, showed a volume growth of 1% (one sale), accompanied by a 14% drop in median price from $2.3M. That 1% increase is the first time in 2023 that any of the areas has shown positive growth in the number of homes sold. As such, and knowing that the PV Hill is considerably smaller that the other areas we measure, readers are cautioned about the wide swings in PV statistics.
Sales volume for the first six months of 2023 is down 26% compared to 2022 (326 homes in 2023 versus 438 in 2022. Similarly, sales are down 9% from 2019 when sales of 358 homes were recorded. Median prices of $1.8M for the same period are down 13% from 2022 prices of $2.1M and up 36% from $1.3M in 2019.
Market time has remained good, with 75% of sales closing withing 30 days. Sellers have enjoyed selling prices 2.3% higher than asking prices, a trend expected to disappear before the end of summer. Once again showing the range of homes available in the South Bay, the high sale in PV was $10M while the low was $610K.
Sales volume of 161 homes in the Inland Area for June was up 33% over sales of 121 in May. With 33% more activity came a 1% reduction in median price, which fell to $875K after reaching $880K in May.
Comparing June of this year to June of last year showed a volume decrease of 3% from 166 in 2022. Likewise, this June showed a median price decrease of 3% from last year’s $905K.
Year to date volume for the first six months was down 68%, for 669 units sold, versus 869 in 2022. Going back to 2019, the most recent “normal business year,” sales volume was down 21% from 799 sold in 2019.
Median price of Inland area homes for the same six month period showed at $863K, down 3% from $887K in 2022; and up 32% from $652K in 2019.
Days on market remained under 30 for 82% of the Inland area homes sold in June. Buyers offered 2.6% above asking price. The high market sale was $2.2M while the low was $390K.
Photo by Sebastien Gabriel on Unsplash
Fri, Jun 16 @ 6:00PM (PDT, UTC-07). Home of Andy Hill, 17411 Delia Ave., Torrance, CA 90277. Watch live or anytime at https://youtube.com/live/hH_BK8uMJpA?feature=share. Come watch the show in person! LIMITED SEATING, so RSVP to reneesafier@hotmail.com ASAP.
SAT, JUN 17 @ 6:30PM — 9:30PM Sister’s Barn , 1408 S Pacific Coast Hwy, Redondo Beach, CA 90277 424-452-6070
THU, JUN 29 @ 6:30PM — 9:30PM Sister’s Barn , 1408 S Pacific Coast Hwy, Redondo Beach, CA 90277 424-452-6070
SAT, JUL 1 @ 6:00PM Home of Athena Paquette and Tom Cormier, 5627 Via Del Collado, Torrance, CA 90505
Canada Day Celebration. Canadian Foods, Chocolate Tasting, Drinks, and Music included! $40. Get Tickets at https://andyandrenee.com/tickets-tips-merch
MON, JUL 3 @ 7:00PM — 11:00PM Terranea Lobby Bar, 100 Terranea Way, Rancho Palos Verdes, CA 90275
WED, JUL 12 @ 7:00PM Malaga Cove Library Park, 2400 Via Campesina, Palos Verdes Estates, CA
SYNCOPATHS “BE LIKE THE SEA” CD RELEASE CONCERT
Saturday, June 17 / 8PM
at the Grand Annex Music Hall

Celebrate the Syncopaths release of their new CD! “Be Like the Sea” delivers a wide variety of songs and tunes from the Irish, Scottish, and American traditions, as well as original compositions. It’s sure to be a joyous night of contemporary folk music featuring vocalist Christa Burch, Ryan McKasson, Ashley Hoyer and Jeffrey Spero this Saturday night at the Annex.
Link for more info and tickets: https://grandvision.org/event/syncopaths/
This is a once a month (every third Tuesday) show that is designed as a listening room for world class songwriters, to play their original music in an intimate setting. The music starts promptly at 7PM. No cover charge, but donations to the performers is encouraged. This month the performers include: JODI SIEGEL, T BEAR, BECCA BYRAM, ALFRED JOHNSON.
Jodi Siegel, originally from Chicago, IL, is a singer, songwriter and guitarist. Over the years Jodi has opened for and or shared the stage with many respected musicians including: Albert King, Robben Ford, Robert Cray, J.D. Souther, David Lindley, Fred Tacket and Paul Barrere (Little Feat) and countless others. Her songs have been recorded by Maria Muldaur, Marcia Ball, Tommy Ridgley and Teresa James. Her latest CD, “Wild Hearts,” produced by Steve Postell, is filled with great songs, cool grooves, intimate, smart lyrics and some of the best of the best musicians in Los Angeles today. Each song has a soulful delivery with an undeniable down-home elegance. It has received great reviews by Patrick Simmons (Doobie Brothers), Maria Muldaur, Walter Trout, David Mansfield (T Bone Burnett), Leland Sklar, Mike Finnigan and Doug Macleod to name a few.
The highly regarded singer/songwriter and funk piano player, Alfred Johnson is considered by some one of this century’s most animated and original songwriters. His energetic style of playing the keys brings a wonderful compliment to his music. Alfred co-wrote 3 songs with RICKIE LEE JONES, including the musical masterpiece “COMPANY,” which are all featured on her 1979 Platinum Grammy Award winning premiere album containing the hit single “Chuck E’s In Love”. Recognized as a true craftsman of his art, Alfred has written over 900 tunes, and at least 70 of them are published. He is best known for his lyric-driven tunes that will keep you captivated till the end. Alfred’s diverse musical style encompasses Funk, New Orleans, Pop, Rock ‘n’ Soul, Gospel, “Rhythm & Bluegrass” – as he calls it, and music that will have you wanting to dance and sing along. He enjoys sharing his work with good listeners.
T Bear, aka Richard T. Bear, is no stranger to musicians and fans all over the world. He has been a long time touring and recording session man and artist, and considered to be one of the best singer/songwriter/keyboard players in Los Angeles. He has returned to the stage with a striking new release, Fresh Bear Tracks, his first studio album in 25+ years. He’s re-emerged, feeling newly inspired, creatively recharged, and making some of the most engaging music of his career. A distinctive singer and talented keyboard player who made his mark as a solo performer and collaborator with many iconic artists — Crosby Stills and Nash, The Blues Brothers, Billy Squier, Cher, as well as Gene Simmons and Peter Criss of Kiss, to name a few — he’s now taking center stage and ready to share his newest music with the world. Fresh Bear Tracks features a host of special guests, including Stephen Stills, Robby Krieger, Edgar Winter, Tom Scott, Walter Trout, and Hutch Hutchinson,
Originally from England, Becca moved to the US early in her career, securing work as a session musician and songwriter in New York, developing a reputation as a highly regarded analog keyboard player and vocalist, and became a resident player at the world renowned Hit Factory after catching the ear of Eddie Germano. She signed with Caroline Records after Bill Laswell was swept away by her talent and her debut album, “Becca’s Smoke and Candy Store” was released. On the heels of that, she published a healthy catalogue of further recordings including “Nice to Be There, “ Childhood’s End,” “A Fair Forgery” and two live albums, “Live from CBGB’s” and “Live from the Living Room.”
Project Barley serves excellent Food (Gourmet Pizza, gluten free/vegan options, wings, sandwiches, salads), wine, and award winning beer. Food served till 8:30pm. No reservations so arrive early to get a table. 2308 E Pacific Coast Hwy, Lomita, CA 90717 https://projectbarley.com/
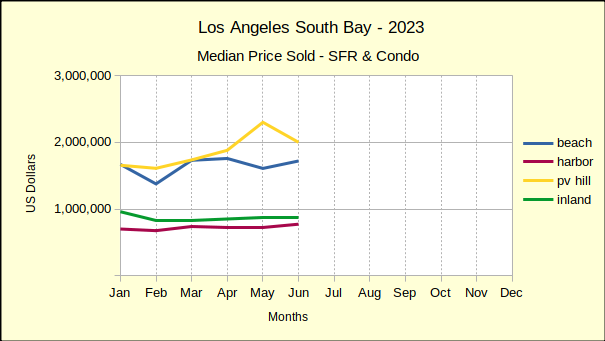
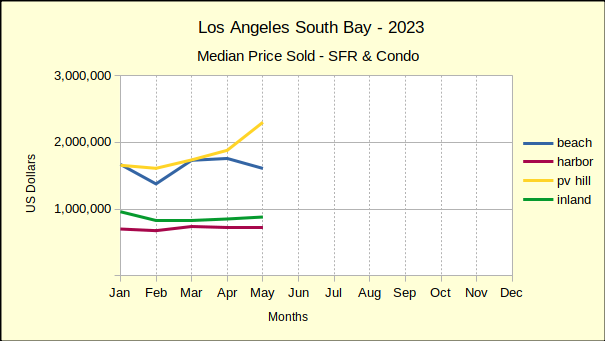
Compared to last month, South Bay home sales look very positive, except for a little tarnish in the Beach cities prices. The sales volume was up by substantial margins in all areas. Prices were mixed with a remarkable median price increase on the Hill. The only exception: After showing positive growth for the past two months, prices at the Beach took a substantial tumble in May.
Year over year activity was an entirely different story. Sales volume was down significantly from last year in all areas. Prices took a hit everywhere except on the Palos Verdes peninsula. (More about that below.) Entry level homes in the Harbor and Inland areas were impacted the least, though even a 3% drop in a single month is significant in the world of real estate.
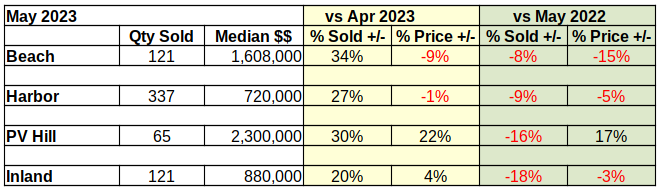
We report actual statistics rather than “seasonally adjusted”.numbers. May is traditionally the launch into buying season in the South Bay, so a May increase in volume from April is to be expected. On the other hand, a 10-20% decrease from May of last year indicates a heavily retrenching market. Every month since the beginning of this year, the number of homes sold in the South Bay has decreased in comparison to 2022.
Similarly, median prices across the South Bay have dropped from the highs of 2022. There have been scattered instances of positive change, like the 17% increase over May of last year for PV. Overall though, prices have been collapsing at an ever more steeply declining rate since January.
Much has been said about the steep rises and falls of sales volumes and median prices since the Covid pandemic hit in early 2020. That leaves 2019 as the last “normal” year of business. At the mid-year point we’ll give a more in depth comparison to 2023 to hopefully provide a more stable picture of the market.
In the meantime, year to date statistics for the first five months reflect an overall decline of 23% in sales volume, and an increase of 33% in median price. The sales slowdown has most affected the Beach Cities with a drop of 39%, followed by the Inland area at 21%, the harbor at 19%, and finally the PV Hill with a 14% slip. A review of the changing median prices across that many years requires adjusting for desired inflation as opposed to uncontrolled inflation.
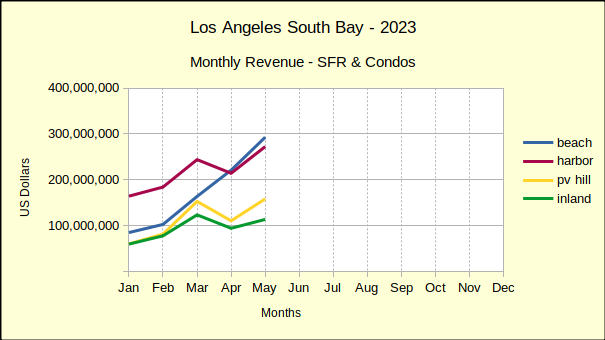
Monthly, the Beach Cities have been on a roll. Even in April, when the other three areas took a nose-dive, the Beach climbed steadily higher in both sales volume and median price. The blue line on the monthly revenue chart below shows surprisingly strong growth.
A closer look at the sales data shows some of the detail. Two of the 121 Beach area sales were on the Strand, with one selling at $18.6M and the other at over $15M. Sales in that rarefied atmosphere tend to be few and far between. In fact, one of those properties sat on the Multiple Listing Service (MLS) for almost exactly three years before it sold. With the April median price at $1.6M, the impact to the aggregate statistics becomes apparent quickly.
Market time for the Beach Cities in May was actually quite prompt, with 79% of the homes sold having spent less that 30 days on the MLS. Pricing was equally strong, with sales prices coming in at two percent above asking price. While the high sale was $18.6M on the Strand, the low was $530K at Brookside Village in Redondo Beach.
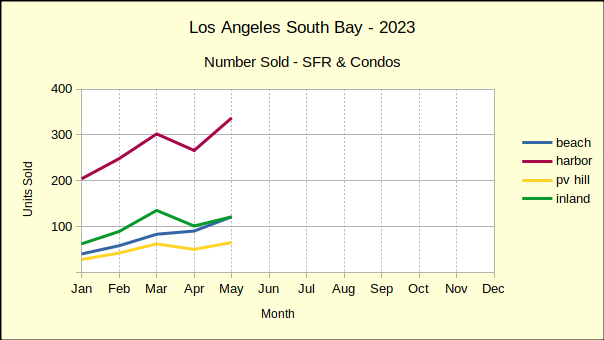
As the red line in the chart below reflects, Harbor area sales entered the spring selling period with a bang! Sales volume was up 27% over April—but, remember April sales were down by 12% in the Harbor and down 13% across the South Bay. Downward pressure on prices has been showing up since the beginning of the year. Out of the first five months of 2023, month to month median prices of Harbor area homes have dropped three times. May saw a 1% decline, which was a repeat of April’s price slip.
Annual statistics cast a recessionary shadow across the picture. Looking back at May of 2022 shows the same month this year with 9% fewer sales and a drop of 5% in median price. Year to date, 2023 has lost 29% in sales volume and 5% in median price.
Compared to the first five months of 2019, the last “normal” business year, Harbor area volume was off 19%. The median price remains positive at 33% above the 2019 median. So far this year the median at the Harbor has declined an average of 5% per month. Given that rate, it’s reasonable to expect a total loss of the price gains since 2019.
Like the rest of the South Bay, the time on market for May was short as 75% of sold properties went into escrow within 30 days of listing. The low sale for the month was $269,500 and the high was $4M, a relatively high price in what is generally considered an entry level market. Interestingly, the high sale was originally listed at $9M in March of 2021, sitting on the market for two years before an accepted offer.
On a month to month basis, homes on the Hill came in with a 22% increase in median price, that being on top of back to back 8% increases for March and April. We’ve long said that homes on the Hill are undervalued. It looks as though that will soon be changed.
Monthly sales volume also jumped 30% for PV, though it has slowed since February and March when it was up 50% and 48% respectively. This pattern of sales increases slowing holds true for most of the South Bay. During the first quarter of 2022 the local real estate market was on fire, and then came the interest rate increases.
When the interest rates were bouncing around 5% during April and May of last year, the PV sales volume had already begun a long, slow decline. Sales figures were off by 30%-40%. So far this year, sales have continued to fall and are, in aggregate, now 31% below 2022 volumes.
Again on a year to date basis, median prices in PV are down 11%. Because the PV Hill has a comparatively small amount of homes, statistics can be volatile. June was the peak of PV business in 2022. While the summer months are typically busier and more competitive, expect this June to be less “exuberant” than May, or last June.
Like the rest of the South Bay, about 75% of homes sold on the Palos Verdes peninsula were active on the market for 30 days or less. On average, the sales price was 2.6% above the asking price.
In May, the Inland area kicked off the spring selling season by pushing month to month sales volume upward 20%. While the volume of sales increased on a month to month basis, the median price went up by 4%. This seasonal bump in sales and prices contrasts sharply with the longer look of a year over year view.
Comparing May numbers from last year to this year gives a reverse result. The number of homes sold in the Inland area fell 18% from May of 2022, and the median price fell 3%, dropping back to $880K from $910K last year.. The longer perspective shows a clear decline in sales accompanied by a hint of decline in median prices.
Looking at the first five months of the year shows sales volume off in total by 68%, or an average monthly decline of nearly 15%, another indicator of the slow market. It’s joined by a 1% drop in the year to date median price.
On the positive side, 87% of the Inland area sales for May closed within 30 days of being listed. With business slip-sliding away, everyone involved is making the transactions happen as quickly and smoothly as possible. The high and the low sales figures for the Month were $1.7M and $310K, respectively. Sellers rejoiced at, and willing buyers paid, an average sales price of 2.9% above the asking price.
Photo by Lisha Riabinina on Unsplash
Come together for the Gathering for the Grand 2023! This year the grand event will be a live concert held at the Warner Grand Theatre, featuring premier Rolling Stones tribute band, JUMPING JACK FLASH! Jumping Jack Flash delivers that same raw, high-energy, larger-than-life rock show that you remember from the Rolling Stones. The honoree this year is the Warner Grand “herself”, right before the Theatre closes for its big renovation. Dress as your favorite rock star and celebrate the Theatre’s past, present and future!
Proceeds benefit Grand Vision Foundation’s performing arts & music education programs.
For details and tickets see https://grandvision.org/event/the-gathering-for-the-grand-with-jumping-jack-flash/
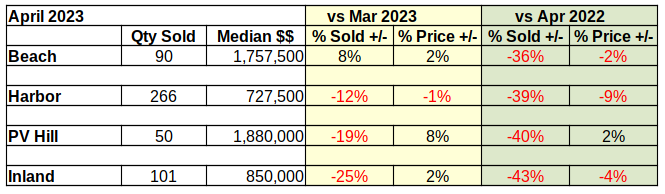
April of 2023 ended with a 40% drop in the number of homes sold across the South Bay compared to 2022. The median price was down 20% from last year in Palos Verdes and is up by a mere 1% at the Beach. Year to year median prices across the South Bay are down approximately 5%. Cumulative sales revenue for the first four months across the South Bay has dropped 39% from 2022 numbers.
Year to date, 2023 has been one of the slowest markets we’ve seen in recent years. Sales are off by 43% in the Beach Cities and are down by 22% across the South Bay compared to last year. Median prices escalated dramatically in 2021-2022, and are still above those of 2019 by 30-35%. However, the median has fallen in all four areas since late last year. We anticipate the median price continuing to drop until interest rates seriously decline again.
Business in the years between 2019 and 2023 was seriously impacted by the pandemic, and the massive government funds released to counter the effect of the pandemic. Looking back at 2019 and comparing it to 2023 offers a perspective on where the market is and where we can expect it to go during the balance of the year. Today we see a huge decline in the number of homes being sold. That has yet to translate into a significant decline in median prices, although 75% of year over year sales show prices falling.
At the same time the Average Days On Market (ADOM) has increased from about 7 days during the sales boom of 2021-2022 to about 30 days now. That’s a four-fold increase in the amount of time it takes to sell a home. For a seller who needs to move, that will feel like an eternity. It’s that sense of urgency that drives prices down and ultimately results in a shift of the market.
Sellers in the Beach Cities had a good month in April—at least compared to March of this year. Compared to April of last year, the picture is far worse.
The number of homes sold in April was up 8% compared to March. That sounds positive, until the realization that sales volume was down 36% compared to April of 2022. At the same time, the median price was up 2% versus last month, and down 2% compared to the same month last year.
There’s a lot of talk among brokers these days about “sticky prices.” Recent sales at the Beach offer a good example of what that means. The statistics show that sales are down 36% from last year, however prices have only dropped 2%. Sales are falling because the number of viable buyers is down.
Interest rate increases have pushed the most tenuous group of prospective buyers out of the market. At the same time, sellers are still revelling in the boost to median prices that came with record low interest rates during the pandemic. Beach area sellers have yet to adjust to the reality of a re-trenching economy. That adjustment is “sticky prices.”
The neighborhood can affect how long it takes the median price to respond to changes in the economic environment. While sales volume and pricing has remained strong at the Beach, sellers and buyers in entry level communities are impacted more immediately by shifts in the economy.
Thus we see the give and take of the market bring median prices into a stable range early in the year in the Harbor area. The red line in the median price chart below shows four months of reasonably steady prices. While month over month prices have shown only a 1% drop, the monthly sales volume has taken a 12% dive from March, as shown in the Sales Volume chart, above.
The monthly decline in sales was multiplied in the year over year statistics. April sales volume was down 39% from April of 2022. For the same period, the declining sales volume was coupled with a 9% drop in median price. So the entry level communities demonstrate a much quicker and deeper response to changes in the financial picture.
Part of that response is the time on market, which has risen from 15 ADOM in mid-2021 to 26 ADOM in April of this year. The increasing time required to sell homes contributes to the number of homes available on the market. Both factors contribute to falling purchase prices.
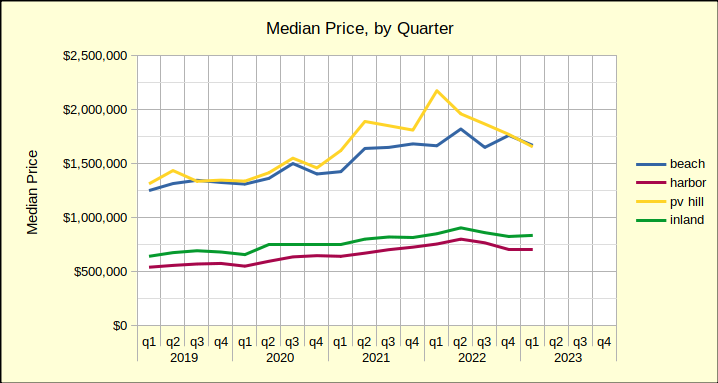
Through 2021 and 2022 home prices on the Palos Verdes peninsula benefitted from the Covid pandemic more than any area in the South Bay. In the median price by quarter chart, shown below, the yellow line is seen jumping up and away from the blue line of the Beach Cities. Unfortunately for home owners on the Hill, that price boost has already pulled back into line with prices of Beach area homes.
Comparing the first four months of the 2023 to 2022 median prices on the Hill have dropped 16%. It’s a steep decline in view of decreases at 3% and 6% in the Inland and Harbor areas, respectively. Even more so when looking at the 1% increase at the Beach.

The statistics look much better when comparing Palos Verdes sales from 2023 to statistics from 2019, the last “normal” year of real estate business. Sales volume on the Hill is down a modest 13%–modest by comparison to the Beach, which is down 43%. In contrast, median prices in 2023, compared to 2019, are still showing positive growth of 30%.
So, if one were to take the Federal Reserve System position that 2% annual growth is a desirable target, where would prices be today? The median price in Palos Verdes in May of 2019 was $1.5M. Jump forward to 2023 and that becomes about $1.6M. The median on the Hill last month was $1.9M, which suggests further price reductions.
From an investment perspective, homes in the Inland area of the Los Angeles South Bay are “bread and butter.” These are the homes, much like those in the Harbor area, which reliably increase in value over long periods of time at a slow and steady rate. Most importantly, they house the bulk of our community.
In the short term, Inland home sales volume is down 25% from March to April of this year. Median prices are up 2% for the same period. This is the steepest fall in number of homes sold in the four areas charted.
Year over year, sales volume is off even more at 43% below April of 2022, and prices similarly down by 4%. We expect a seasonal boost to sales for the second quarter, when families most frequently schedule moves. Beyond that, most predictions are for continued softening in the real estate market as the Fed struggles with inflation. (The April Consumer Price Index, [CPI-U] for Los Angeles metro was 5.2% for Housing.)
Photo by Bradley Pisney on Unsplash
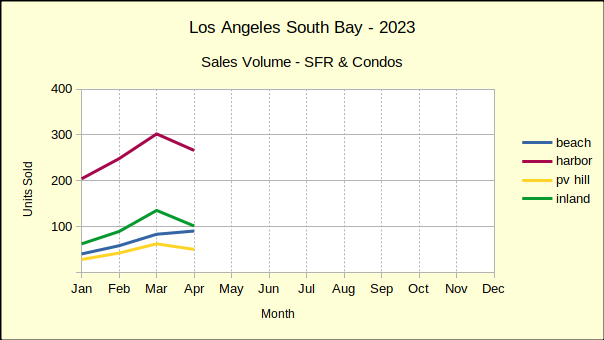
A glance at the table below confirms that year over year statistics are overwhelming the monthly numbers. Buyers were out there buying in March, and they were buying more than they did in February, which was up from January. That’s to be expected. We report actual numbers, as opposed to “seasonally adjusted,” so coming from the depths of winter into spring always increases real estate activity.
Because of that simple fact, the year over year statistics are far more important as an indicator of where the market may be headed. The big increase in March sales doesn’t offset how far down sales volume has gone since last year. Nor does it hint at the level to which median prices are taking a hit.
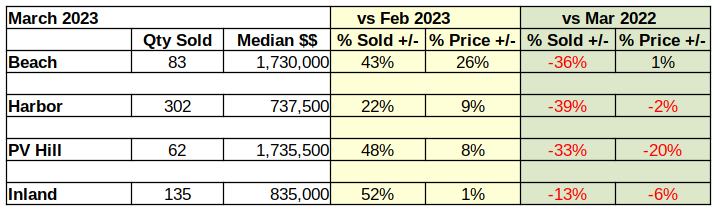
Compared to last year, sales volume is off by a third in nearly all areas of the Los Angeles South Bay. Median prices haven’t dropped nearly as large a percentage, but we can clearly see the direction. The Federal Reserve System (Fed) comment in the April “Beige Book” said it all: “Residential and commercial real estate activity fell, and lending activity declined substantially.”
As the over-all real estate market begins a dive into the depths of a Fed-induced recession, we find the Beach Cities as the only remaining local market with year-over-year positive median price growth. It’s not much. A mere 1% growth over March of 2022 is hardly an investment recommendation, especially with inflation running around 6%. And, the rest of the Los Angeles South Bay is already negative compared to this time last year.
This is the second time in 2023 buyers at the Beach have nudged the median price up while the rest of the residential market fell. January showed a 6% increase which collapsed February in a 17% free fall. February’s dismal numbers contributed to what looks like a good March in the month to month measurement.
Staying positive in March appears to be predominately the result of a single sale in Hermosa Beach. At nearly 5000 sq ft, with stunning ocean views, the property was bid up from its $5M dollar list price to just over $6M, closing with a cash offer in only 12 days. Without that transaction the Beach Cities marketplace would have stood at 0% growth.
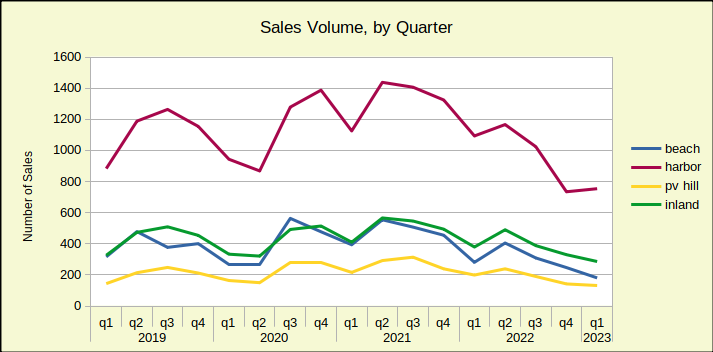
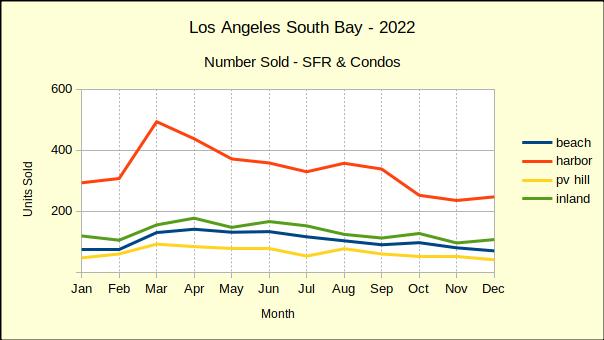
The big story at the Beach is the sales volume versus the most recent “normal” year of real estate business. The chart below shows the number of homes sold in each of the South Bay areas, with seasonal shifts.
Notice that 2019, the last normal year, begins low, with few sales in the winter months. Sales peak in quarter three, in the heat of summer, then decline back down to about where they started.
Compare that to what happened in 2022, when everything seemed to head down.
Only 83 homes were sold in March of this year, and only 181 homes sold across the first quarter of 2023. In 2019 the area averaged monthly sales of over 100 units; approximately 425 homes per quarter. That amounts to a 43% decline in the number of sales compared to pre-pandemic levels.
As this is written there are 152 homes available in the Beach Cities with an average of 62 days on market. Both, the level of inventory and the time on market are increasing daily. Those factors, especially working together, will cause price decreases. With a constantly increasing mortgage interest rate, there’s little doubt the valuation gains of the pandemic era will not hold up to the recession in the world of real estate.
The Sales Volume, by Quarter chart above shows relatively synchronous movement across time by three of the four areas. The fourth area, the Harbor, floats at the top of the sales volume chart. Similarly, the Harbor area sinks to the bottom of the median price chart.
Homes in the Harbor area are typically what’s known as “entry level.” They are small homes, often condominiums, and are priced at the bottom of the scale. These are the homes newly wed couples buy, and the homes that house growing families. They are the type of properties occupied by most Angelenos, whether they be homeowners or tenants.
None of that explains the huge swings, though. What does is family economics—cash flow. When both prices and interest rates are low, the entry level market sings. When the cost of home ownership rises, this is the first area to fall and it usually falls the deepest. March sales across the Harbor dropped by 39% from March of 2022. At the same time median pricing at the Harbor dropped 2%–not nearly enough to offset interest rates that are running in the 6%-7% range. Until the mortgage interest rate goes down, or the asking price drops, or both, this market is going to be slow.
Inventory is currently 336 homes on the market, with time on the market averaging 60 days.
Even more volatile than the Beach, homes on the Palos Verdes Peninsula dropped over a half million dollars in median price from the first quarter of 2022 to the first quarter of 2023. That steep yellow line on the chart below shows the downward direction of home prices in the area. Interestingly, the Beach Cities and the PV Hill declines have been almost exactly the same for the past 90 days.
As noted above, the Peninsula, with its large lots and relatively few homes, invariably shows a lot of volatility. The 20% drop in year over year median price is matched by a 33% drop in sales volume since March of 2022. Much of the median price increase seen last year resulted from a series of new construction sales. Those newly built homes came in at top dollar and helped elevate the median price nicely.
Builders are now anticipating a long, slow recession/recovery, so the PV market is not likely to see that benefit come back for a few years.
This newsletter focuses on residential, but it should be noted the Palos Verdes commercial marketplace has also taken a significant hit since the pandemic. Retail lease prices are at rock bottom and lots of space is available. It would not be surprising to see some of the older commercial space re-configured to meet residential needs. Such a transition could help the cities on the Hill meet their obligation to the State for additional residential construction to alleviate the housing shortage.
Inventory today shows 83 homes available, with an average time of 80 days on the market.
The “family friendly” Inland Area is surrounded on three sides by the Beach Cities, PV Hill and the Harbor Area. It’s a quiet environment, usually without the drama and speculation found in the more upscale Beach and Hill areas. Anchored by Torrance, the market direction is normally the same as the rest of the South Bay, without the more radical ups and downs. March real estate activity reflected that nature in price and sales volume compared to March of last year.
The “Median Price by Quarter” chart above shows a year over year decrease of 6%, in keeping with annual results from the Hill and Harbor areas. The chart also shows a long, steady green line that doesn’t offer surprises, or dramatic movements in any direction. The current recession is expected to bring prices down somewhat, making the Inland area an excellent target for home buyers, or investors during the coming months.
Available as of this writing, are 130 homes. In keeping with the Inland image of slow and steady, the statistics still show only an average of 47 days on the market. Compare that to 80 on the Hill and 62 at the Beach. Buyers are more abundant here, as long as mortgage interest rates are affordable.
The areas are:
Beach: includes the cities of El Segundo, Manhattan Beach, Hermosa Beach and Redondo Beach;
PV Hill: includes the cities of Palos Verdes Estates, Rancho Palos Verdes, Rolling Hills and Rolling Hills Estates;
Harbor: includes the cities of San Pedro, Long Beach, Wilmington, Harbor City and Carson;
Inland: includes the cities of Torrance, Gardena and Lomita.
Photo by Rich Brents on Unsplash
Dylanfest is an 8-hour celebration of the music of Bob Dylan. Local favorites, Andy Hill and Renee Safier started it in 1991 and have been holding the event ever since. The show started with their band and a few friends doing an evening of songs by Bob Dylan, and it has grown to an 8-hour event with over 40 musicians performing over 60 Dylan songs. This year the festival will be held on Saturday, May 27th, from roughly noon until 8pm.
Food and drinks (including beer and wine) will be available on site during the event. Music is continuous with breaks only as entertainers move on and off the stage.

The band, Hard Rain, is the “house band”, and is joined by solo artists, full bands, and instrumentalists throughout the course of the day. The show is held at the Torrance Cultural Arts Center in the Torino Plaza. Bring a jacket for later. In case of rain, the event will go on, and we will move inside.
General Admission Tickets ($35-4/2-5/26; $40 at the Door). VIP tickets are $110 and come with some extra goodies (Entry fee, Event T-Shirt, Dylanfest Tote Bag, Dylanfest Mug, Post-Dylanfest VIP Party, VIP Hanging Tag). Kids ages 7-14 years are $10. Tickets at https://andyandrenee.com/tickets-tips-merch
Torino Plaza, Torrance Cultural Arts Center, 3300 Civic Center Drive, Torrance, CA 90503
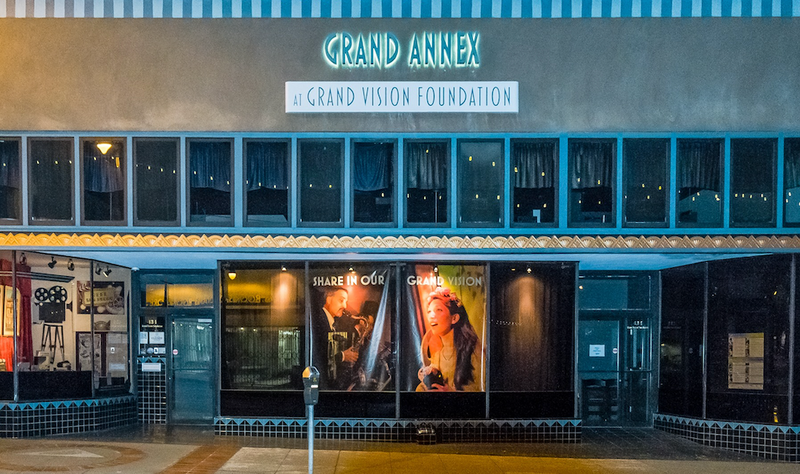
The Grand Annex Music Hall is a rare neighborhood gem, a 150-seat cabaret venue run by Grand Vision in the heart of San Pedro’s thriving arts district. This May they are presenting three fabulous concerts of original music.

Multi-award-winners Cara Luft and JD Edwards are taking the North American folk scene by storm. Cara Luft is an original member of the Canadian folk trio, The Wailin’ Jennys.
Wine Tasting 7PM led by sommelier JP Molinari.

Born and raised in San Pedro, this incredibly talented duo is rapidly gaining attention for their acoustic and indie-inspired music. Hear their insightful originals and beloved covers.

A night of guitar, Hawaiian style featuring Two-time Nā Hōkū Hanohano Hawaiian Grammy Award winner and master slack key guitarist Patrick Landeza with PJ Landeza (bass guitar) and Justin Firmeza (steel guitar).
“Slack Key & Steel” Workshop at 7PM led by Patrick Landeza and Justin Firmeza.
The Grand Annex Music Hall is located at 434 W 6th Street, San Pedro Ca 90731.For more information about the performances and the venue go to their website https://grandvision.org/grand-annex/.
Grand Vision Foundation
The Grand Annex Music Hall | Meet the Music | Friend’s Group to the Warner Grand Theatre
434 W. 6th St., San Pedro, CA 90731310.833.4813 | www.GrandVision.org
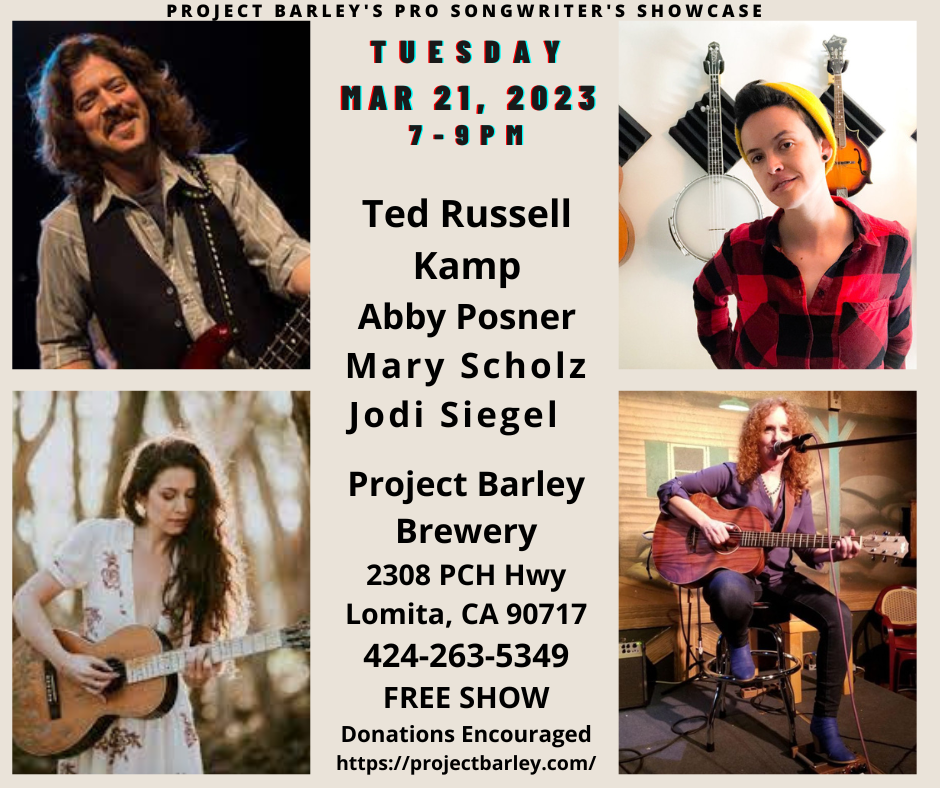 This coming Tuesday night will feature some of LA’s best songwriters! Ted Russell Kamp, Abby Posner, Mary Scholz and me~
With guest host with the most John Antich….
It’s gonna be a great night and we are expecting a pretty big crowd, so arrive early enough to get a table…for more information on the performers:
Ted Russell Kamp: https://tedrussellkamp.com/
Abby Posner: https://www.abbyposner.com/
Mary Scholz: https://www.maryscholz.com/
Jodi Siegel: https://jodisiegel.com/
Project Barley serves excellent Food (Gourmet Pizza, gluten free/vegan options, wings, sandwiches, salads), wine, and award winning beer. Food served till 8:30pm. No reservations so arrive early to get a table. 2308 E Pacific Coast Hwy, Lomita, CA 90717 https://projectbarley.com/
Andy & Renee- Terranea Lobby Bar, 3/20
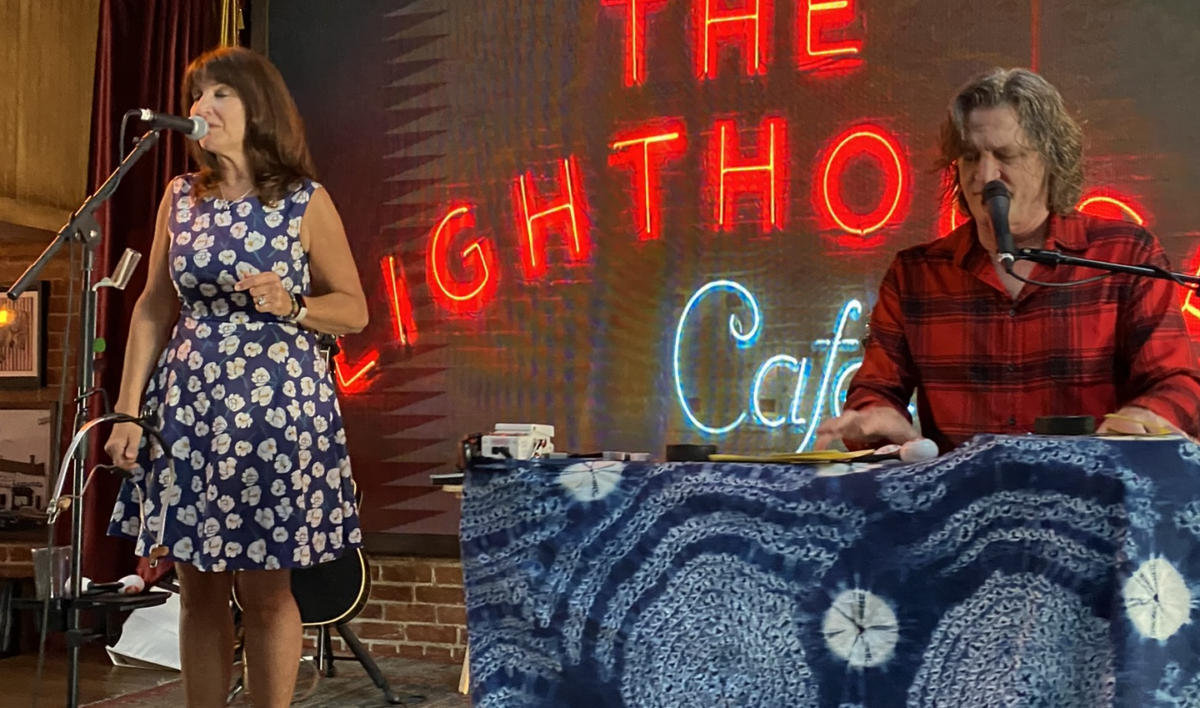
Andy & Renee- Tuesdays- The Lighthouse
Andy-Fairmont Century City- Wednesdays
CELEBRATE ANDY’S BIRTHDAY-
FRIDAY, MAR. 24TH AT OUR LIVESTREAM SHOW THIS FRIDAY!!!!
DYLANFEST SUPER EARLY BIRD TICKETS ON SALE NOW-TIL APRIL 1st!
Hello everyone!
Hope all is well!
Lots of other Great gigs coming up….Hope to see you!
Celebrate Andy’s Birthday at our Livestream, Friday, March 24th. Just RSVP to this email to reserve your spot!
We will also be up in Auburn, CA the last weekend of March and Dallas, TX in April…Go to www.andyandrenee.com for more info.
Exciting news….Super Early Bird Dylanfest 33 tickets are ON SALE NOW! Save $10 off the price at the door til April 1st! Go to https://andyandrenee.com/tickets-tips-merch to get yours now!
We’ll see you guys soon!
Love,
Andy & Renee
Every WED @ 8:30PM — 11:30PM Fairmont Century Plaza, 2025 Avenue of the Stars, Los Angeles, CA
Celebrate Andy’s Birthday a day early!!
Friday, Mar. 24th 6pm PST
Home of Andy Hill 17411 Delia Ave., Torrance, CA 90277
Watch live, or anytime at https://youtube.com/live/BpWWfg1d_Hc?feature=share. Come watch the show in person! LIMITED SEATING, so RSVP to reneesafier@hotmail.com ASAP. The Livestream shows are free to watch, but the option to contribute is there for those who are in a position to do so. You can see our song list to make requests and contribute at https://andyandrenee.com/tickets-tips-merch, PayPal (paypal.me/andyandrenee) or Venmo, (www.venmo.com/Renee-Safier). A portion of the proceeds will go to the Los Angeles Midnight Mission. We are sustained by the generosity and support of the fans who love the music, and who donate as they are able. If you use funds from your bank vs. your credit card, we aren’t charged a service fee, but either way, we appreciate your support!
Andy & Renee-Station Public House, Auburn, CA
THU-SAT MAR 30, 31 and April 1 @ 6:00PM — 9:00PM Station Public House, 750 Lincoln Way St.100, Auburn, CA 95603
Mark your calendars!
DYLANFEST33-SATURDAY, MAY 27th! Tickets on sale NOW!
Thanks so much….See you soon!
Andy & Renee
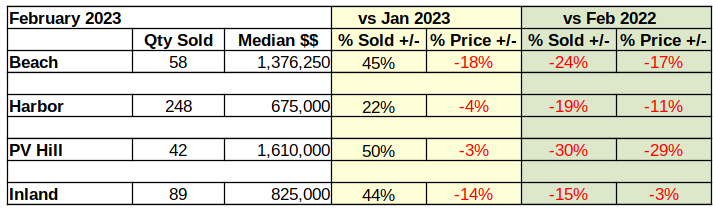
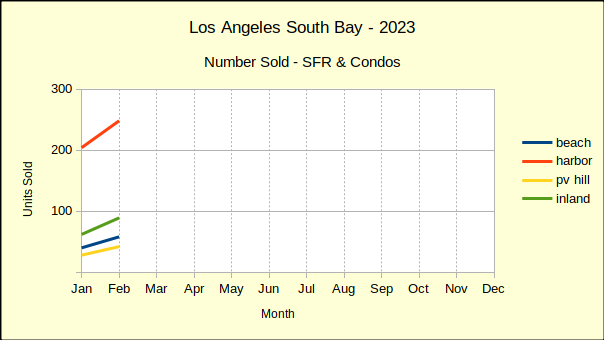
Last year ended with sales volume off, median prices coming down and revenue dropping fast. January showed little change. February of this year shows sales volume up from January by as much as 50%. The reason why is obvious–the median price is simultaneously dropping by percentages as high as 18%.
Comparing February activity to February a year ago shows significant declines in both sales volume and in median price. At that point in 2022 the market was just beginning to dip a toe in the recessionary waters. Now we’re wading into it.
The first week of March Fed Chairman Jerome Powell told Congress, “…the ultimate level of interest rates is likely to be higher than previously anticipated.” Powell’s pointed remark clearly tells us the most recent pause in interest rate hikes is momentary. The lowest local mortgage rates we could find at the time was 6.75%. As such, we anticipate rates in excess of 7% by summer.
About the second week of January mortgage lenders began loosening the interest rates in anticipation of a relaxation by the Federal Reserve. For the most part, local rates stayed below 6% until late in February when the Fed began dropping hints that inflation was still raging.
After a “soft” January, sellers in the market were dropping prices and buyers responding positively by making offers. Now that mortgage rates have resumed climbing, sellers will have to drop prices some more to remain attractive to buyers.
With only two months behind us this year, there are indications lenders will “see-saw” the rates throughout the year. Already this year we have seen retail mortgage rates moving up and moving down without influence from the Fed. It seems to be an effort to induce buyers to accept high interest rates based on the theory they were higher last week so this temporary reduction is a good deal.
On a month-to-month basis, revenue across the South Bay is up 21% from January of this year. Don’t get excited—it’s only one month. January was one of the lowest performing months we’ve seen recently.
On a year-over-year basis, revenue is down 34% from last February! January was 38% lower than January of 2022. Year to date through February, revenue in the South Bay is down 36% and is expected to continue falling.
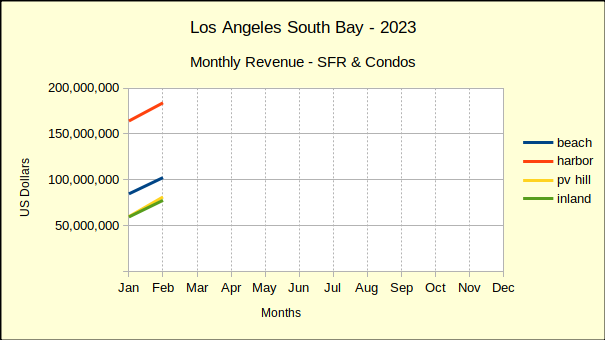
One of the more important statistics to note is how 2023 activity compares to 2019, which was the most recent “normal” year of real estate business. Across the South Bay real estate revenue for the first two months of 2023 is 7% below the same period in 2019. Restated, the South Bay has already lost over four years of gain in real estate revenue.
More units of housing were sold in February than January, and the median price was lower in February. The Beach Cities saw a drop of 18% from January while the PV Hill held the decline to 3%. The Harbor area fell 4% and the Inland area dropped 14%.
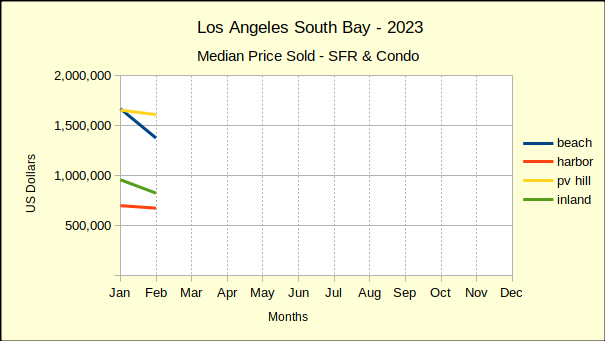
Comparing February of this year to February of 2022 brought a harsher focus to the picture. All four areas have fallen from last years median price. The Beach is down 17%, the Harbor down 11%, the Hill is off 29% and the Inland cities down just 3%.
The summary numbers comparing the first two months of 2023 to the most recent “normal” year of 2019 are not encouraging. Overall, sales revenue has fallen 7% below revenue figures for the same period in 2019. The Harbor area has fared the best, showing a 9% increase in revenue over January and February activity in 2019. Of course, that was four years ago and classic inflation would give that type of gain. It’s clear the “inflation on steriods” we’ve been experiencing is gone from the real estate industry.
The Beach cities provide an excellent indication of where the real estate economy is going. The first two months of revenue for 2023 is down 32%. Palos Verdes is down 2%, while the Inland area is up be a mere 1%. After four years of pandemic, recession, inflation and Federal Reserve manipulation the real estate market is tanking.
The areas are:
Beach: includes the cities of El Segundo, Manhattan Beach, Hermosa Beach and Redondo Beach;
PV Hill: includes the cities of Palos Verdes Estates, Rancho Palos Verdes, Rolling Hills and Rolling Hills Estates;
Harbor: includes the cities of San Pedro, Long Beach, Wilmington, Harbor City and Carson;
Inland: includes the cities of Torrance, Gardena and Lomita.
Photo by Ussama Azam on Unsplash
We’re taking a little different approach with this post. Because it’s not only the end of the month, but the end of the year, we’re doing a quick summary of the monthly data, followed by some more detailed discussion of how the individual areas have fared over the past year. We’ll even try some crystal gazing while we walk through the annual data for each neighborhood.
This is a great place to bring in our At A Glance table. It displays in just a few numbers how all the areas of the LA South Bay are doing compared to last month, and compared to this same month last year.
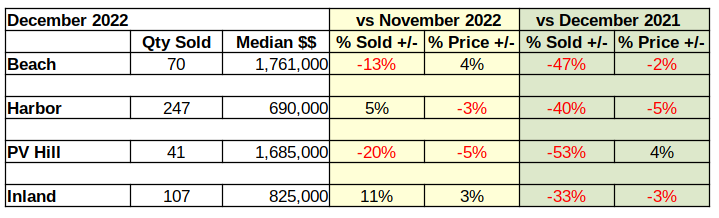
Looking at December vs November, once again the percentage of unsold homes has increased and the number of homes sold below last month’s median price has also marginally increased. More importantly, on a year over year basis the amount of red ink is even greater. Losses in number of sales and in the value of those sales is clearly growing.
Despite all the negative numbers, there may be a light in the future. For the past couple weeks we have observed a softening in the mortgage interest rates. If that turns out to be more than a mid-winter teaser rate, this spring may shine a bit brighter than previously anticipated. We’re not holding our breath though. Recent speeches from Federal Reserve Bank leaders have stated a clear intent to “hold the line” on driving down inflation with mortgage interest rate increases.
Compared to 2021, fewer homes have been sold in the Beach Cities every month of 2022 than the same month the previous year. January started the trend with a decline of 28% versus the number of homes sold in 2021. That difference continued to increase all year. By December sales were 47% lower than the previous December.
As the interest rates climbed, the number of home sales dropped. Looking at the total sales volume for the year, 35% fewer homes were sold in the Beach area during 2022, than were sold in 2021. Of course, 2020 and 2021 were the highly erratic pandemic years. So, looking into sales at the Beach for the last few years we find the number of homes sold has already dropped 21% below the number sold during 2019, our last normal economic year. Effectively, the Covid-19 pandemic created. Then erased any gains of the past three years at the Beach.
Homes sold in: 2019 – 1572 (market normal)
2020 – 1572 (market direction down six months, up six months)
2021 – 1910 (market direction down two months, up ten months)
2022 – 1242 (market direction down twelve months)
While the Beach Cities suffered the largest drop in sales volume for 2022, the South Bay as a whole has also dropped below the sales figures for 2019.
All areas started the 2022 year down from the prior month and down from the same month in the prior year. February results were mixed with the Harbor and Palos Verdes areas showing stronger results. March sales jumped up as buyers realized the rising interest rates were about to price them out of the market. From April on, sales volume across the South Bay was trending down on a year over year basis.
In sheer number of sales, the Harbor area fell the farthest. In 2021 annual sales 5292 homes were sold in the Harbor cities, while in 2022 the number dropped to 4017. That amounted to only a 24% decrease compared to the 35% annual collapse in the Beach areas.
On a month to prior month measure, sales declined six months out of nine across the South Bay. Occasionally one or two areas would post a positive sales month, but in the end, 2022 showed a 26% drop in sales volume from 2021 across the South Bay.
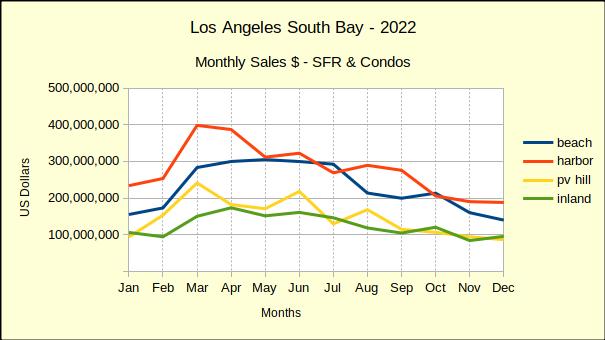
With the number of sales dropping in a range of 25% to 50% it’s not a surprise to discover the total dollar value of those sales has taken a dive. As the chart below shows, the first quarter of the year was generally positive, then reality set in and the buyers started walking away. The rest of the year was little more than a measure of the recession.
Monthly revenue in the Harbor area alone dropped $200 million between March and December. The Beach cities and the Palos Verdes area lost about $150 million a month in sales value. Inland area sales for the same period are off approximately $75 million.
One should consider these declines in the context of the pandemic. Early on, while much of the world was in lockdown, the government flooded the citizenry with easy money, hoping to keep the economy afloat. Mortgage interest rates were already at the bottom because the economy was just recovering from the last recession. The result was a real estate boom starting in summer of 2021, which continued until March of 2022.
The housing market is now in the “bust” part of the cycle and we anticipate it to last through 2023. Gross sales across the South Bay jumped up from $8 billion in 2019 to $12 billion in 2021. That’s clearly unsustainable, especially from the perspective of a Federal Reserve System which is looking for 2% growth. So far the market decline has taken back about 23% of that $4 billion bubble.
There is a lull between when buyers stop buying and prices start dropping. Most sellers need to see headlines about the market change before they make a price reduction. Median prices started to slide in August at the Beach and on PV Hill. The year ended with most areas having experienced multiple monthly declines in the median price. Despite that, median prices still exceeded those of 2021 by roughly 7%.
Comparing 2022 to 2019 better shows the inflation factor. Generally speaking the South Bay ended the year with median prices 30%-35% higher than they were in 2019.
The Palos Verdes market is comparatively small, thus is typically volatile on a monthly basis. The yellow line on the chart above shows the range of high and low median prices. Since mid-year the median price has drifted down and merged into the downward trend.
We’ve been comparing 2022 to 2019 all year because real estate sales during the height of the pandemic were so out of the ordinary, regular year over year comparisons yielded untenable results. The chart below depicts the current year total sales for the South Bay compared to sales from 2019.
Tracking the blue line, one can see where sales dropped below 2019 values in August, recovered in September, then slipped below again for the fourth quarter of the year. December sales didn’t fall quite as far as projected, but still came in about $200 million less than December of 2019.
The end of the year reflected accumulated sales of approximately $9.3 billion. That would mean 2022 total dollar sales come in at $1.3 billion above the $8 billion total dollar value sold in 2019. Across the South Bay that was an 18% increase.
Broken out by community, we found total dollars sold in the Beach cities to be 4% above 2019, followed by the Inland area with a 20% increase. Harbor came in next with a 21% increase and the PV Hill with a 35% increase.
We expect both sales volume and median price to continue declining through most, if not all, of 2023. By mid-year of 2024 there should be evidence of the beginnings of a recovery.
The areas are:
Beach: includes the cities of El Segundo, Manhattan Beach, Hermosa Beach and Redondo Beach;
PV Hill: includes the cities of Palos Verdes Estates, Rancho Palos Verdes, Rolling Hills and Rolling Hills Estates;
Harbor: includes the cities of San Pedro, Long Beach, Wilmington, Harbor City and Carson;
Inland: includes the cities of Torrance, Gardena and Lomita.
Every Tuesday (Except 12/27)
TUESDAYS @ 5:30PM — 7:30PM The Lighthouse Cafe, 30 Pier Avenue Hermosa Beach, CA 90254 310 376-9833, Hermosa Beach, CA 90254
EVERY WEDNESDAY (except 12/28) @ 8:30PM — 11:30PM. Fairmont Century Plaza, 2025 Avenue of the Stars, Los Angeles, CA
THU, DEC 15 @ 6:30PM — 9:30 PM Sister’s Barn , 1408 S Pacific Coast Hwy, Redondo Beach, CA 90277 424-452-6070
FRI, DEC 16th @ 6:00PM (PST, UTC-08) Home of Andy Hill, 17411 Delia Ave., Torrance, CA 90277
Watch the show live or anytime at https://youtu.be/MFYgLzHe0Eo. Come watch the show in person! RSVP to reneesafier@hotmail.com. To watch in person, RSVP to reneesafier@hotmail.com. The Livestream shows are free to watch, but the option to contribute is there for those who are in a position to do so. You can see our song list to make requests and contribute at https://andyandrenee.com/tickets-tips-merch, PayPal (paypal.me/andyandrenee) or Venmo, (www.venmo.com/Renee-Safier). A portion of the proceeds will go to the Los Angeles Midnight Mission. We are sustained by the generosity and support of the fans who love the music, and who donate as they are able. If you use funds from your bank vs. your credit card, we aren’t charged a service fee, but either way, we appreciate your support!
Home of Andy Hill, 17411 Delia Ave., Torrance, CA 90277
Come watch the show in person! $30. LIMITED SEATING, so get tickets at https://andyandrenee.com/tickets-tips-merch, ASAP.
Watch the show live or anytime at https://youtu.be/WTRU9jeFjoI. Online viewers can contribute at https://andyandrenee.com/tickets-tips-merch, PayPal (paypal.me/andyandrenee) or Venmo, (www.venmo.com/Renee-Safier). A portion of the proceeds will go to the Los Angeles Midnight Mission. We are sustained by the generosity and support of the fans who love the music, and who donate as they are able. If you use funds from your bank vs. your credit card, we aren’t charged a service fee, but either way, we appreciate your support!
SAT, DEC 31 @ 8:30PM-12:15AM
The Grand Annex, 434 W. 6th St., San Pedro, CA 90731
Celebrate the New Year on the dance floor while the band delivers hits from across the decades. Your ticket includes late-night pizza, party favors, and a champagne toast to welcome in 2023! Get tickets at info at https://grandvision.org/event/andy-renee-hard-rainnew-years-party-concert-2/
Saturday, Jan. 14th, Doors 6pm, Show 7pm. $25
BYOB and a Seinfeld-themed dish. We’ll erect The Festivus Pole, have a Feats of Strength contest, Airing of the Grievances, and a special “Elaine Benes” Dance class…All your favorite Seinfeld gags! Get Tickets at https://andyandrenee.com/tickets-tips-merch
It’s gonna be another diverse night of original music this month at the All Pro Songwriter’s night!
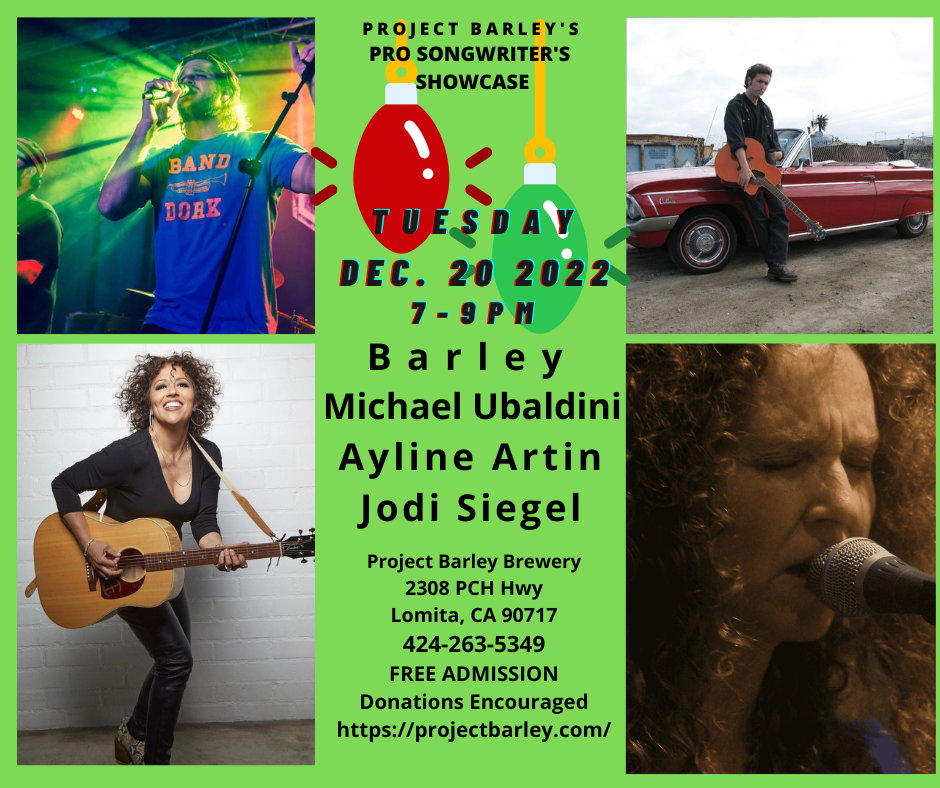
The owner of Project Barley, Brent Reger, is a fine musician, songwriter, trumpet player and a member of the popular South Bay 8 piece band Barley; folk rock with a beach vibe twist! They will do an acoustic set with a few of their members. Barley plays many festivals and gigs throughout Southern California, and are known for their great harmonies, three lead singers and loyal fans!
For more information on them go to https://secretagentent.com/barley
Americana/roots musician Michael Ubaldini, often called the “Rock and Roll Poet, is an Outlaw folk & rock n roll singer songwriter with a cause. His fan base included & includes legendary artists such The Late Joe Strummer of Punk legends & rock n roll hall of famers ‘The Clash’ & ‘Brian Setzer’, both who would turn up at his live shows. He has done recent shows with artists diverse as Judy Collins & The Kingston Trio to Dwight Yoakam, The Cramps, Don Mclean & Lucinda Williams-Jerry Lee Lewis & Brian Setzer
For more information on Michael visit https://www.rocknrollpoet.com/
Ayline Artine (Blues/Rock/soul) is a dynamic performer and musician. As a talented multi-instrumentalist, Ayline’s music will draw you in and steal your heart. For this night, Aylineʼs band will feature percussionist Oliver C. Brown, (Mick Fleetwood Blues Band, Fleetwood Mac, KC and the Sunshine Band), and bass player Derrick Elliott. Aylineʼs blues and soul-infused rock nʼroll aesthetic are brilliantly showcased on her new record “Heaven In Hell”.
For more information on Ayline visit her website: https://aylineartin.com/
Jodi will also be playing a set….for more information on her visit the website https://jodisiegel.com/