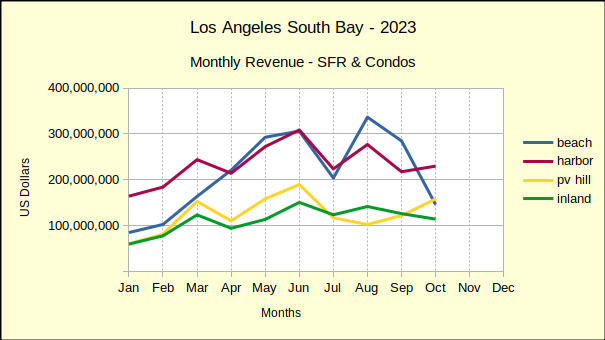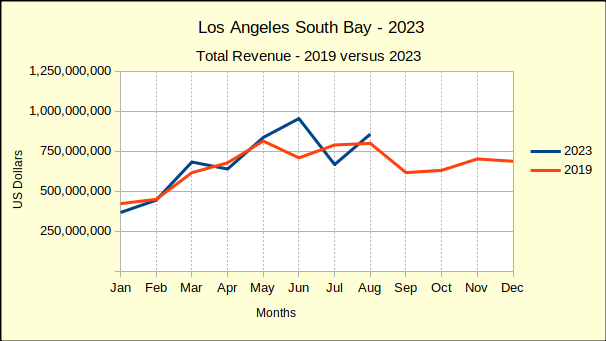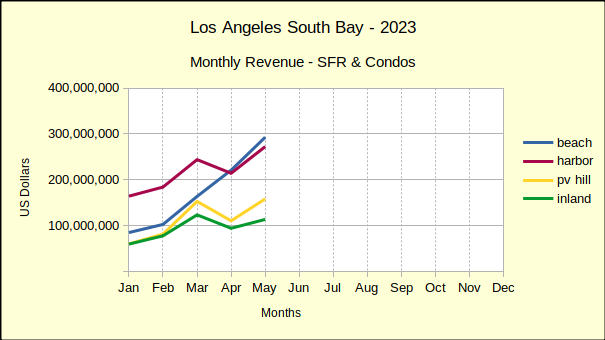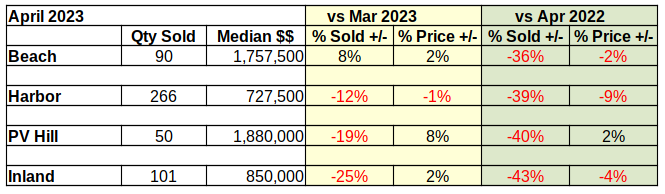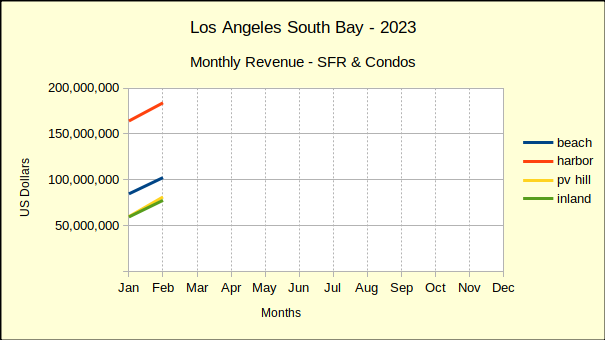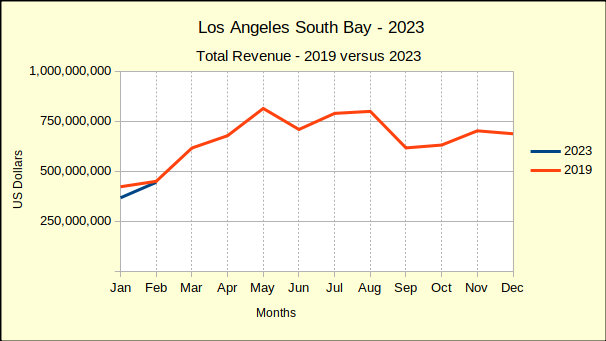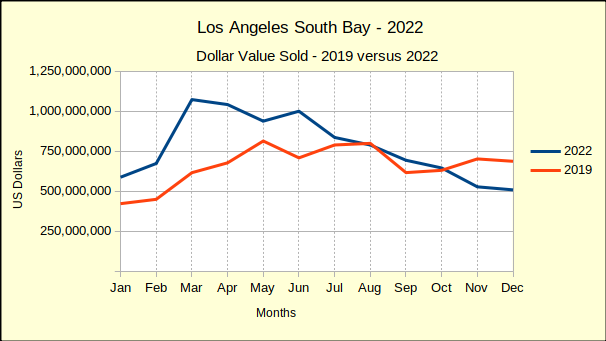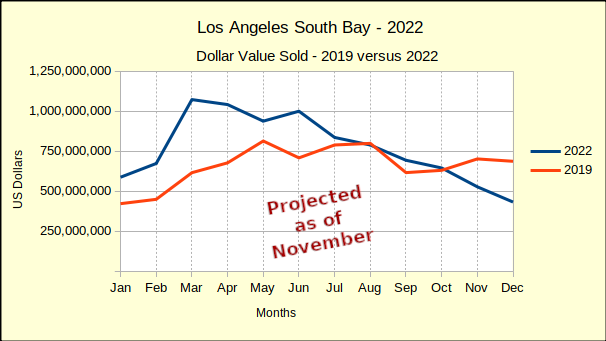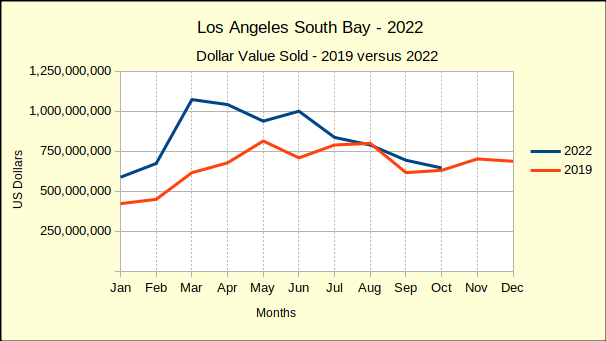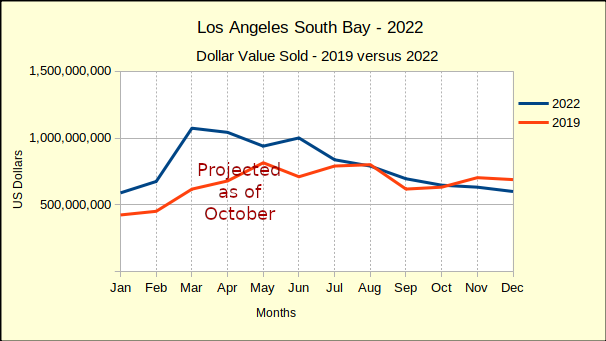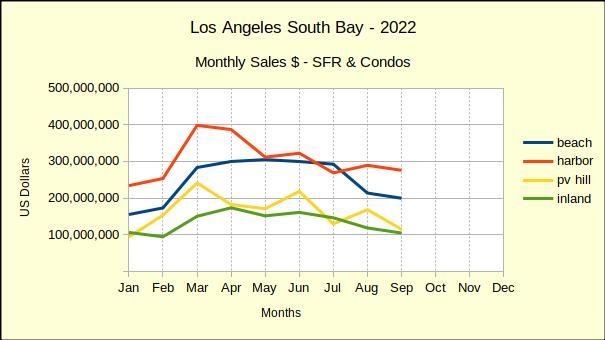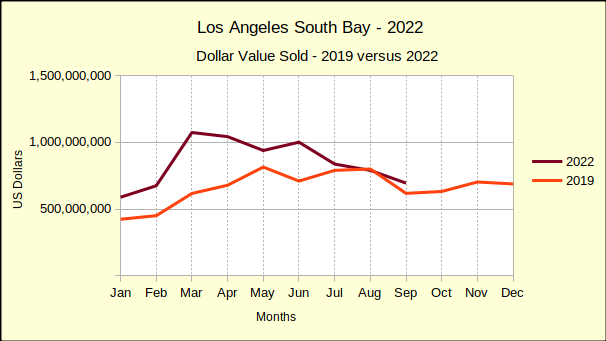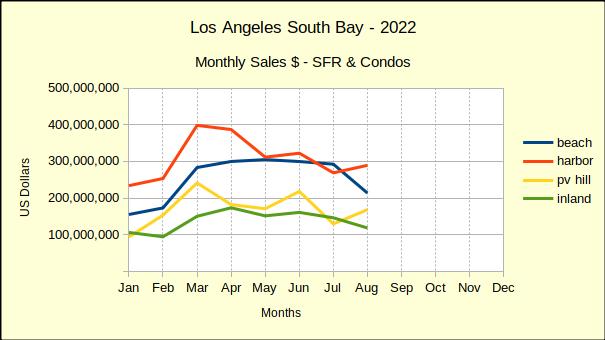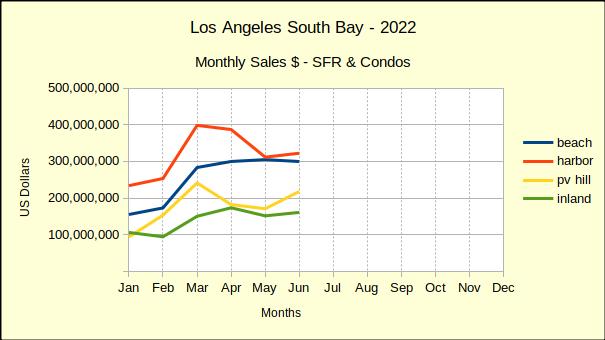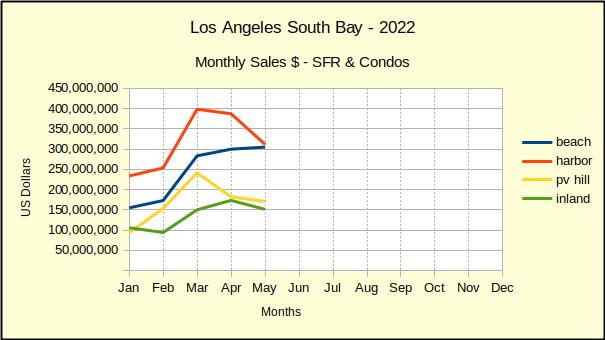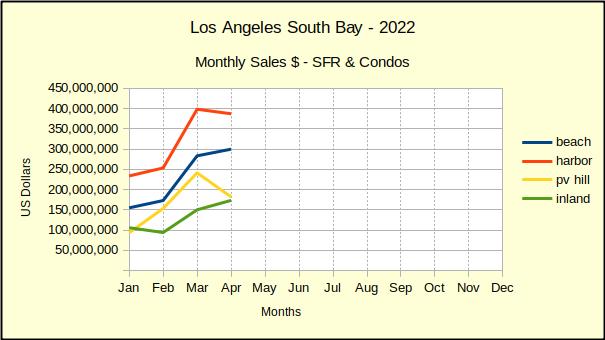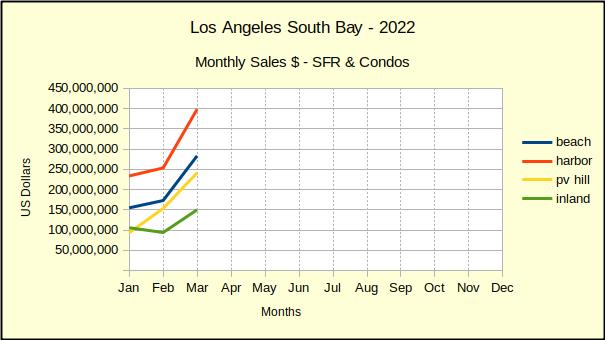
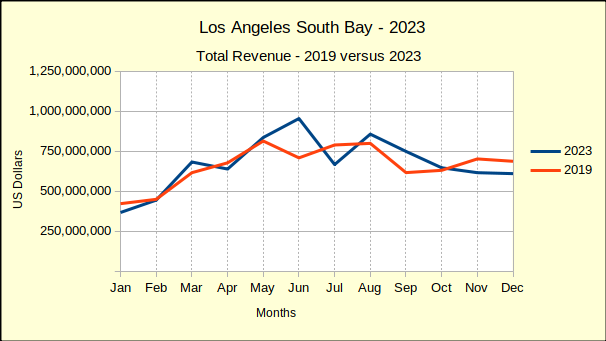
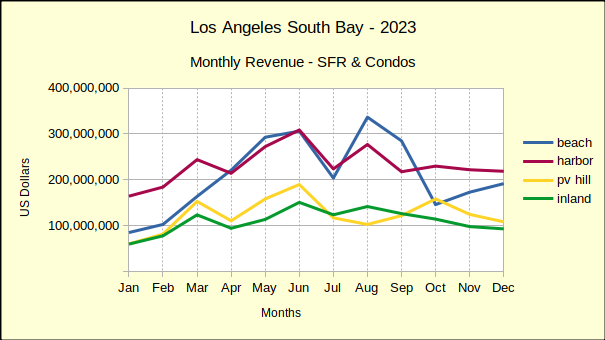
By every measure South Bay real estate failed last year. The volume was down from the prior year in every residential area, the median price fell from 2022 heights everywhere, and the double whammy of crashing sales and falling prices brought the total revenue down from 2022. Judging from early reports the same is true across most of the state.
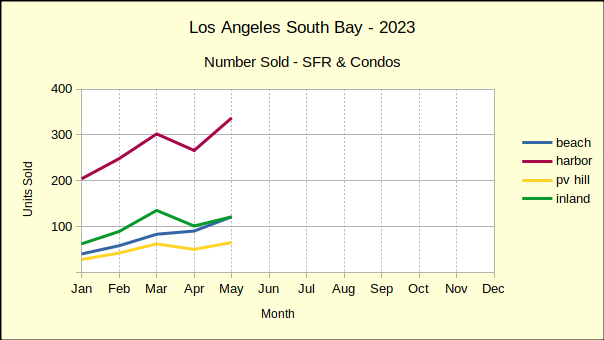
Part of the story doesn’t read so poorly though. As we look back across the year, the second of half of 2023 was far better than the first half of the year. This in two respects: first, the month-over-month statistics for sales volume have improved. The median price is still falling, but that’s to be expected if we’re going to see a sales volume increase concurrent with continued high interest rates. The market is going to demand that some of the “overly enthusiastic” price increases come back down.
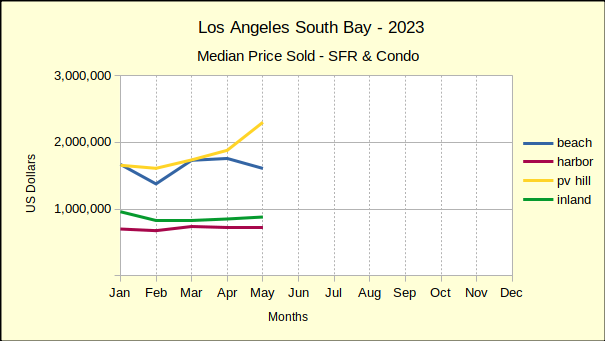
Second, the year-over-year decline in median price is slowing—not reversing—slowing. Roughly speaking, the number of homes sold for less than 2022 prices improved from 83% in the first half of the year to 45% in the second half of 2023. That signifies an approaching balance in the market. Buyers are still holding back, but some sellers are coming forth to meet them.
2024 South Bay Real Estate: Better Days Ahead
We expect to see continued slippage in the median price, accompanied by increased sales volume. The Los Angeles South Bay is somewhat insulated from the vagaries of national and international events, but 2024 is facing an active political climate. The continuing wars around the planet would be enough to rattle economic markets here. This year sellers and buyers also have to factor in a contentious national election.
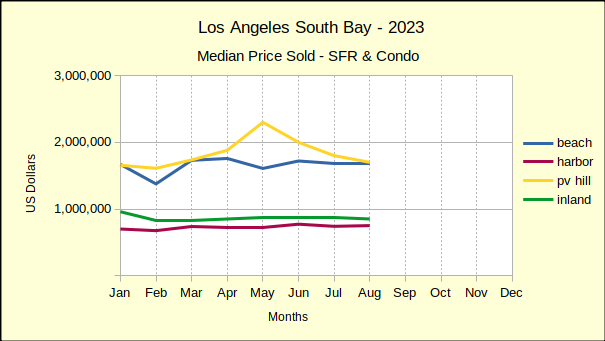
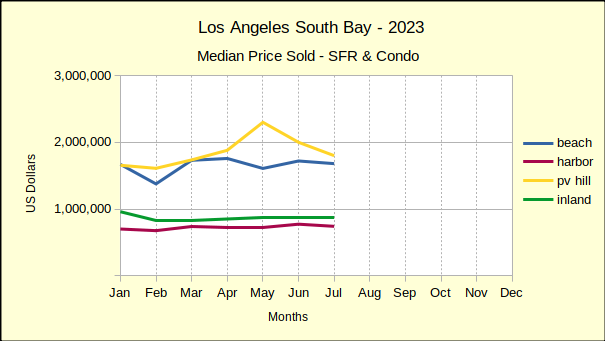
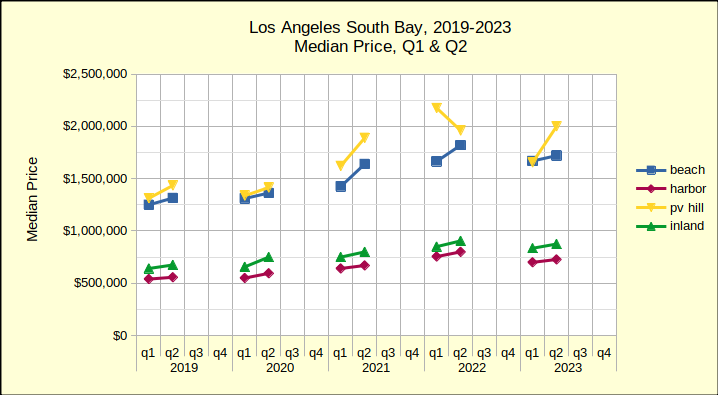
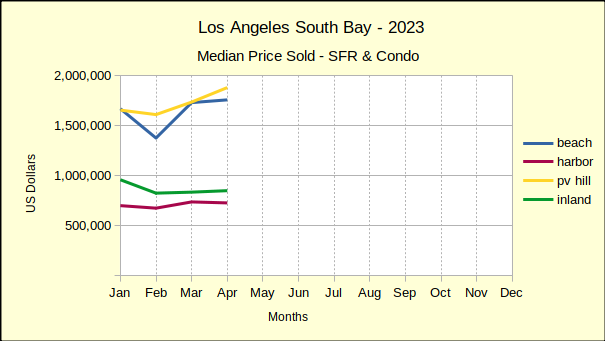
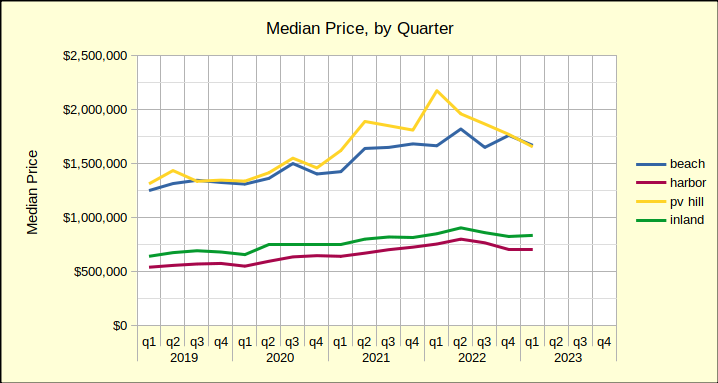
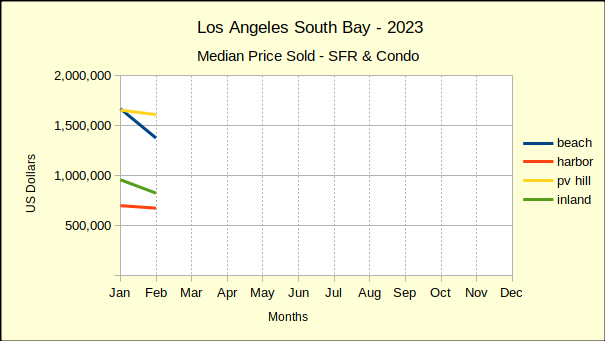
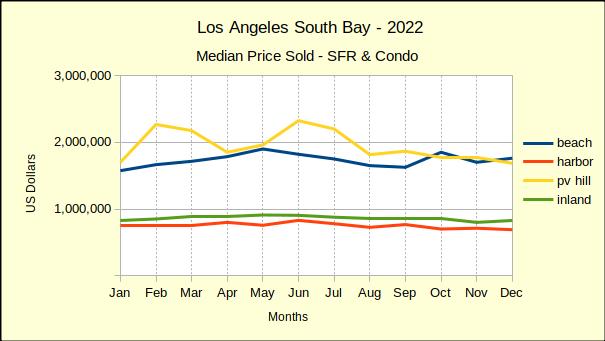
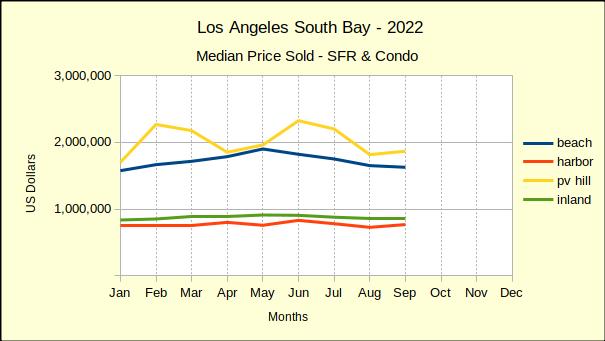
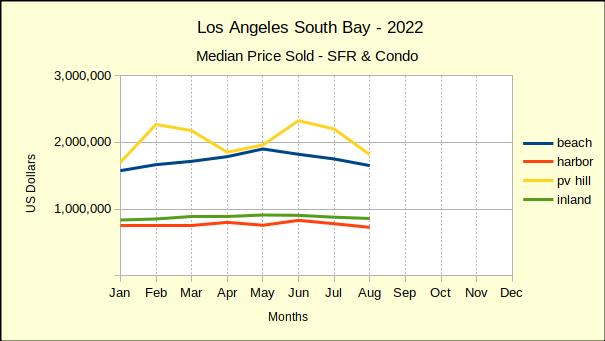
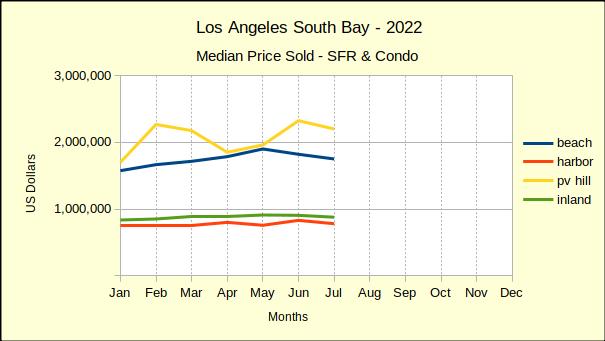
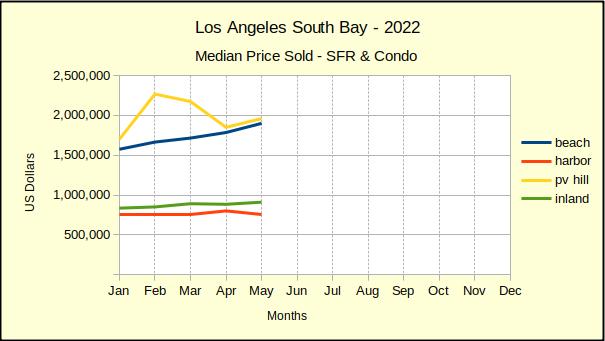
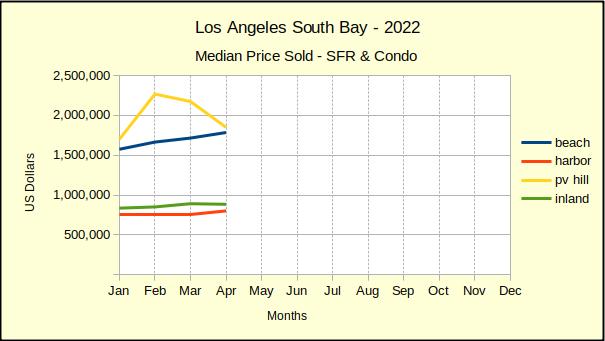
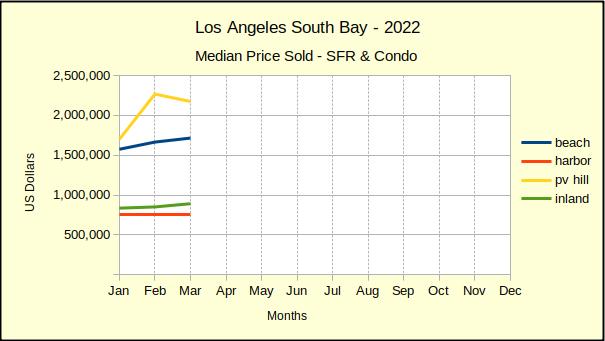
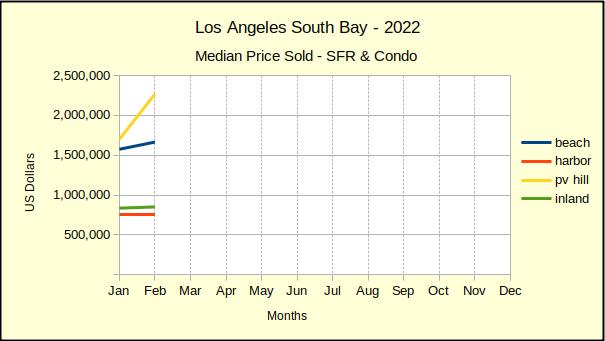
While the Federal Reserve System is officially apolitical, history has shown a tendency for improved economic conditions during election years. The final quarter of 2023 saw a softening of the wild swings in home sales volume and pricing. With less than 10 months until the presidential elections we anticipate continued easing of interest rates and increased sales activity. Median prices have fallen by about 2% across the South Bay in 2023 and probably won’t drop a lot more in 2024.
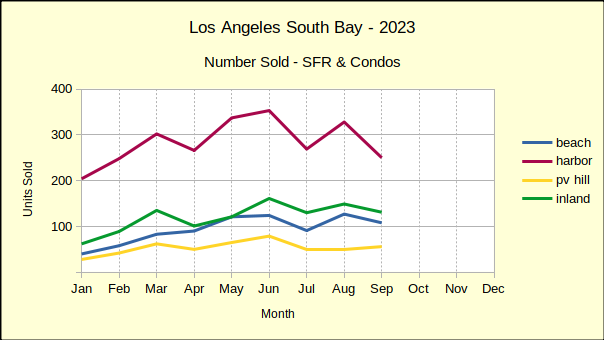
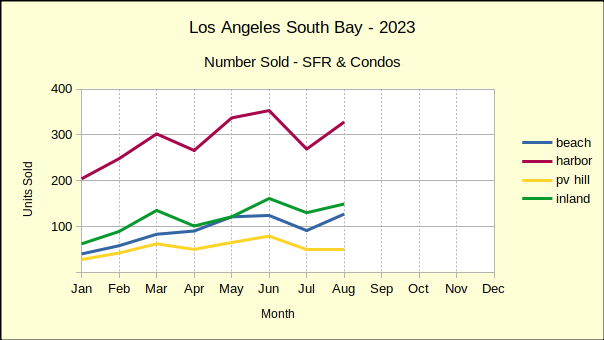
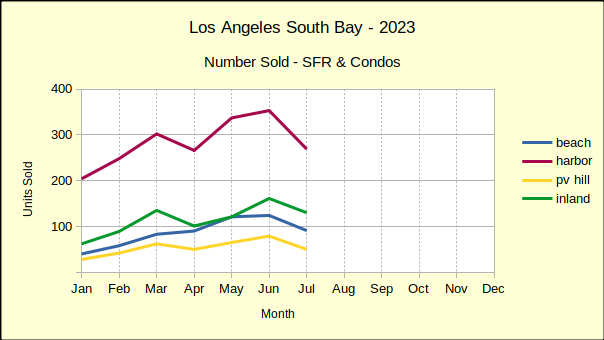
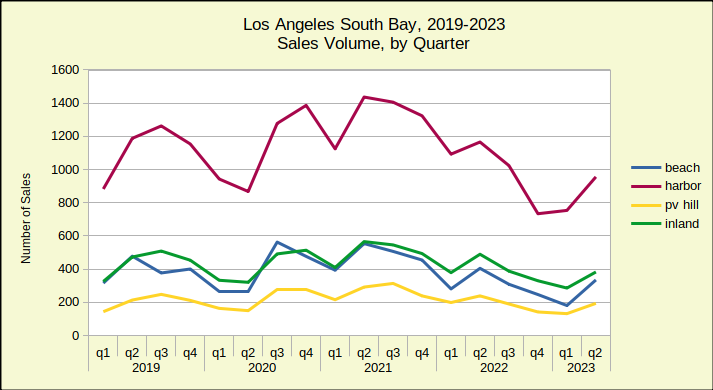
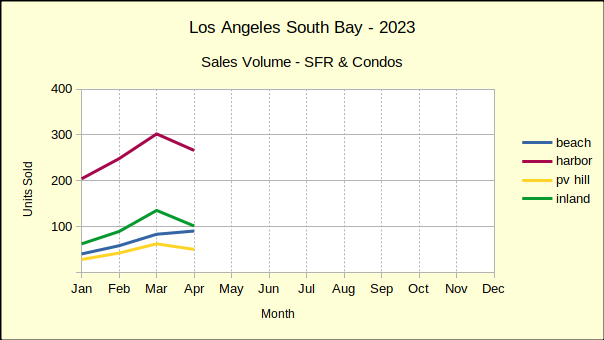
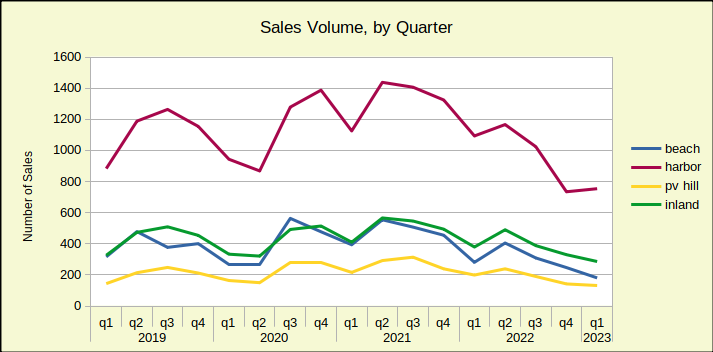
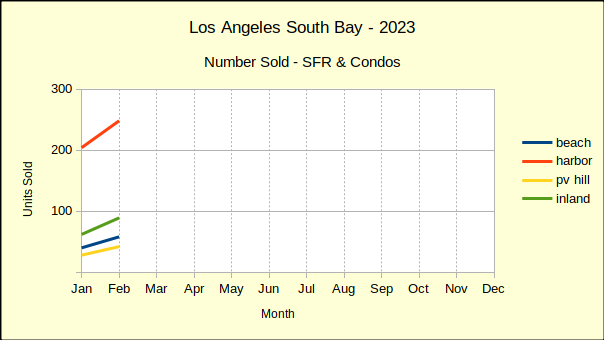
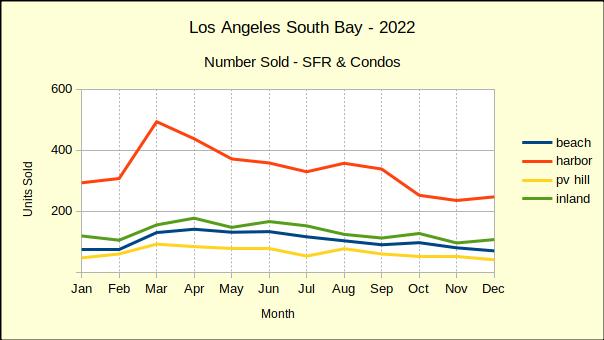
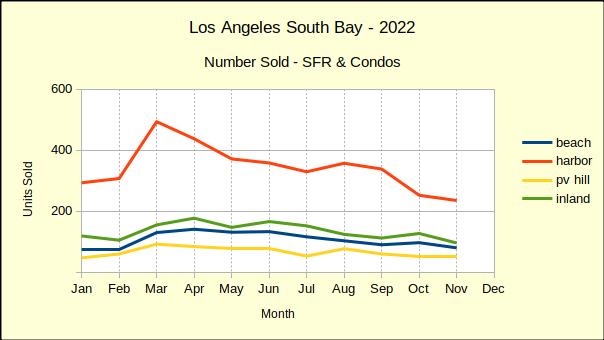
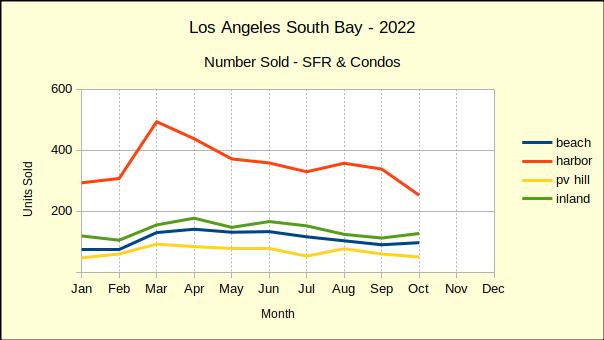
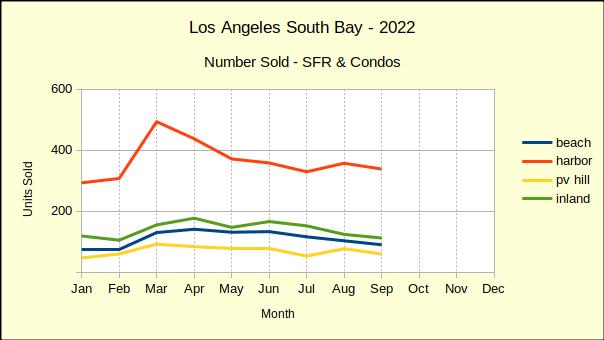
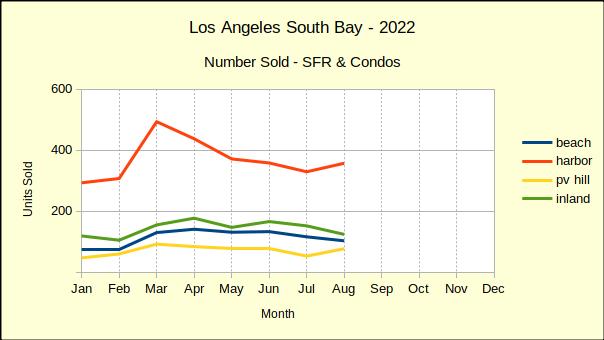
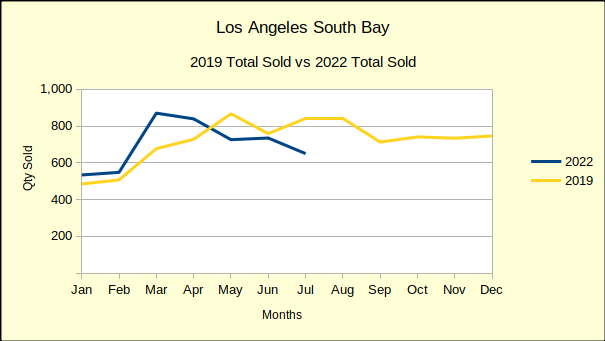
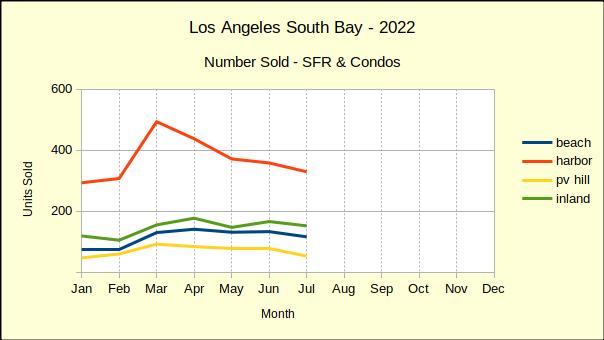
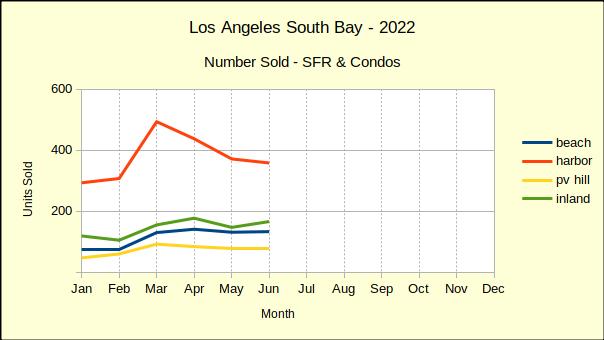
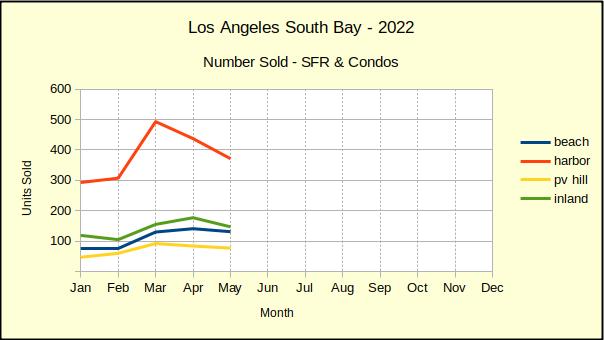
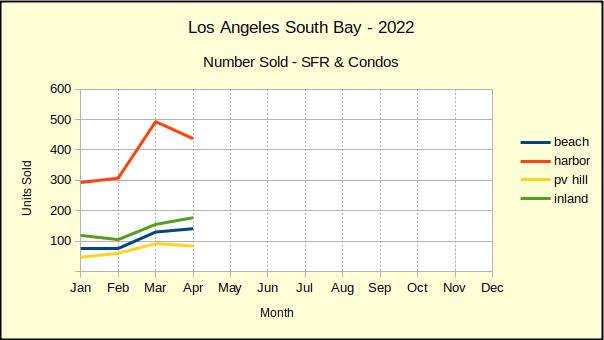
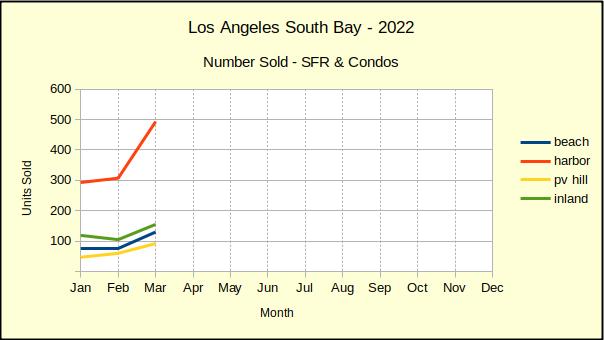
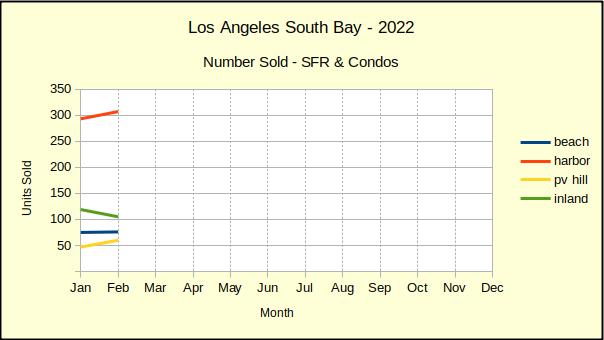
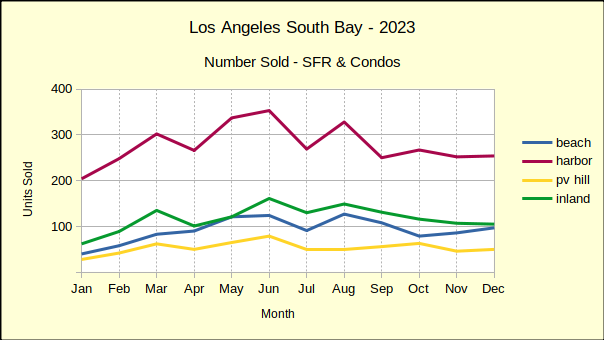
Sales volume fell by 15% across the South Bay in 2023. Nearly all of that drop was in the first half of the year. The new year is expected to be positive with growth in sales across the board.
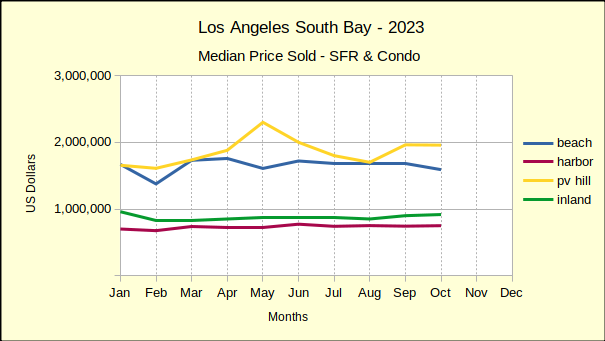
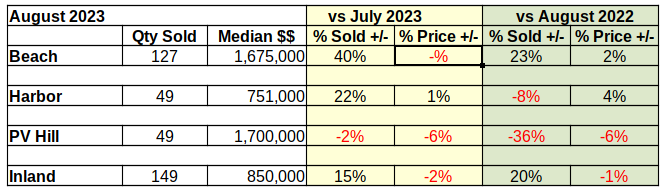
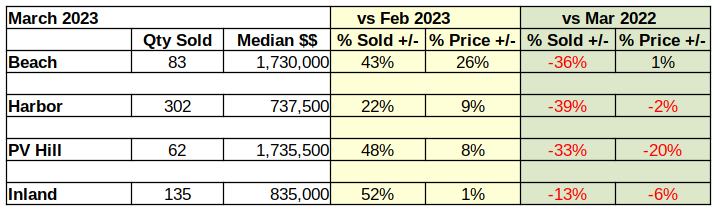
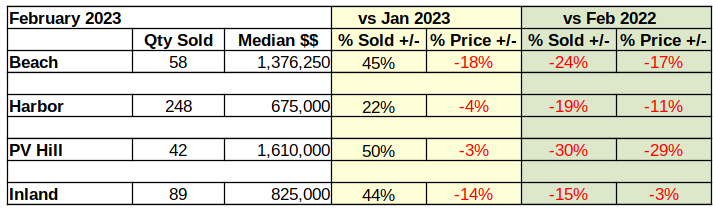
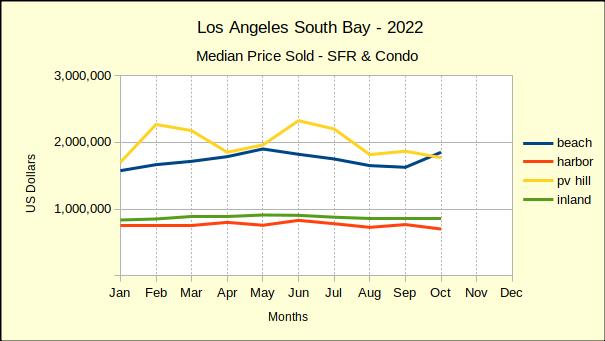
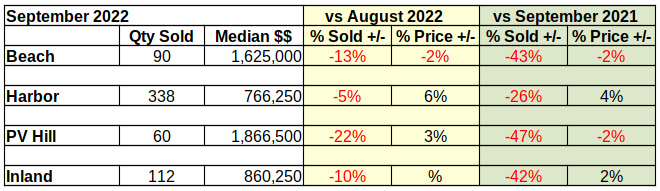
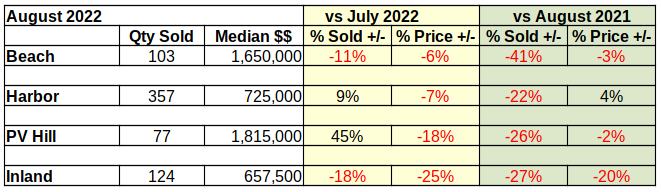
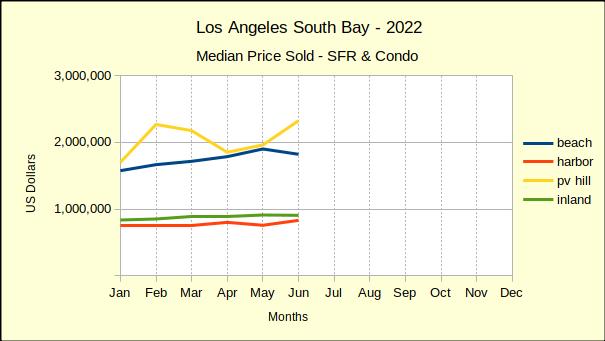
Beach: Strong Sales On Weak Prices
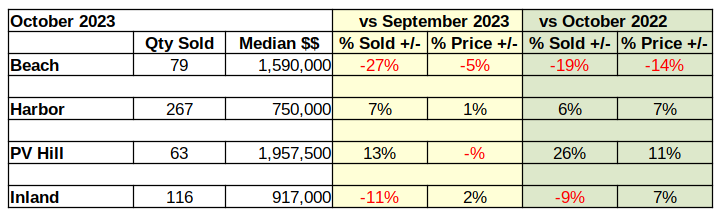
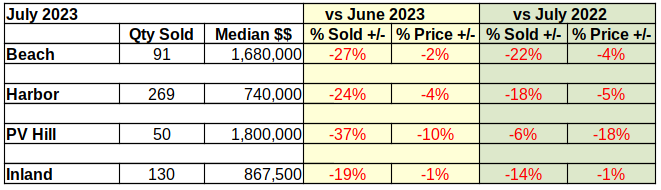
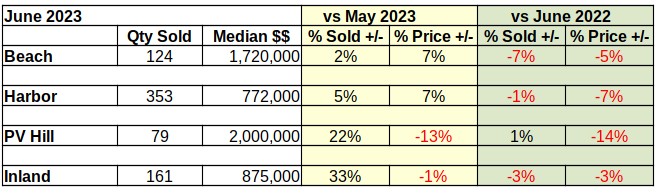
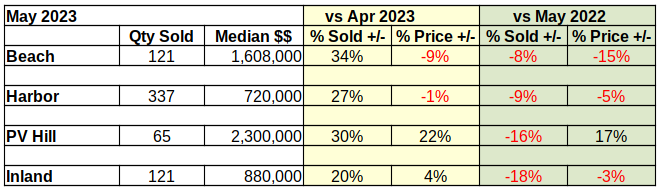
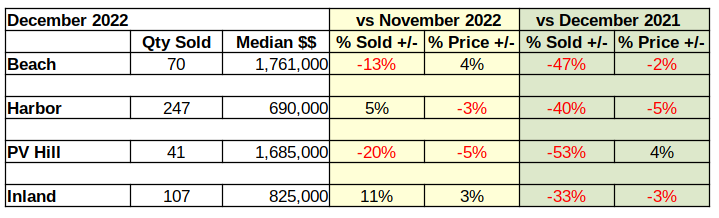
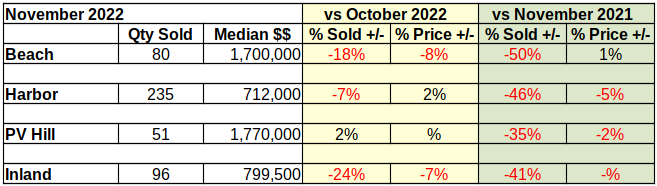
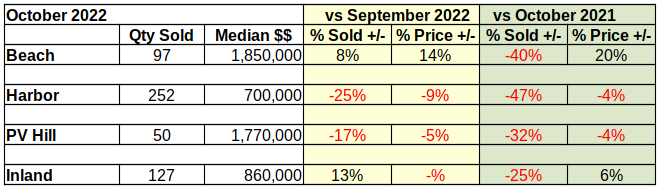
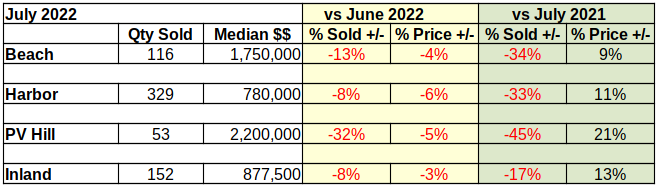
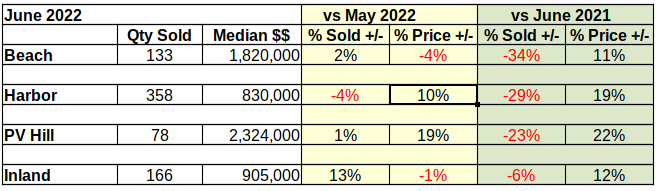
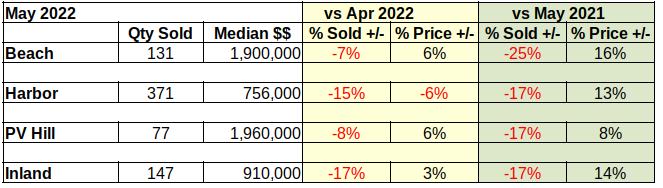
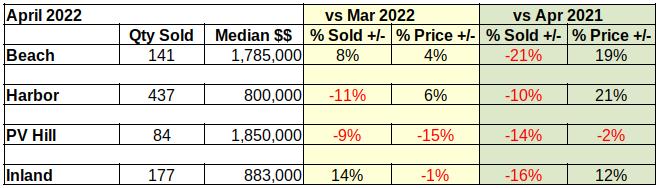
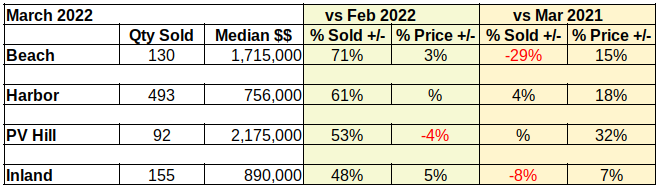
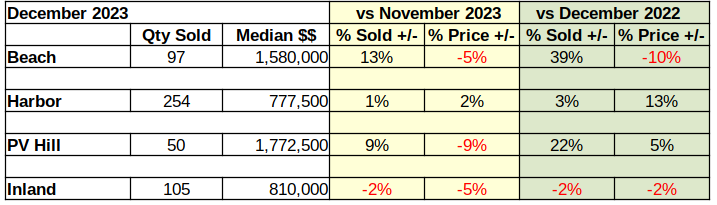
Comparing December to November, the number of homes sold at the Beach was up 13%. That increase in sales is on top of a 9% increase in November, a dramatic turnaround from the 27% drop in October. On the other hand, the month to month median price fell 5% in December.
December of 2023 was similarly mixed when compared to December of 2022. Year over year saw sales volume increase a staggering 39%. Looking back shows December of last year as the absolute slowest month of the year for home sales at the Beach. The median price plummeting by 10% certainly helped generate those December 2023 sales.
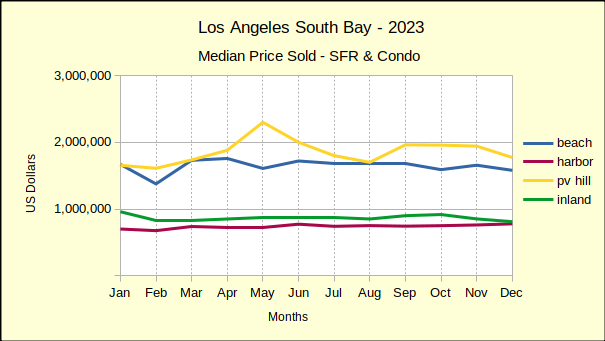
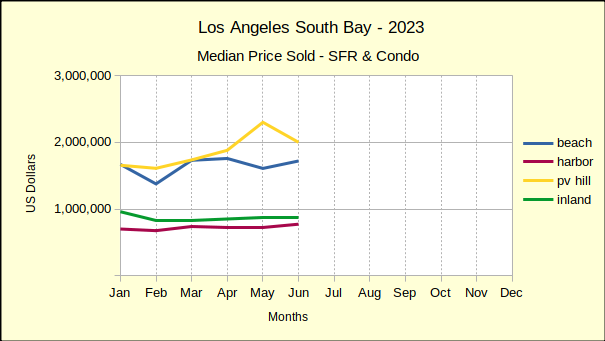
Year to date numbers, comparing all 12 months, showed the number of home sales off by 11%. At the same time the median price was down 4% for the year. Much of the annual decline in sales volume occurred in the first half of 2023, when monthly drops of 25%-35% put the brakes on prices. Beach area median prices have taken steep falls since February 2023. It may take a couple more months before the first stimulating news on the interest rate front, but it would appear we’re looking at the “bottom of the market” now. Regardless of whether you’re a buyer or a seller, this is time to reassess your options.
Harbor: Positive Across the Board
December versus November of 2023 saw sales volume go up 1%. During that time the median price went up 2%. Harbor area homes sales dropped precipitously through the third quarter when they suddenly found strength and were positve in the single digits for the last quarter. Monthly declines in median price have been the order until the final quarter when median prices appear to have leveled out.
Looking from the annual perspective, home sales in December 2023 were up 3% over the last month of 2022. Using the same comparison, median prices were up 13%. This suggests the Harbor area may already be seeing improved stability.
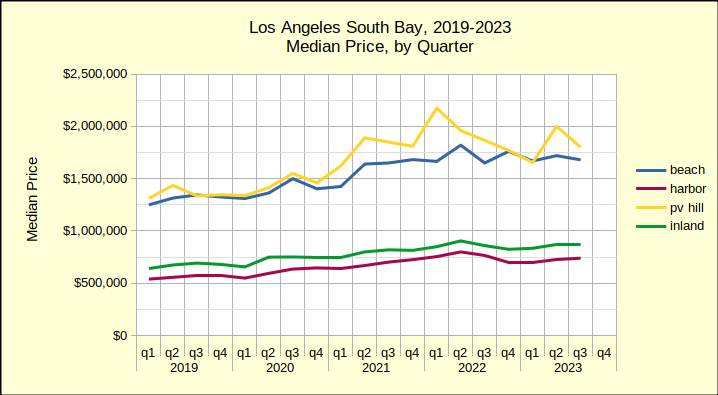
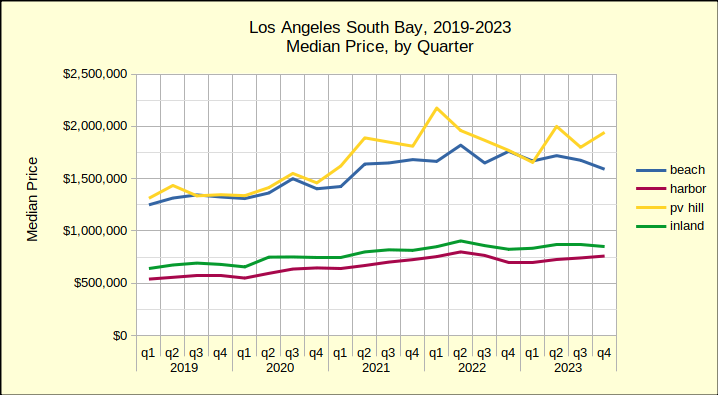
Summarizing 2022 versus 2023 for the Harbor area, overall home sales volume dropped 17% for the year. Looking from a longer term perspective, sales have fallen 26% from the ‘pre-Covid benchmark year’ of 2019. From 2022 to 2023 the median price fell 2%. Again over the longer term, median prices in the Harbor area are up 31% over 2019.
Hill: Median Price Down – Sales Up
December home sales increased on the Hill by 9% over November levels. For the same mnthly period, median prices were down 9%. This pattern is expected to shift over the first quarter of 2024 as prices stabilize and interest rates decline to allow more potential purchasers to enter the market.
Compared to December of 2022, December 2023 came in with sales of 22% more homes and a median price increase of 5%. A solid year over year growth for the Hill.
Taking a step back and looking at the full year, sales volume fell 17% from 2022. At the same time, median price fell only 1%.
Inland: Sales and Prices Still Sliding
The last month of the year brought no relief for the Inland area. The number of homes sold continued to decline with sales down 2% compared to November. The median price was down for the second month, this time 5% for the month.
Looking at the same month last year, gives year over year sales volume down 2%,and a median price that’s down 2%. The final quarter of the year has been a rough adjustment period for the Inland area.
In the broader year over year view, the Inland area again fell, with sales volume down 11%. Median price was flat for the period with a tendency toward negative. It’s a transitional period which should resolve into a firmer picture by the spring of the year.
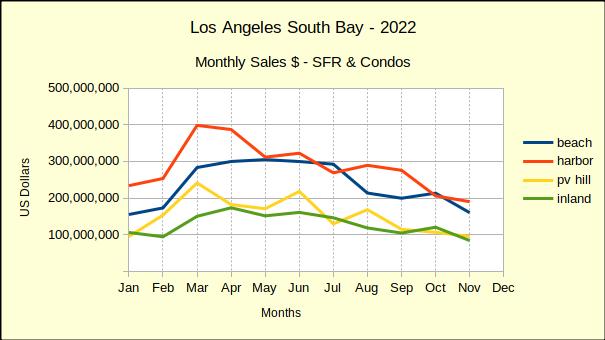
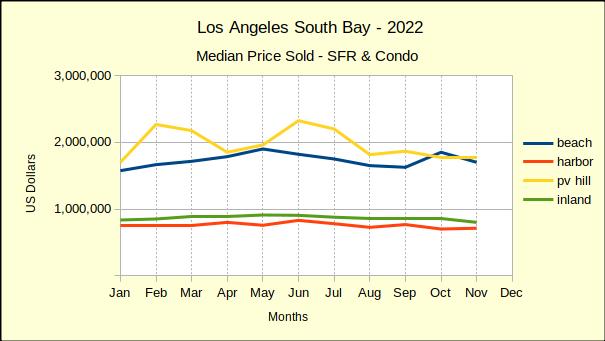
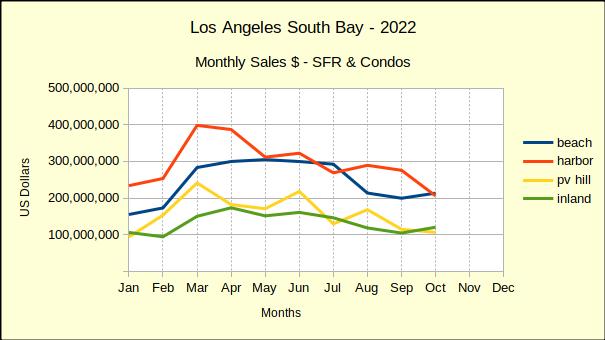
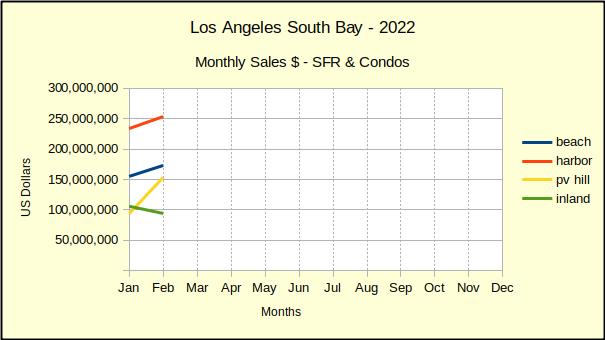
Beach=Manhattan Beach, Hermosa Beach, Redondo Beach, El Segundo
Harbor=Carson, Long Beach, San Pedro, Wilmington, Harbor City
PV Hill=Palos Verdes Estates, Rancho Palos Verdes, Rolling Hills, Rolling Hills Estates
Inland=Torrance, Lomita, Gardena
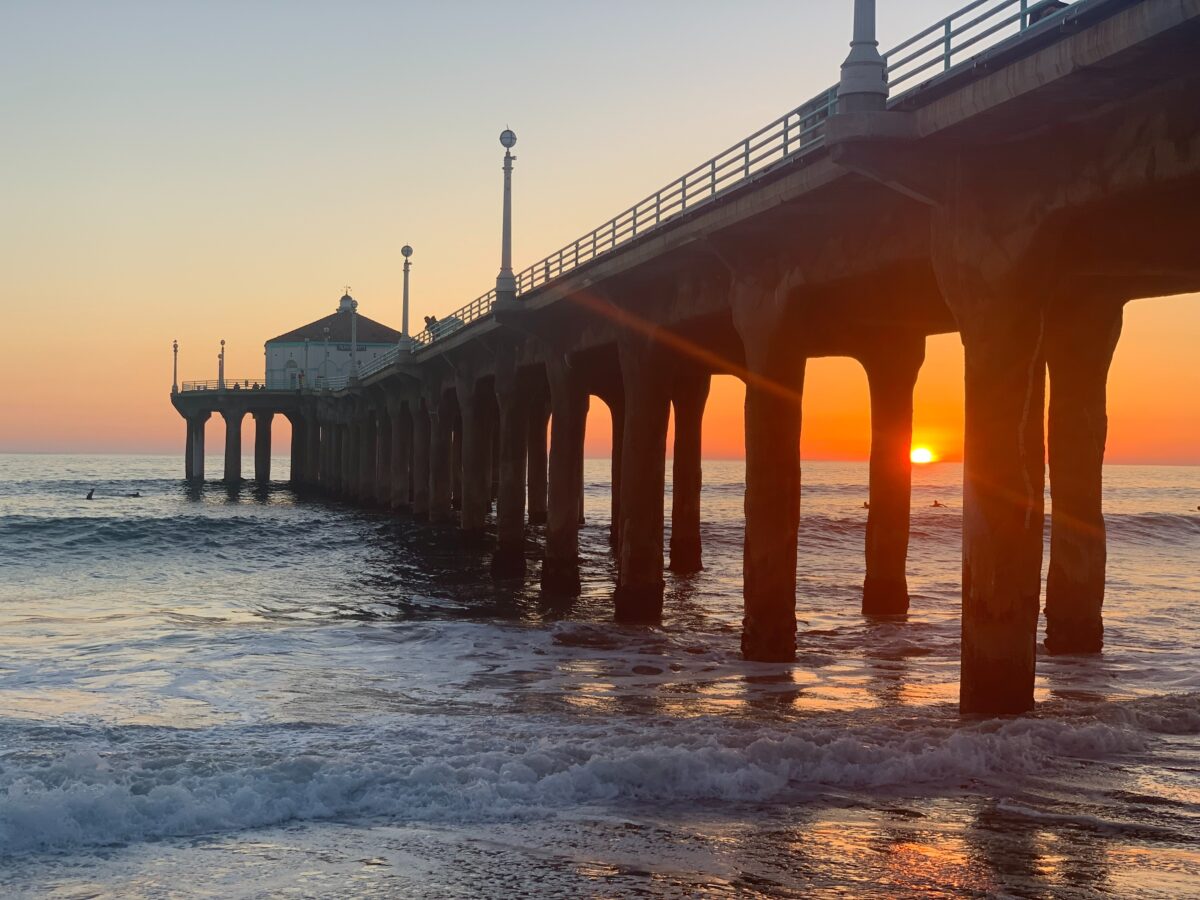
Photo by frank mckenna on Unsplash