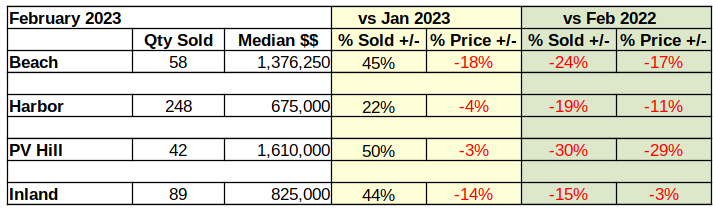
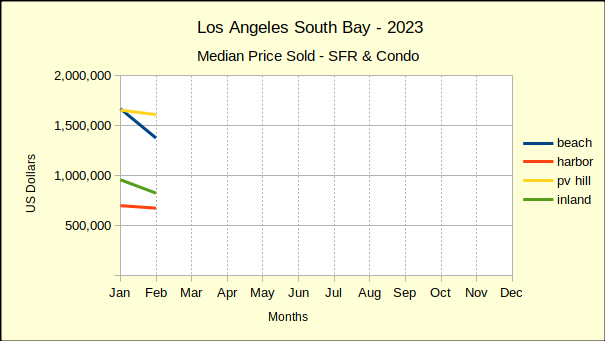
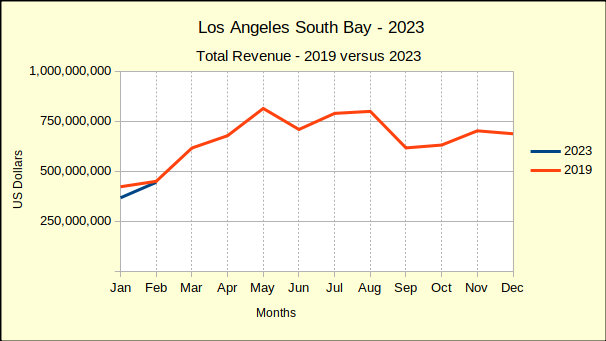
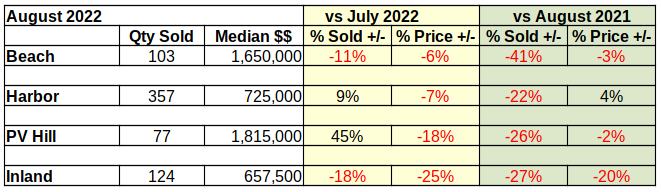
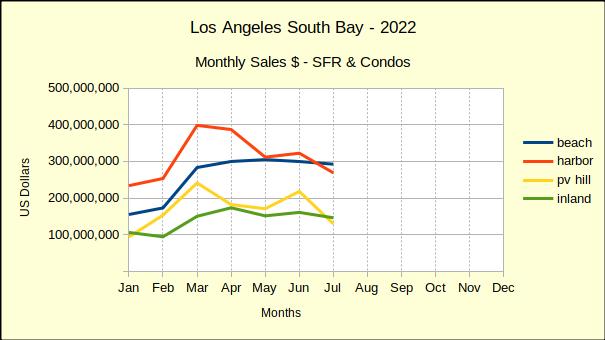
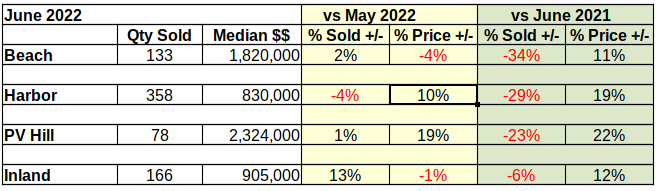
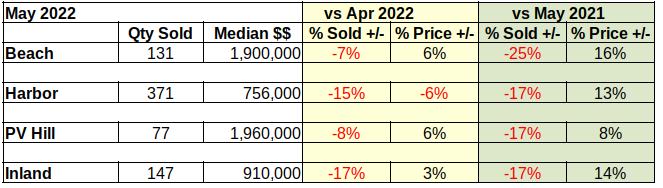
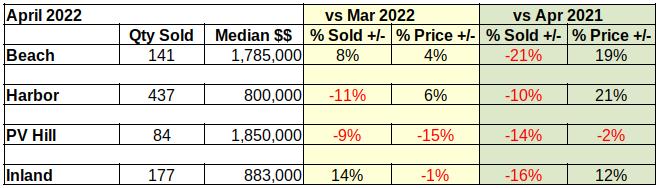
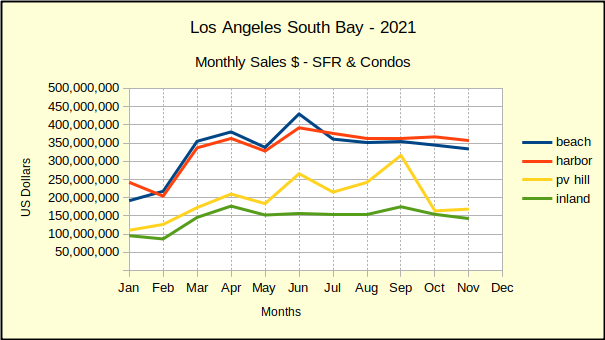
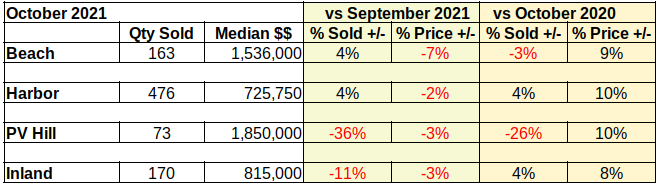
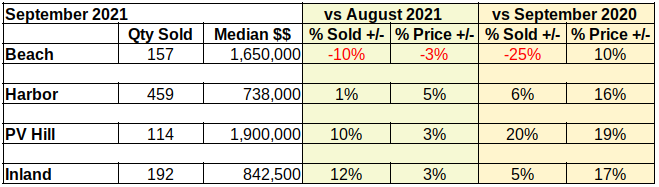
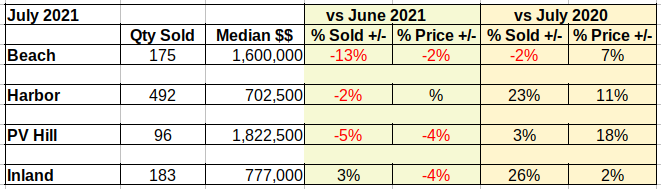
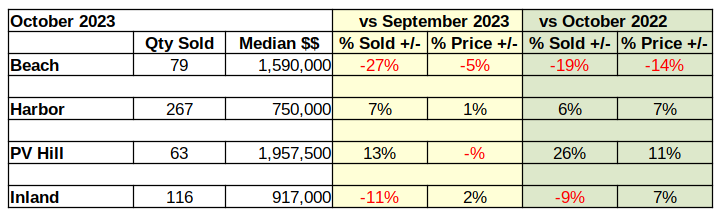
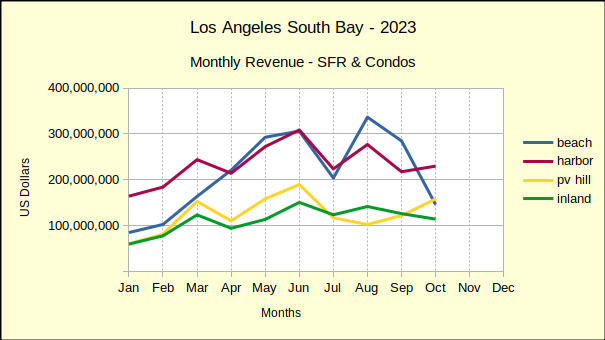
Home sales on the Palos Verdes Peninsula chalked up an impressive set of statistics in October. Comparing the October 2023 sales to October of last year showed a stunning 26% increase in sales volume beside an equally impressive 11% increase in median price. At the opposite end of the spectrum the Beach Cities October sales volume fell 19% from 2022, while the median price dropped 14%.
Elsewhere across the Los Angeles South Bay volume and prices were mixed with the general trend leaning toward decreased number of homes sold and prices struggling to stay level with last month while often slipping below.
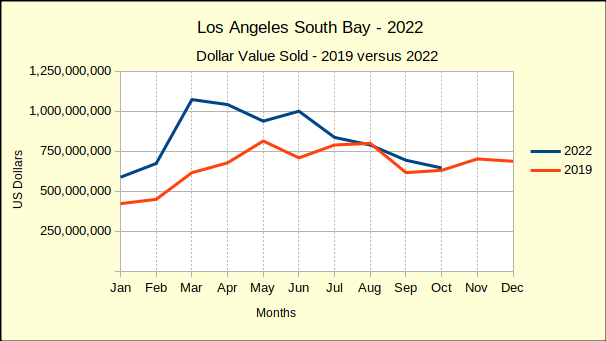
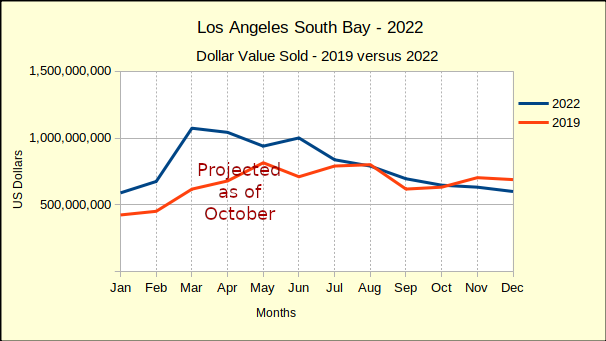
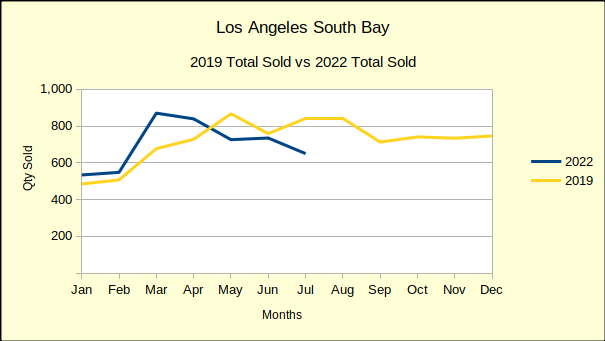
Year To Date Sales Continue to Drop
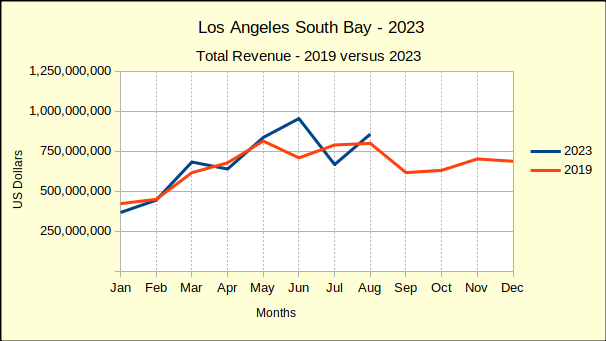
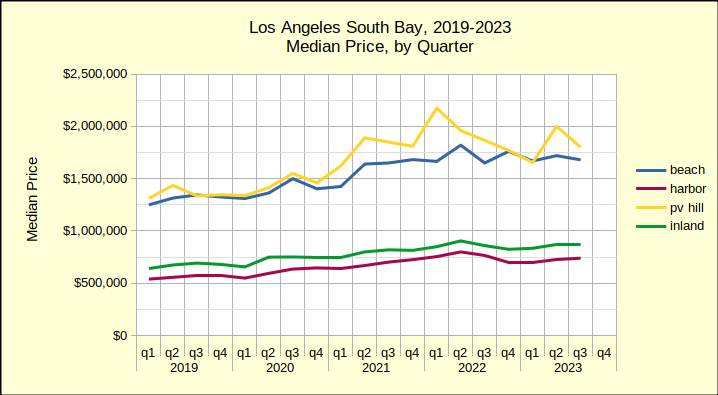
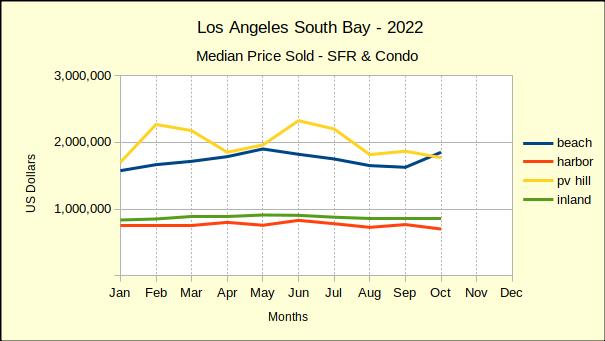
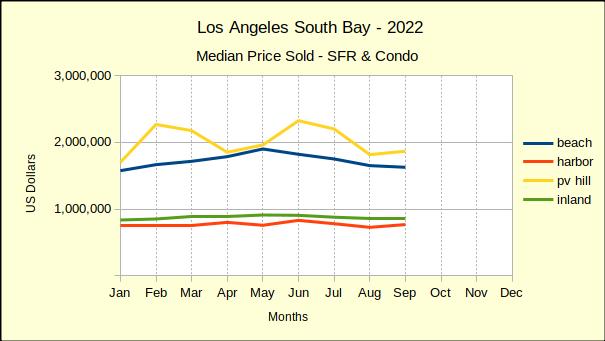
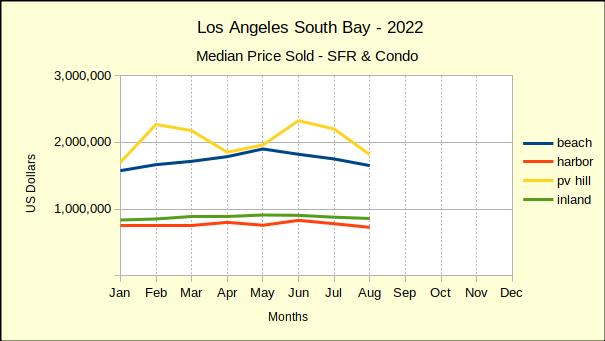
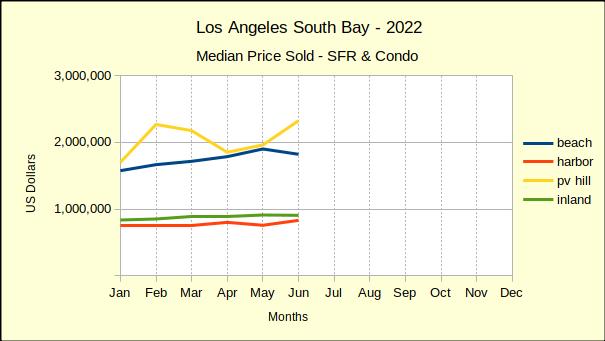
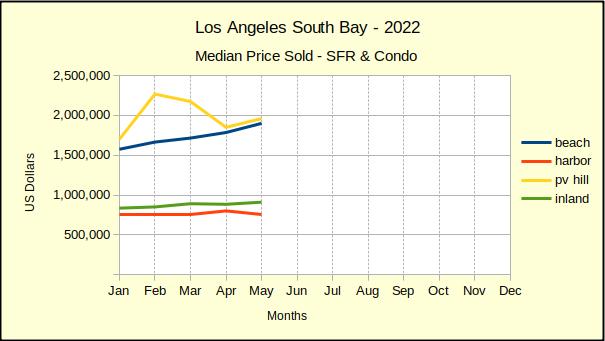
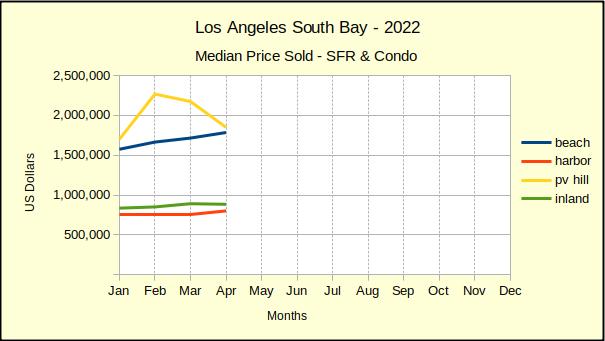
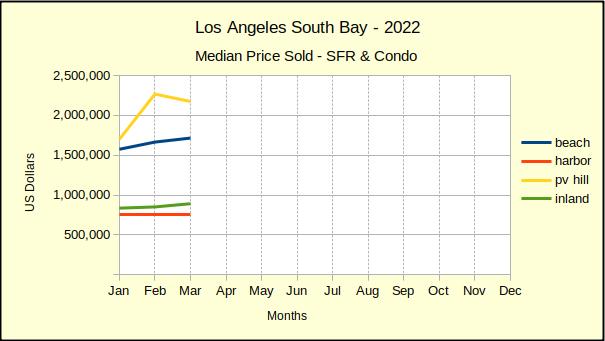
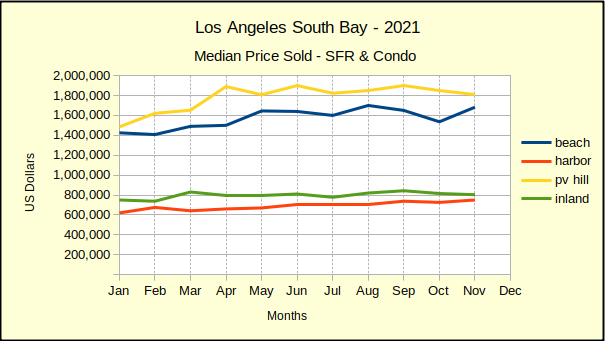
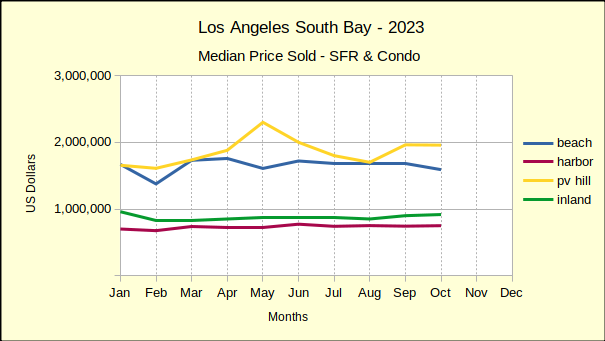
In between the highs and the lows real estate activity in the South Bay has been mixed for the months of August through October. While many commentators are cautiously hopeful, it must be noted that year to date comparisons continue to show significant declines in the number of homes sold, with an average drop of 18% from 2022 for the first 10 months of the year. Likewise, median prices are falling for the January through October time frame. For example, median prices on the Hill were up in October, but have fallen 4% year to date compared to last year. Similarly the Beach area median is down 3% and the Harbor area is off 2%.
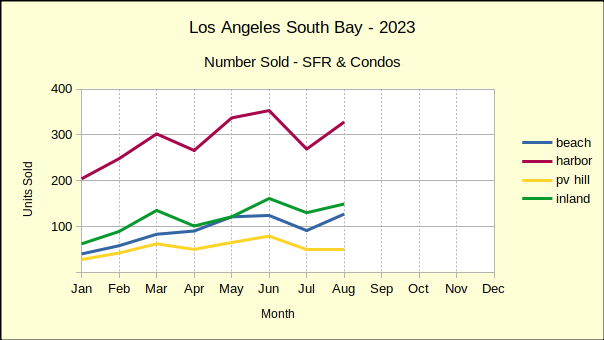
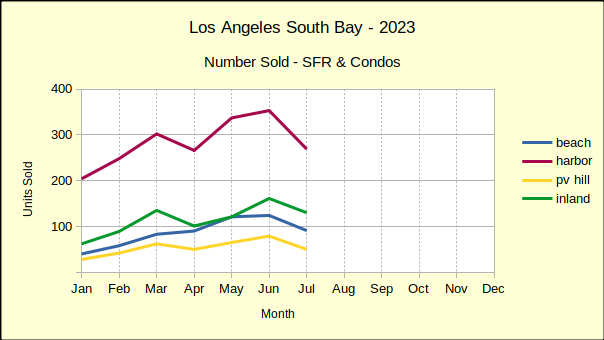
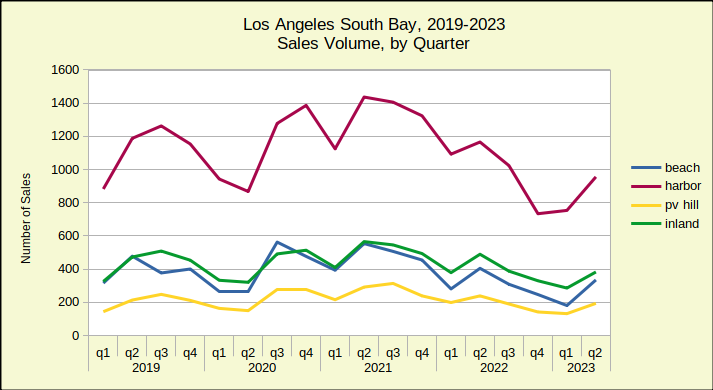
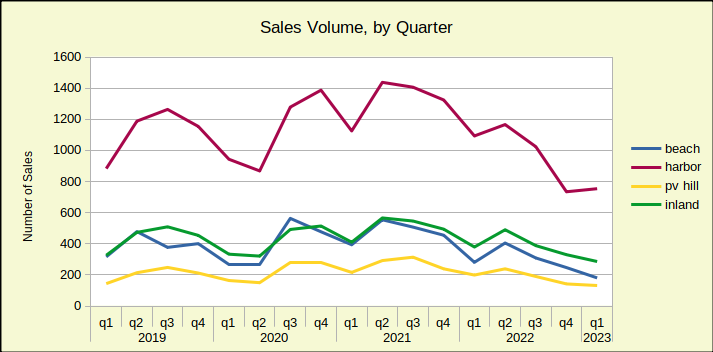
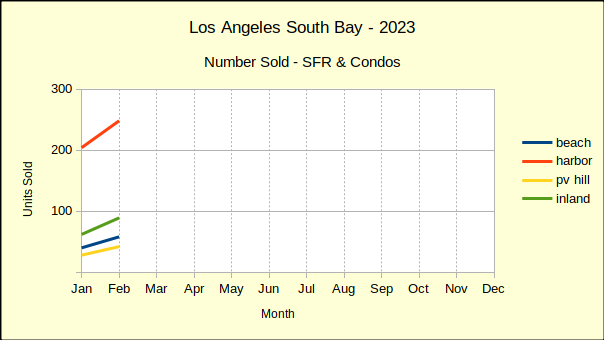
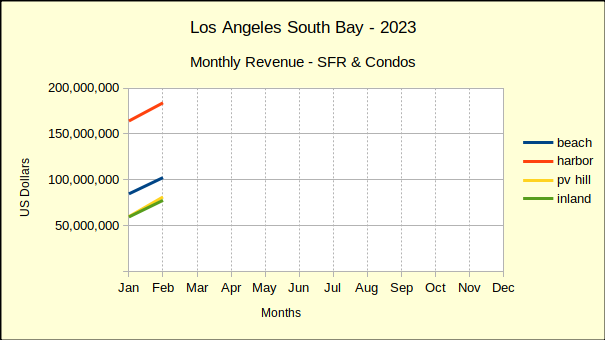
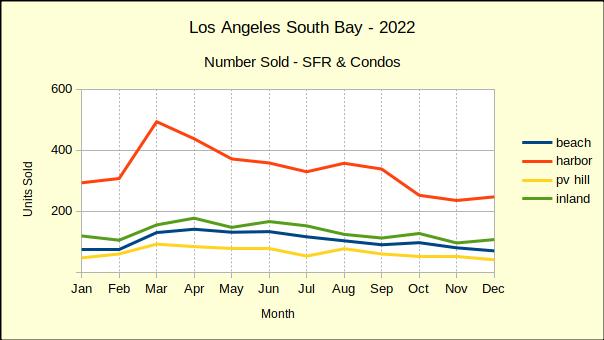
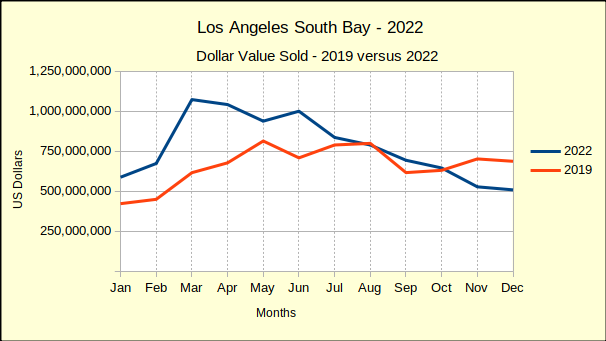
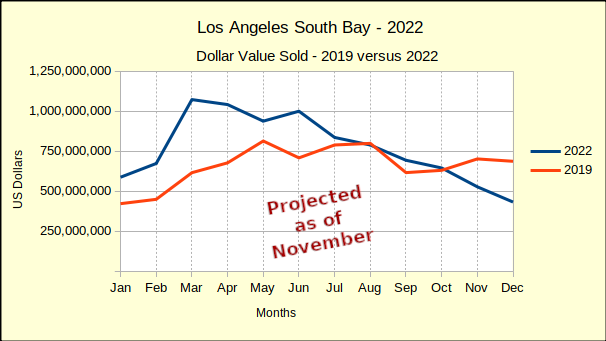
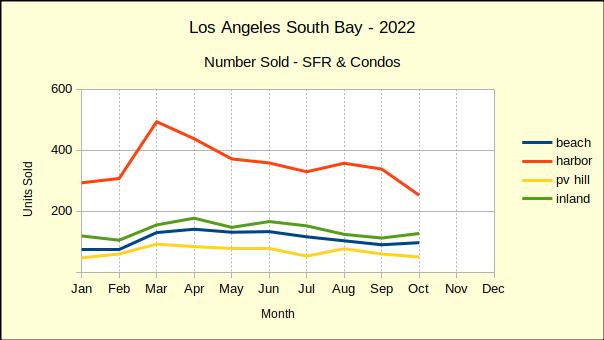
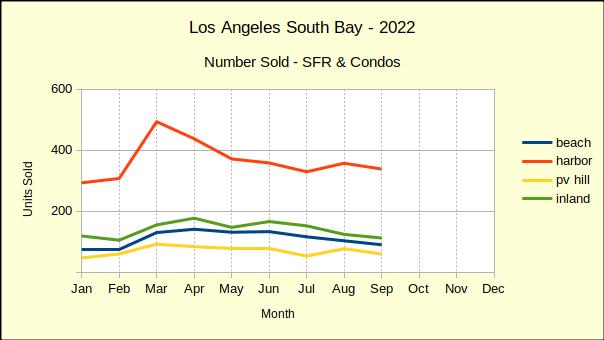
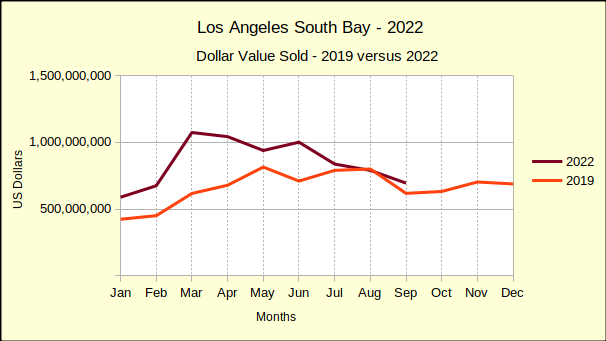
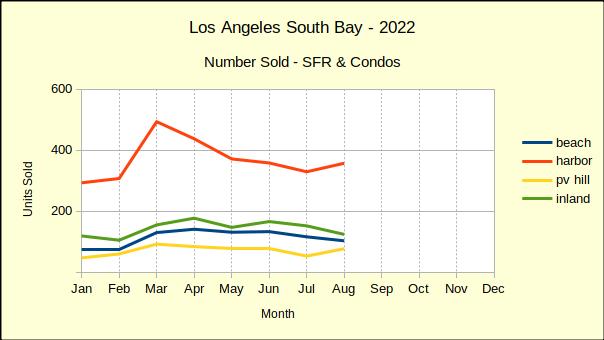
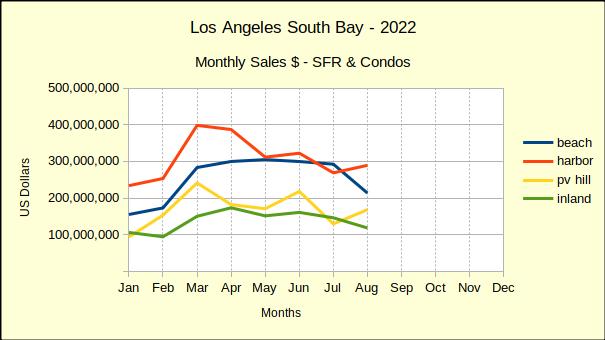
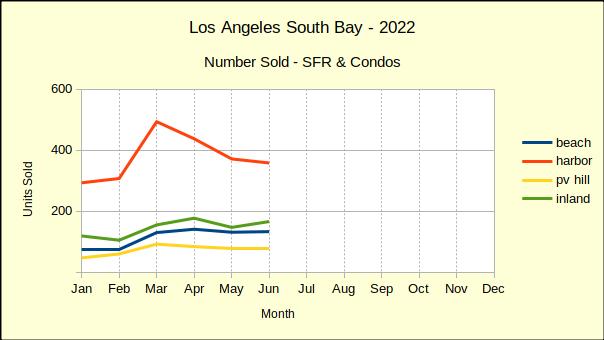
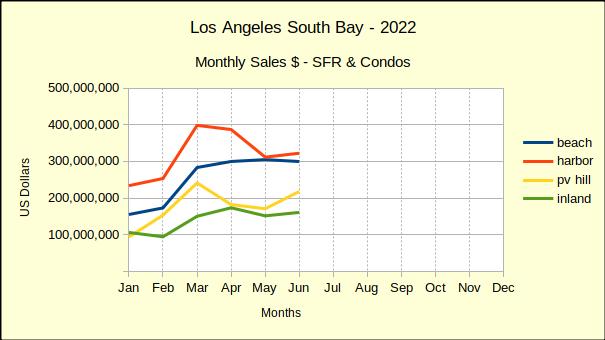
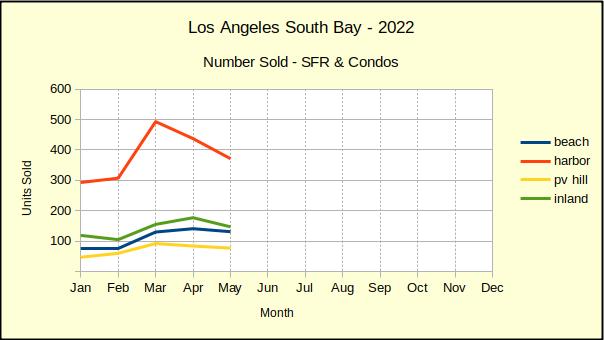
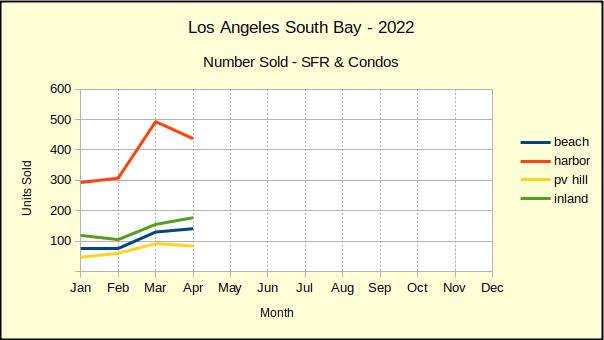
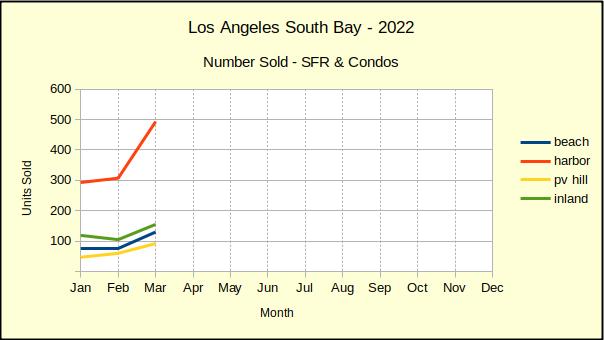
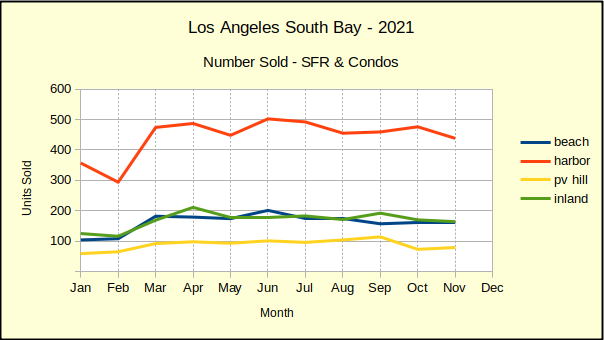
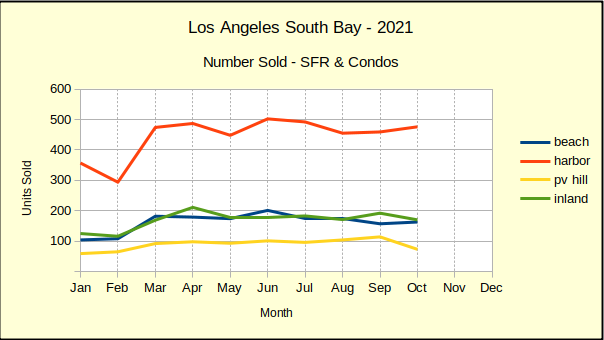
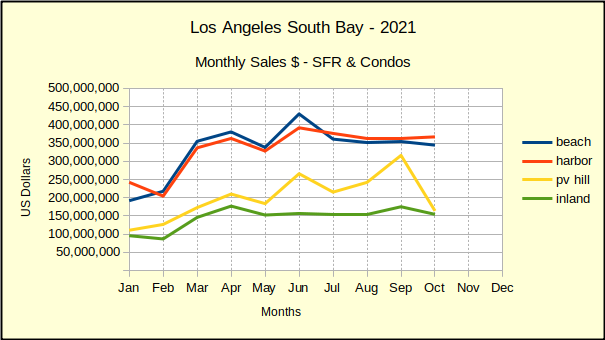
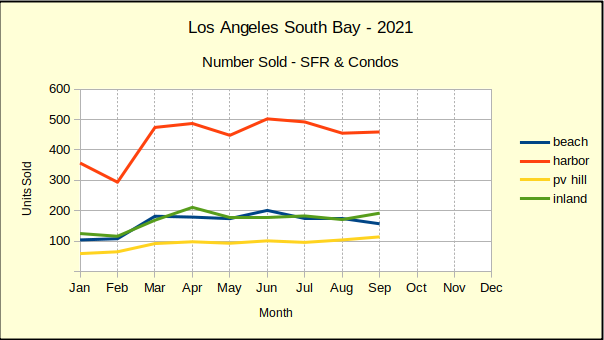
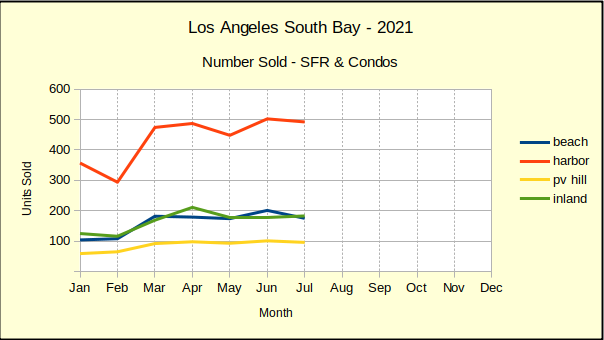
Sales volume is clearly down. By this time in 2022 sales were at 6700 units versus 5500 this year. Many buyers have been “priced out of the market” and many sellers are resisting the idea of “prices going backward.” The result has been a lot of deals not being made.
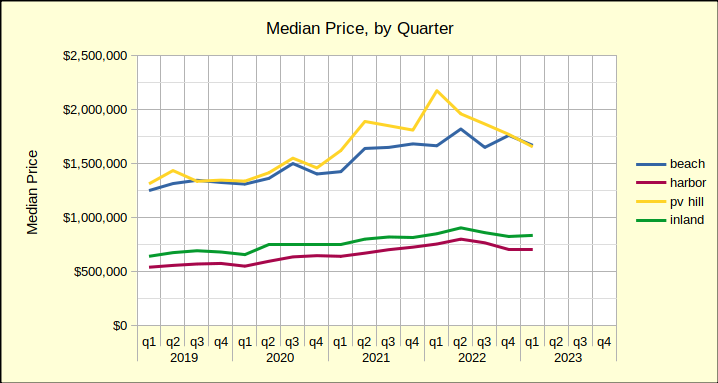
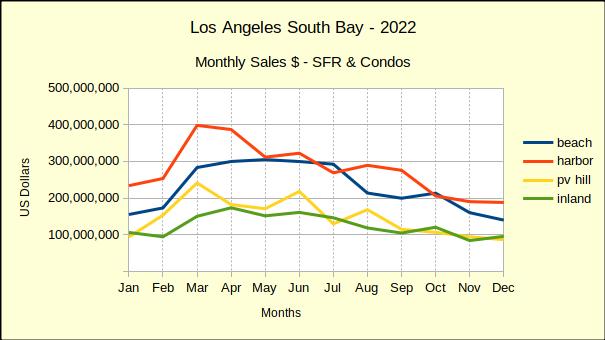
Year to date, the deals that have been consummated are still generally at median prices above last year, however the most recent three months have shown at least half of sold homes required price reductions to make the sale. With winter setting in, we expect continued reductions in both the volume of sales and in the prices of sold homes.
Home Sales at the Beach Hit a Wall
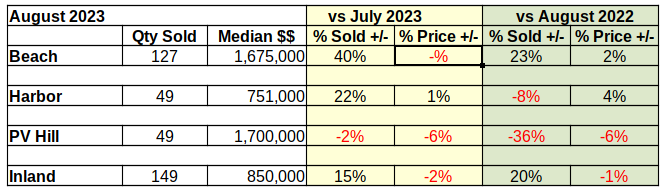
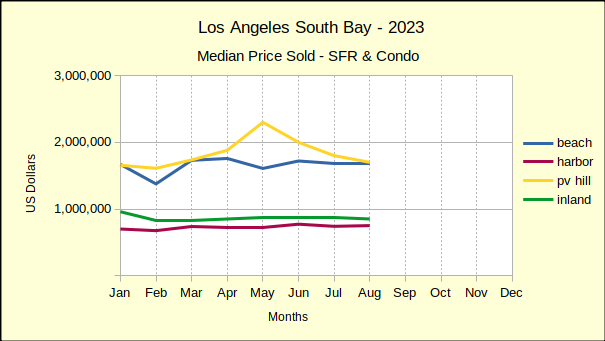
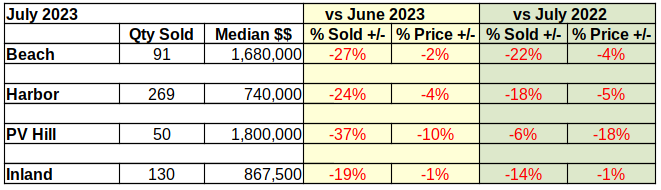
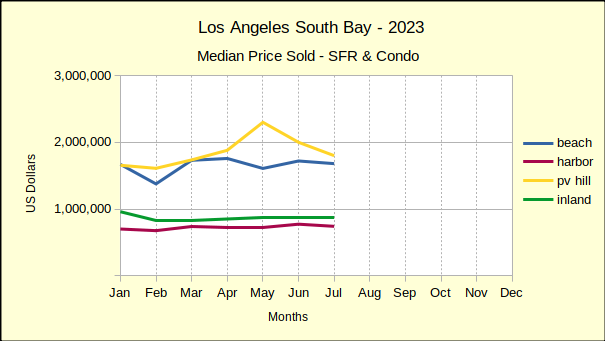
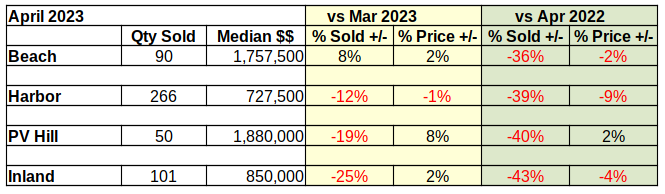
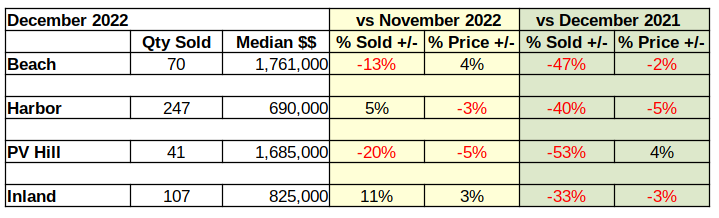
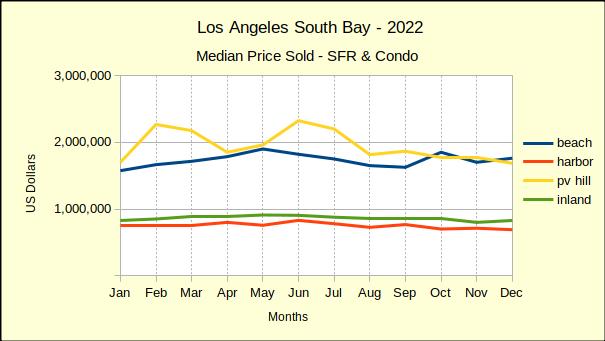
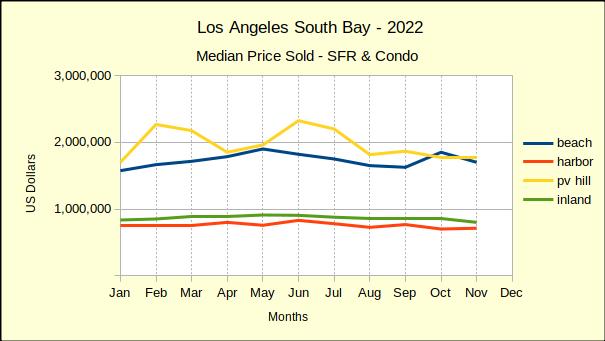
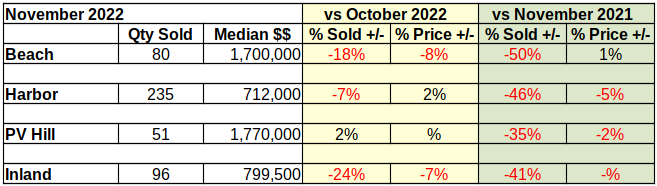
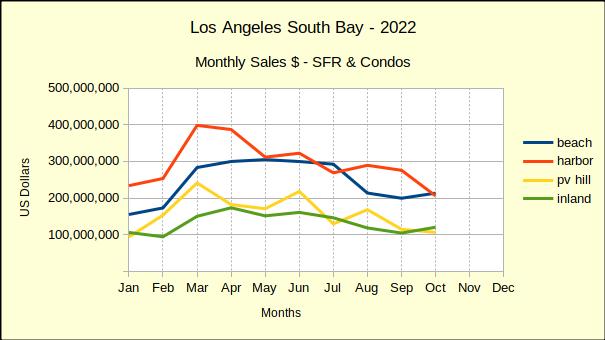
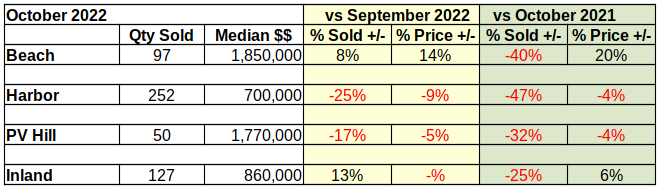
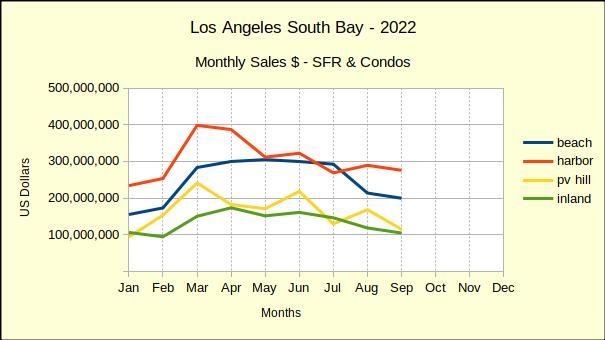
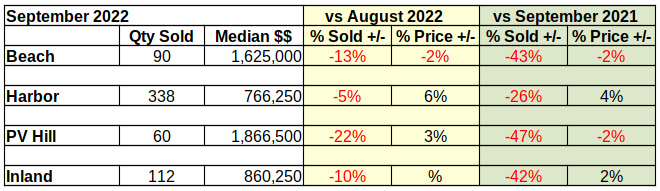
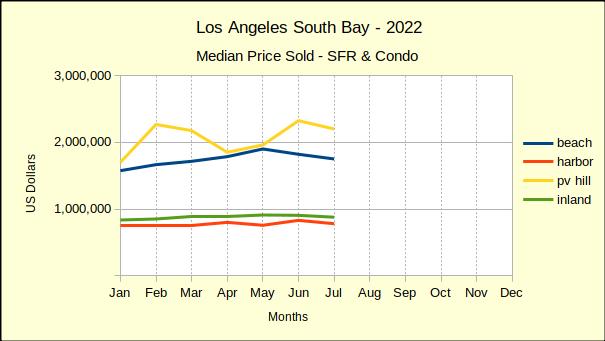
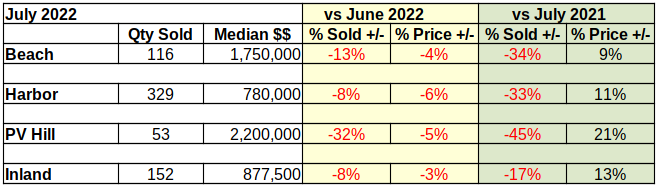
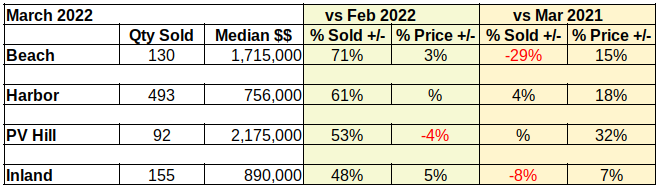
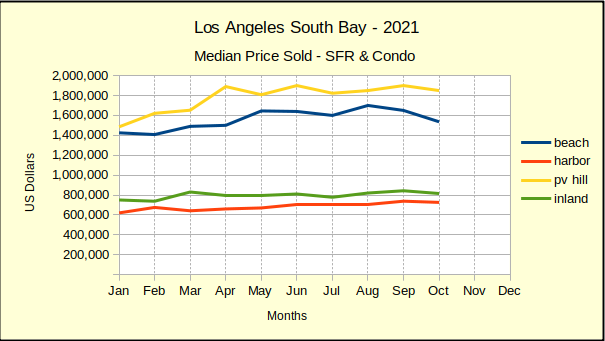
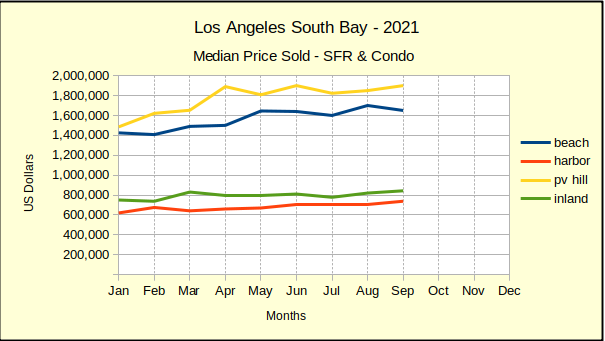
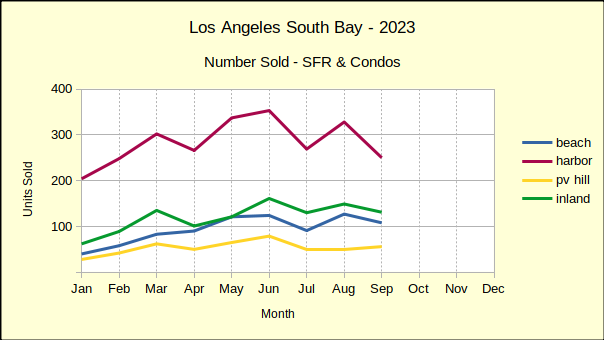
Throughout the year real estate in the Beach Cities has maintained spotty growth. Sometimes median prices improved, sometimes sales volume. But, October brought a wall of red ink for the Beach. Month over month sales volume plummeted by 27%, while the median price dropped 5% from September when it was flat at $1.7M.
Year over year transaction volume dropped 19% from September of 2022. The median price fell 14% for the same period.
Looking at the year to date statistics showed more declines with sales volume for the first 10 months of 2023 coming in 16% below that of 2022. At the same time, the median price was off by 3%.
In prior downturns the Beach area has been among the last to respond to market negativity and one of the first to recover. If the pattern repeats, sales at the Beach will continue to show predominately negative numbers for the late fall and winter months. Most chroniclers project a return to positive market conditions in late 2025 or early 2026 in general.
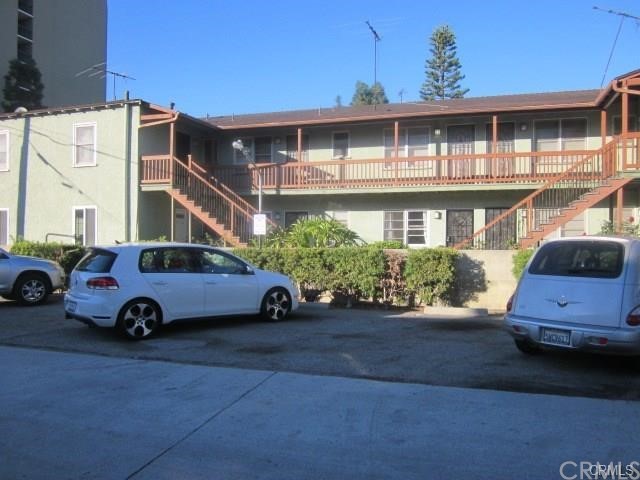
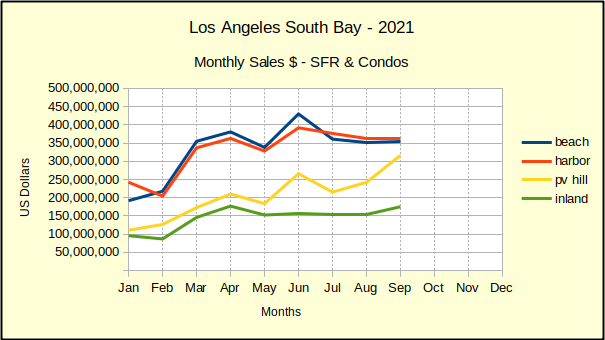
Harbor Volume and Prices Turn Upward
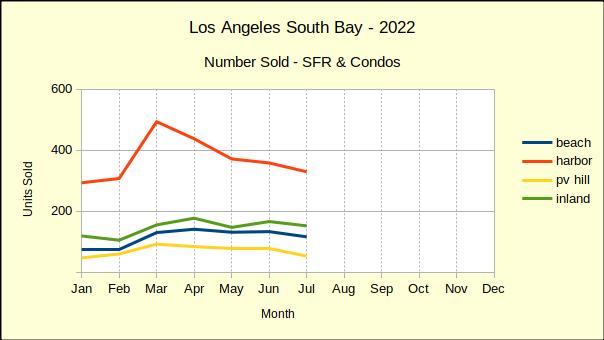
Home sales in the Harbor area moved from all negative last month to mostly positive this month. Sales volume on a monthly basis jumped from 24% down in September to a 7% increase in October. Similarly, the month to month median price went from -1% to +1% in October.
Annually, the number of homes sold in the Harbor area increased by 6%, a significant change from having fallen 26% in September. The median price came in at $750K, up by 7%.
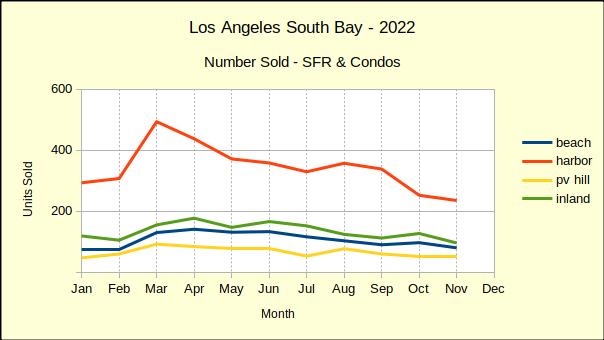
That’s only the second time this year the Harbor area median price has come up into the positive range when compared to 2022. Overall, the year to date median sits at $739K, 2% below last year’s number of $756K. Sales volume for the Harbor is off 20% year to date. The number of homes sold for the first 10 months is 2824, compared to 3535 in 2022.
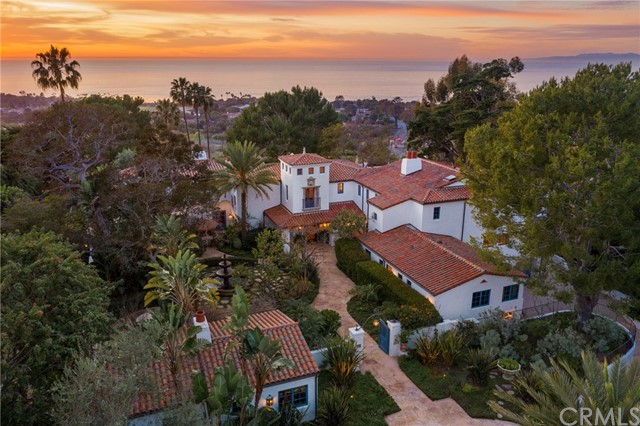
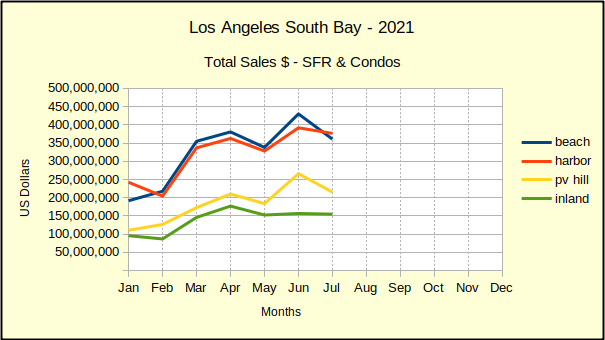
Palos Verdes Homes Star in October Sales
Home sales on the Hill came in at 63 homes sold with a median price of just under $2M. Month over month that represented a 13% growth in sales volume and no measurable change in the median price.
On an annual basis October sales were up 26% over the same month in 2022. This year’s median price was up by 11% over last October.
While these numbers reflect impressive growth it’s important to remember that the number of transactions on the Palos Verdes peninsula is quite small, which results in some dramatic percentile shifts. For example, the annual percentage of change in the median price so far this year has ranged from a low of -29% to a high of 17%. By comparison, the Harbor area where monthly transactions number in the hundreds, has an annual range from a low of -11% to a high of 7%.
On a year to date basis, the Hill showed a more common face with the January through October sales volume down by 20% from 2022. During the same time frame median prices fell by 4%.
Inland Area Sales Volume Down, Prices Up
In a surprising turn of events, the Inland area has shown an increased median price for both the monthly and for the annual sales figures. The median price came in at $917K this October, which was 2% above the September median. On an annual basis, the median was up by 7% over the $860K of October 2022.
With 116 units sold for the month of October this year, the sales volume was 11% lower than it was this September. The monthly decline was even greater than the drop of 9% for the year over year comparison to last October.
Year to date, the Inland area has outperformed the balance of the South Bay on median price and on sales volume. For January through October there is no discernible change to the median price from 2022 to 2023. In the same time frame the sales dropped by 14%, the smallest decline of the local areas.
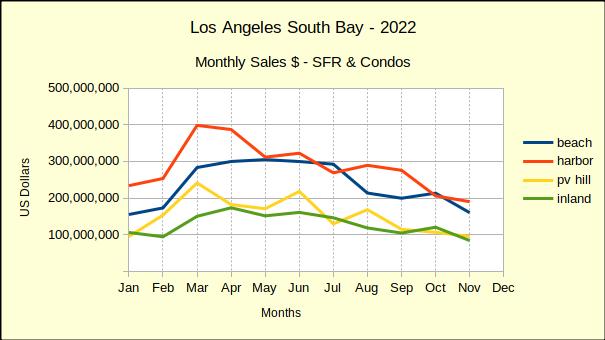
Beach=Manhattan Beach, Hermosa Beach, Redondo Beach, El Segundo
Harbor=Carson, Long Beach, San Pedro, Wilmington, Harbor City
PV Hill=Palos Verdes Estates, Rancho Palos Verdes, Rolling Hills, Rolling Hills Estates
Inland=Torrance, Lomita, Gardena
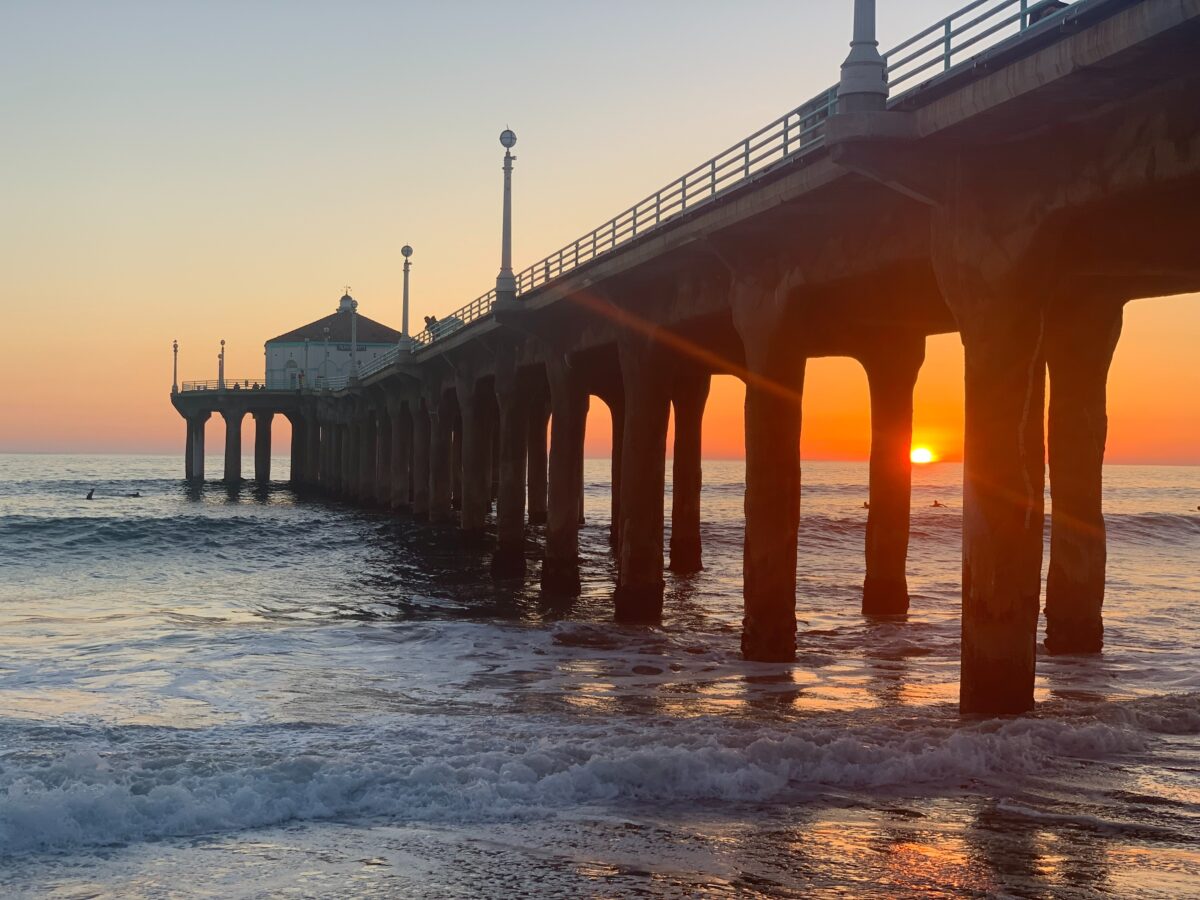
Photo by Julianne Takes Photos on Unsplash