Sales Volume Mixed, Down at Beach
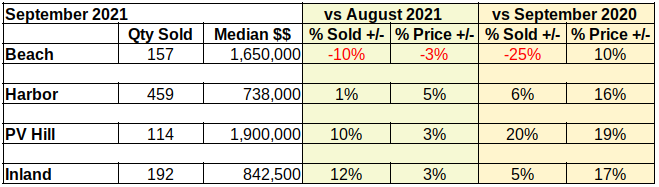
Compared to last month, overall sales increased slightly. The chart below shows that since March the number of units sold has remained relatively stable. Sales at the Beach were down 10% in September, while all other areas of the South
Bay registered increases.
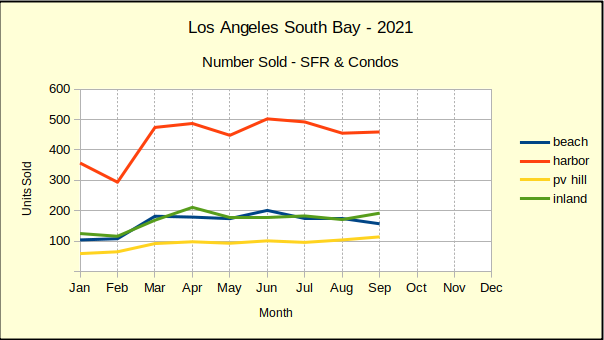
The number of Palos Verdes homes sold in September shows a strong 10% growth above August after remaining flat through the summer. That volume increase on the hill was over-shadowed by a 12% increase in the Inland cities. Sales volume in the Harbor area was nearly flat with only a 1% increase in activity.
Sales Prices Up in the Harbor
While the number of homes sold was low at the Harbor, median prices there increased the most of the South Bay. Harbor area prices in September were up 5% from the prior month. Prices on the PV peninsula rose by 3% as did prices in the Inland cities.
The Beach cities dropped into negative territory on pricing as well as volume. Median sold prices at the Beach were down 3% from August.
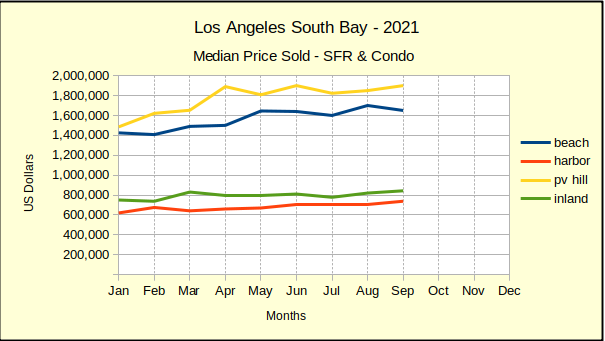
Looking back over the year, it’s interesting to note that the Inland and Harbor area home prices have remained close to level all year. Both areas have shown modest increases of about $100K, attained gradually over the year. By comparison, the median sales price in Palos Verdes jumped nearly $400K before levelling off in April. Similarly, median prices at the Beach climbed about $200K before stabilizing in May.
Area Sales Dollars Climbing in PV
Homes sales in the Palos Verdes cities increased in both sales volume and median price. Combined those increases catapulted the September sales dollars for peninsula properties upward by over $50M. This results from a trend we’ve been watching this year where median PV home prices are out-pacing Beach homes by $200K-$300K every month.
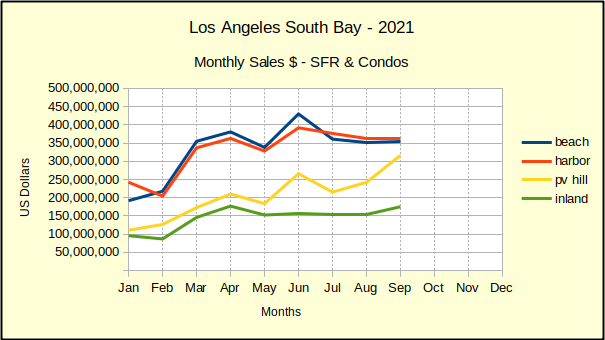
This is a change in the norm. In 2020, in the midst of the pandemic, median prices were close between homes sold at the Beach and those sold on the Peninsula. PV home prices were usually higher, but not always, and not by very much. In 2019, before the pandemic, PV and Beach median prices were nearly the same, with PV often having the higher number.
Statistics – by Month, by Year
We continue to ignore the comparison between the current month in 2021 versus the same month in 2020. The pandemic influenced statistics are too far from normal to show meaningful relationships. The current month versus last month is impacted also, though to a lesser extent. For example, monthly increases of 10%-19% in median price bespeak runaway inflation. Similarly, increases of 5% every month are not reasonable, nor are they sustainable.
We’ve had questions about median price versus average price–which is better and why. We use median, which is halfway between the highest and the lowest sale. Being at the exact midpoint tends to give a more accurate picture of the whole market, as opposed to an average, which can be more easily skewed by an abnormally high or low sale.
Pricing – The Highs and the Lows
It’s easy to fall into the trap of thinking that some neighborhoods are expensive and some are inexpensive. While that can be true of smaller geographic areas, most larger areas have a healthy amount of price variance in the available housing. Below we’ve included the highest and lowest rounded sale prices in the four broad areas we review.
Area
Beach
Harbor
Palos Verdes
Inland
Low Sale
$475K
$200K
$470K
$300K
High Sale
$16.5M
$2.6M
$9.0M
$2.3M
The prices shown are the extremes as recorded on TheMLS as of the third day of the month. We allow three days for agents, brokerages and the various multiple listing services to update records before we start our analysis.
One observation jumps off the page immediately. The variance in price is much more dramatic at the high end. The range among areas at the low end is from about $200K to $475K, a spread of $275K. Expressed in percentages, the high price is 237% above than the low.
At the upper end, the variance in price ranges from $2.3M to $16.5M, a spread of $14.2M. This time, expressed in percentages, the high price is 717% higher than the low.
So, what does $200K buy in the South Bay? This time it was a one bedroom, one bathroom “fixer” condo in downtown Long Beach. On the ground floor, with 580 square feet of space.
And $16.5M brings you six bedrooms, with seven bathrooms in 5715 square feet, a three car garage, a dedicated home theatre, and stunning ocean views from the Manhattan Strand.
Main Photo by Joseph Ngabo on Unsplash