A build-to-rent community is a community in which single-family homes are build solely for the purpose of renting them out. It isn’t a new concept, but it’s been under the radar for quite some time, comprising only 3% of the single-family residence (SFR) market. As just one of many changes in the type of demand brought in the wake of the pandemic, that number is now up to 12%.
Many people who transitioned to work-from-home needed more space for a home office. That meant looking for a larger home. For renters, that often wasn’t possible, since they were priced out of the homebuying market. But what if they could rent the type of home people normally would buy? In a build-to-rent community, they can. The SFRs in such communities have significantly more space than apartment units, and while they are certainly more expensive to rent than apartment units, rising home prices meant renters definitely couldn’t buy if they weren’t able to before. It’s definitely possible to find SFRs that are not in a build-to-rent community, but looking for such a community guarantees it, and also comes with community amenities.
According to a report from real estate brokerage Redfin, the share of home sales that were paid fully in cash reached 31.9% as of October 2022. This is the highest value since 2014. It’s been steadily increasing since April 2020 when it immediately plummeted down to 20.1% due to lockdowns, a record low. At the time, the general trend was downward, though the share of cash sales went up and down in cycles, and continues to do so. Now, the trendline is going back up.
There are actually a couple of different reasons for the shift, depending when you’re talking about. After the lockdowns, mortgage rates had a period of extreme lows, followed by extreme highs after federal intervention. Finally interest rates are starting to fall back down, but throughout all of this, the cash sale share was still trending generally upwards, albeit with some dips as usual. It’s not that mortgage rates don’t influence share of cash sales. They can actually influence it quite a bit, but at least since the pandemic, in the same direction for either extreme. In the first year since the pandemic, cash sale share shot up rapidly because low interest rates increased demand, which in turn increased the attractiveness of cash offers. Once interest rates skyrocketed during a time of already high prices, lower-income earners were effectively kicked out of the running entirely. This left wealthy buyers who, of course, didn’t want a high interest rate mortgage if they could avoid it, so they paid cash because they had the means to do so and it was the best financial decision for them.
The California Department of Insurance (CDI) has provided the latest update to their resources on the effect of wildfires on insurance. Statewide data on policy counts is now available for 2021, and county-level and zip code-level multi-year data has been updated to 2021, going back to 2015. You can also view archives of older statewide data up to 2015. In addition to policy counts, the CDI has compiled updated info on coverage limits, premiums, losses, and claims.
Also available are additional resources for those wanting to know their wildfire risk or looking for insurance. A report with a large amount of data, including but not limited to coverage amounts and losses for each zip code, is available for download under the “SB 824 Wildfire Risk Information” header of the CDI’s Rate Filings page. This data is from 2018-2019. There is also a list of insurance companies offering incentives for wildfire safety, last updated in November, as well as a searchable list of insurance companies and real estate agents that work with high-risk areas.
When the lockdowns hit, homeowners very quickly realized what their homes were lacking in terms of comfortably getting through the lockdown period. The result was a shift in which home features were most in demand. People began to favor more outdoor space so they weren’t stuck inside, home amenities, and variable living space, among other things. While the virus certainly hasn’t disappeared, lockdowns are no longer in effect, masks are no longer mandatory in most cases, and people are gathering together more. But the lockdown-era trend shifts continue to be apparent.
Backyards are a popular feature, with 22% of listings highlighting them. Patios and pools are also the focus of an increasing amount of marketing, with 13% of listings mentioning patios and 11% calling attention to the pool. Home gyms are also increasing in popularity. Of course, this doesn’t prove that buyers want more outdoor space and home amenities, but it does say that’s what agents think buyers are looking for. The same is true of multipurpose spaces. The ideal kitchen now includes a kitchen island, which has the flexibility to be used as a dining area, workspace, or entertainment table. It’s even extending to the way the home is organized — open-concept living had been popular for a while, but it’s now fallen out of favor as people realized they had no private or quiet spaces with everyone at home at the same time. The motivation for this shift is no longer present, but the experience seems to have changed peoples’ minds about open-concept living.
Home prices have begun their decline after a period of incredibly high prices. More regions of California are following suit. In October, 22 of the 51 tracked counties (California has 58 counties) recorded a decline in median sale price from the prior year. In November, this increased to 33 counties. Only two broad regions of California experienced price growth from the prior year, the Central Coast, with an increase of a mere 0.1%, and the Inland Empire, with a 2.1% increase. In all regions, prices are down from October to November. Prices are declining for both single-family residences and condos.
The largest changes from November 2021 to November 2022 occurred in Napa County, an increase of 29.4%, and Mariposa county, a decrease of 27.2%. The biggest positive and negative changes between October and November 2022 occurred in Tehama County, an increase of 10.8%, and Santa Barbara County, a decrease of 28.3%. Home prices are not the only thing declining. Home sales volume has also dropped precipitously since November 2021, decreasing in every single county except Mendocino County, which saw an increase of 4.5%. Mendocino is also one of the counties in which prices are still increasing. In most counties, the decrease in sales volume hovered around 40-50%, though some were higher or lower. The decrease reached as much as 68.9% in San Benito County, but was only 12.5% in Glenn County.
Unlike office spaces, the industrial sector wasn’t particularly negatively affected by the pandemic. People still needed warehouses and manufacturing sites, perhaps even more than before. Indeed, the vacancy rate actually started dropping since the lockdowns, the beginning of which was the peak point in recent years. In most areas of Southern California, the vacancy rate for industrial leases reached its lowest point in the first half of this year. Since then, vacancy rates are starting to edge back up, but are still far below the pre-pandemic peak.
In San Diego County, the industrial vacancy rate increased from 2.00% to 2.56% between Q2 of 2022 and Q3 of 2022. The peak was just above 5% in Q2 2020. In Los Angeles County, the increase was from 1.11% to 1.68%, with a peak of 3.17% at the start of the pandemic. Despite the Inland Empire’s very low vacancy rate of 0.88%, it’s actually higher than the Q1 and Q2 numbers. But it’s nothing compared to the pre-pandemic vacancy rate of 3.92%. Orange County is an exception — the industrial vacancy rate has actually continued to decrease, from 1.23% in Q2 2022 to 1.05% in Q3 2022. Its peak was also later, in Q3 2020, at which point it was 3.1%.
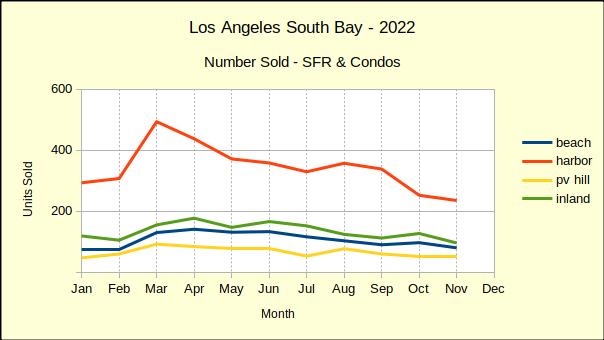
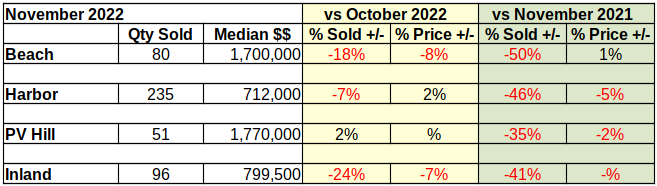
November saw the number of homes sold in the South Bay fall 12% from October totals. Sales volume has declined in seven of the eleven months on a month to month basis since the beginning of the year. Sales tipped up a modest 2% on Palos Verdes peninsula, while volume dropped 7% at the Harbor, 18% at the Beach and 24% in the Inland area.
Year over year sales look even more depressed with a 45% drop from 2021 sales across the South Bay. The Beach Cities led the plunge with a 50% fall, followed by the Harbor area at 46%. Palos Verdes and the Inland area brought up the rear with 35% and 41% respectively. The falloff in sales began with a 17% drop in January and has been increasingly negative since.
Because 2020 and 2021 were both significantly impacted by the coronavirus pandemic and the governmental response to it, 2019 is the most recent year with a normal business pattern. Comparing 2022 sales volume with 2019 provides the truest measure of the current recession. Overall, for the first 11 months of the year, the South Bay has experienced a 9% decline in sales compared to 2019.
Through the month of November, sales on the PV Hill have fared the best, showing a modest drop of 3% compared to the same time period in 2019. The Harbor and Inland areas which generally are entry level for the South Bay both fell back 8% for the same period. So far this year the Beach Area has suffered the largest declines with an 18% drop in number of sales versus 2019.
Annual Sales Dollars Off By $3.2 Billion
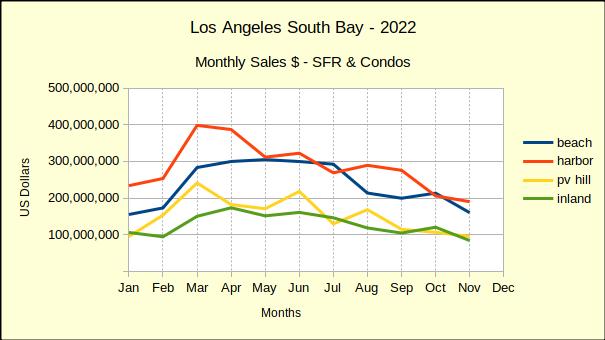
Comparing year-to-date sales of homes in the Los Angeles South Bay shows a drop in dollar value from 2021 to 2022 of over $3.2 billion. That represents an over-all decline of 22% in total dollars sold from the same 11-month period last year.
The Beach area has been the hardest hit so far with a drop of 34%. The PV Hill has dropped 29%, while the Harbor area has fallen 22%. The Inland area fared the best, only down 19% for the same 11 months.
On a month to month basis, the decline in sales accelerated from 7% in October to 18% in November. The Inland area which had flipped to a positive gain in October plummeted by 30% in November. Similarly the Beach which had been up 7% in October fell 25% in November. The Harbor and Hill areas were off by 8% and 11% respectively.
At this point year to date South Bay sales dollars for 2022 still exceed the total for 2019 by 22%. We expect the end of year numbers to be positive. However, with monthly sales figures shrinking by 30%-40%, we project 2023 to fall below 2019.
Median Price Shows Mixed Results
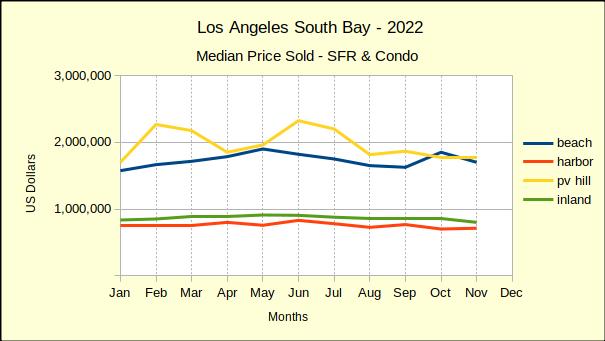
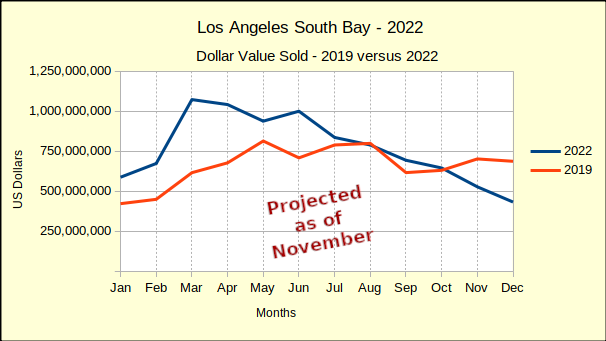
Statistically speaking, the Beach cities median price fell 8% from October to November. The reality is that the median in October was unusually high. Multiple sales of Strand property drove the median up 14% that month. The blue line on the chart below shows the one month blip and median prices dropping back to a steeper downward pace in November.
Palos Verdes was flat compared to the previous month. This is a rare event as one can see by the erratic yellow line on the chart. Because the physical area is smaller than the other geographical areas, the number of sales is smaller, and mathematically the sample size is smaller. Thus one or two outlier sales can create wide swings in the chart.
Similar to the Beach area, the median price dropped 7% in the Inland area. This decline follows two months of no change, preceded by three months of month over month negative median prices.
At the same time the Harbor area experienced a month to month increase of 2% in the median price. Researching this anomaly we discovered 11 new construction sales in Carson had been accumulated and posted simultaneously by the developer. It’s worth noting that Harbor area median prices have also been elevated to some extent by the new construction on Western Avenue in San Pedro.
From a year over year perspective, November median prices continued to fall in comparison to those of November 2021. The Harbor and PV Hill areas were down 5% and 2%, respectively. Median price in the Inland area dropped from positive 6% in October to negative .05% in November. The Beach cities remained positive with growth of 1% in November. That being in contrast to an unexpected growth of 20% last month caused by the sale of multiple Strand properties in Manhattan Beach.
Despite increasingly deep reductions in sales volume and in median price throughout this year, the median is still higher than it was in 2019. Palos Verdes home owners have fared the best with the current median price 40% above the November 2019 median. The Harbor area is still 34% higher and the Beach cities still maintain a 31% advantage. The Inland area has proven to be relatively stable throughout the pandemic and currently the median price is 27% above that of 2019 for the same 11 month period.
Year End Projection Updated
We’ve been comparing 2022 to 2019 all year because real estate sales during the height of the pandemic were so out of the ordinary, regular year over year comparisons yielded untenable results. The chart below depicts the current year total sales for the South Bay compared to sales from 2019.
Tracking the blue line, one can see where sales dropped below 2019 values in August, recovered in September, then slipped below again in October and November. Assuming the decline continues at the same rate, we are forecasting the December sales to drop another $75 million, or so.
The end of the year would then reflect accumulated sales of approximately $9.4 billion. That would mean 2022 total dollar sales come in at $1.4 billion above the $8 billion total dollar value sold in 2019. Across the South Bay that would be approximately an 18% increase.
Broken out by community, we forecast total dollars sold in the Beach cities to be 6% above 2019, followed by the Inland area with a 20% increase. Harbor comes in next with a 21% increase and the PV Hill with a 35% increase.
At a Glance
As 2022 draws to a close we find the final numbers for both sales volume and median price show the year to be rapidly declining from the final figures for 2021. However, the totals all remain positive. We expect December to continue the trend downward, though the year should end on a positive note.
With the number of units sold decreasing every month by 35% to 50%, and the median price now falling, 2023 should be firmly in the grip of the recession by mid-year.
Disclosures:
The areas are: Beach: comprises the cities of El Segundo, Manhattan Beach, Hermosa Beach and Redondo Beach; PV Hill: comprises the cities of Palos Verdes Estates, Rancho Palos Verdes, Rolling Hills and Rolling Hills Estates; Harbor: comprises the cities of San Pedro, Long Beach, Wilmington, Harbor City and Carson; Inland: comprises the cities of Torrance, Gardena and Lomita.
No matter where you live, there is a risk of natural disaster. The likelihood may be higher or lower, especially when comparing different types of disasters in different areas, but the possibility is always there. Since Realtor.com started displaying flood and wildfire risk data two years ago, they’ve been analyzing how prospective buyers use the information to make their homebuying decisions and how it affects prices.
Unsurprisingly, homes with lower risk of natural disaster tend to appreciate faster. Areas with low flood risk appreciate about 1.7% more quickly than areas with high flood risk, and this increased from 1.5% in the wake of flood disasters occurring in July-September 2021. Homebuyers also tend to have a preference for lower risk areas, despite the higher prices, showing awareness of natural disaster risk. The difference is even greater for wildfire risk at 3.7%, but there have been no significant shifts recorded in this value. However, buyers don’t show the same preference for areas with lower wildfire risk as they do for areas with lower flood risk. This could be because they’re more concerned about higher prices, possibility due to the difference being greater. However, there also isn’t a clear preference for cheaper, higher risk areas in some of the most wildfire prone states, such as California. It’s possible this is because homebuyers feel the risk is relatively high regardless of where they are living in California, or because risk and price point are both of relatively equal concern.
The Trust for Public Land has released their 2022 Parkscore Index, which compiles data regarding public outdoor spaces for the 100 largest US cities. It also includes some private parks and playgrounds if they have a joint-use agreement with the city. The criteria also don’t exclude public spaces that may not necessarily be strictly parks, such as trails or other open spaces. However, it does only count the 100 cities with the highest population — there are over 100,000 cities in the US, so it’s a small minority.
Portland Real Estate has taken this data and provided a list of the top 11 cities for public outdoor space, sorted by overall score. The categories include median park size, percent of city that is parkland, and percent of residents within a 10-minute walk to a park, among other factors. Of course, Portland Real Estate couldn’t have made it a top 10 list since they had to include their own city, Portland, OR, which is #11 on the list with a score of 74.5 out of 100. The highest score belongs to Washington, D.C. at 84.9. In order from #2 to #10 are St. Paul, MN; Arlington, VA; Cincinnati, OH; Minneapolis, MN; Chicago, IL; San Francisco, CA; Irvine, CA; Seattle, WA; and New York, NY.
Buying a home is a major life decision. Because of this, it’s important that prospective homebuyers take the time to research the best option for them. Unfortunately, that tends not to happen with mortgage loans. Only about 13% of prospective buyers spend at least a month researching lenders. By contrast, 28% spend just as much time researching cars, and 23% vacation options.
One major reason is that they’re simply not well informed. 30% of prospective buyers believe that their credit score will take a major hit if they shop around, the most common reason cited for not shopping around. This is not accurate, as it’s only getting a pre-approval that reduces your credit score, not consulting with lenders. You can submit as many applications as you want within a 45 day period and your credit score will only drop once. 15% also believe that all lenders use the exact same rate, so there’s no reason to get a second quote, which is definitely not the case.
It may be odd to think of getting a discount on a home. It’s not as though they have flash sales or seasonal specials, like you might find in a department store or supermarket. But price cuts do happen, and that’s kind of like a discount. And they’re actually not all that difficult to predict — there are fairly regular patterns as to when price cuts occur.
Most notably, home sales actually do have something a bit like seasonal specials. Price cuts are most common between the months of July and September, which roughly corresponds to the latter half of summer. By contrast, price cuts are significantly less common during the winter. You probably won’t see a price cut within the first three to four weeks of listing, either. It’s possible to fine-tune your timing some more, though. Price cuts are rare during the weekends, particularly Saturday, and are less common on Friday than other weekdays. Nationwide, the top day for price cuts is Thursday, though it’s not that much different from Monday, Tuesday, or Wednesday, and it definitely varies by region. The question remains, how much of a discount can you actually get? Currently, around 3%, but it has varied between 2.6% and 3.8% in the past few years.
Many people have delayed their homebuying search, and those that remain are looking for something cheaper. That often means looking outside their current metro, especially for those living in expensive areas, such as San Francisco and Los Angeles.
But expensive areas frequently have at least one thing in common — sunny weather. Those that are used to this type of weather are often reluctant to compromise, so they’re looking for equally sunny but much less expensive areas. The number one match is Sacramento. It’s within sunny California, but not near the coast and has much less suburban sprawl than Los Angeles, both making it a cheaper area. San Diego is also a common destination for Californians.
But the state with the greatest number of matching metros is not California, but Florida. Miami, Tampa, Cape Coral, and North Port-Sarasota are all in the top 10 destinations to move to. The remaining cities in the top 10 are Las Vegas, Nevada; Phoenix, Arizona; Dallas, Texas; and Portland, Maine.
Primarily due to financial concerns, homebuyers have been delaying attempting to purchase their first home, with 89% of homebuyers waiting for a better time. That started to change at the beginning of this fall. On average, first-time homebuyers submitted about 12 offers on properties in late September. This is up from 10 last year.
Not only are they submitting more offers, they’re actually looking at more properties, as well. In 2021, prospective buyers looked at an average of 15 properties before deciding if and where they would submit offers. That number jumped up to 24 this year. Combined with the average number of offers submitted, it means they’re submitting offers on 50% of properties viewed, versus 67% in 2021. While the reasons for this could certainly vary from person to person, being more selective in their choices probably means either there are more options within their budget, or they’re more comfortable being patient and don’t feel rushed. The latter is a real possibility, since high prices are indicative of lower demand and therefore less competition.
The goal of the Fed’s decision to increase the benchmark rate was to ultimately lower prices. That is now beginning to happen, but many other things have been affected in the meantime. One is builder confidence. As can be expected, rising interest rates are causing lower demand for buyers, including new construction buyers. That means builders are getting less business. This is not a good sign in an environment that many believe is best solved through increased construction.
The Fed’s decision may be starting to solve one issue, but is it actually the optimal solution? Could something else have been done? Maybe, maybe not. According to the National Association of Home Builders (NAHB), the Housing Market Index (HMI), of which builder confidence is one component, was actually already below 50, which is the midpoint indicating neutral confidence. This is despite multiple laws making construction easier, especially for affordable housing. HMI dropped 5 points from 38 to 33 between October and November. Back in November of 2021, it was at 83. The builder confidence score in particular dropped six points from 45 in October to 39 in November. Though the problem is national, with decreases in every region, different regions have different levels of builder sentiment. The South dropped the most, by seven points, but still has the highest builder sentiment of any region at 42. Builder sentiment is by far the lowest in the West, at 29, despite only dropping five points. The smallest change was in the Midwest, dropping merely two points from 40 to 38.
The personal savings rate tends to hover around 8-10% during normal economic conditions, though it fluctuates constantly. These fluctuations tend to be inversely proportional to consumer confidence. If people think they can buy, they will. If they are hesitant, they will save their money instead. Across the last several decades, the record low was 2%, at the height of the Millennium Boom in 2005 when consumers felt they were in a stable economic position. By contrast, it hit a whopping 34% in April of 2020, just after pandemic stimulus payments began, most of which went directly to savings.
Now, the rate has dropped precipitously down to 3.8%. Unfortunately, that can’t be attributed to the inverse relationship with consumer confidence. Instead, the rate has dropped purely out of necessity. People aren’t saving money because they simply aren’t able to. The cost of living, proportional to wages, is incredibly high. Home and rent prices as well have accelerated at a rate far exceeding wage growth. The widening of the gap between cost of living increase and wage growth has been going on steadily for quite some time, but it’s more noticeable now with recent sharp increases in home and rent prices.
Despite all the uncertainty and chaos of fluctuating home prices, it’s possible to establish some trends. One such trend is the historical norm, which is the mean value of homes in a normal economy. It’s important to note that the historical norm is not a single value but rather a steadily increasing trendline, and is not a prediction itself, but can be used to form predictions. But it’s not increasing because home prices have been increasing — it’s actually based on homebuyer annual income, in other words, the annual earnings of people who are able and willing to purchase a home.
Boom and bust cycles affect the prices of homes, but not their long-term value according to the historical norm. This makes it significantly easier to tell when home prices seem too high or too low, and can be used to predict major economic events. The historical norm does suggest that home prices will continually increase, but what a 200% price-to-value ratio means is that prices are 200% of what they should be, even after accounting for this upward trend. It does not mean they have doubled from some prior value, rather from a hypothetical expected value. The last time the price-to-value ratio reached these numbers is in the mid-2000s, shortly before the crash of 2008-2009.
Construction has had multiple ups and downs in recent years as a result of the pandemic and surrounding economic factors. Throughout it all, multi-family construction has actually done pretty well. In fact, it’s currently at its highest rate in the last fifty years in terms of total number of new multi-family constructions. Unfortunately, that doesn’t mean it’s high — construction has been in a slump for the past thirty years, and meanwhile the population has been increasing.
Los Angeles has it the worst of any US metro, underproducing by about 400,000 homes. This is despite the fact that it’s also one of the top metros for multi-family construction. In large part, this can be attributed to the fact that it is the second most populated metro in the US. But the real issue is restrictive zoning laws, which are only recently being changed in California. The vast majority of homes in the Los Angeles metro are single-family residences because that’s what the lot’s zoning allows.
After the pandemic forced many employees to work remotely, it was initially unclear how long the remote work trend would last. Some thought everyone would return to the office after the pandemic was over. Some saw that remote work was actually working surprisingly well, and expected fully remote jobs to rise in popularity. The latter has definitely happened, however, employers’ attempts at a gradual return to office work have caused another trend to emerge: the hybrid work model.
It turns out an office has benefits and so does remote work. And this is true regardless of an individual’s preference, if they had to choose just one. So why not get the best of both worlds, and just go into the office sometimes? This will be great for workers — though not for owners of office buildings. Those who held onto the office space they owned may have expected a full return to office work, which would result in a return to normalcy for the office building market. What is happening in reality is a gradual reduction in office space. Office space isn’t being eliminated completely, since it’s required for a hybrid work model. But companies won’t need nearly as much office space, and are already making plans to repurpose the space they already have.
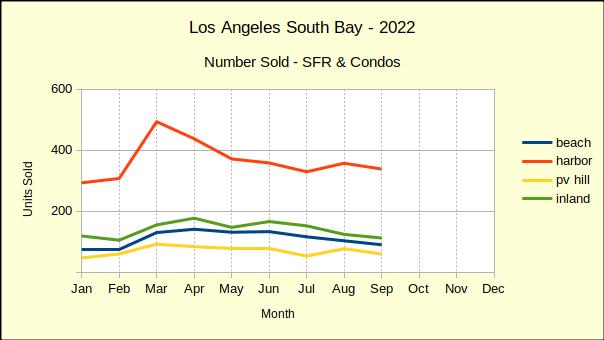
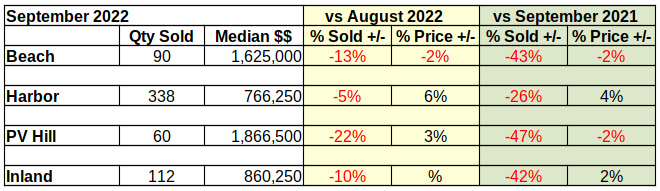
Last year saw home sales in the South Bay escalate dramatically as buyers sought to become homeowners while interest rates were still abnormally low. With interest rates rapidly rising it’s no surprise that sales are plummetting in 2022. The Harbor area, traditionally an entry level market, handily out-sold the balance of the South Bay with a drop of only 26%. The remaining areas suffered sales drops ranging from 42% to 47%, with the South Bay as a whole dropping 35%.
Compared to last year, cumulative South Bay home sales were down 21% as of September. The first three quarters of 2021 saw 7767 townhomes and single family residences sold, versus 6163 during the same period this year.
Recognizing that 2020 and 2021 were exceptionally aberrant, we also compared the 2022 year-to-date sales volume to 2019, the last normal year of business prior to the pandemic. As of the end of September 2022 cumulative sales volume was 4% lower than it was for the first nine months of 2019.
The decline from 2019 sales is uneven in that the biggest drop, 15%, is seen in the Beach area, which is typically at the high end of the market. Sales in the Harbor area only dropped back by 2%, while sales in the Inland area fell by 4%. The Palos Verdes peninsula fared best, actually increasing in quantity sold over 2019 by 4%. As always we offer a cautionary note when looking at statistics for property on the PV Hill. Because there are considerably fewer homes in that area, percentile statistics can take large swings.
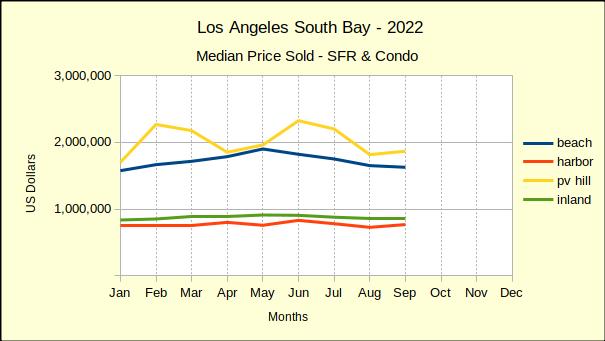
Median Prices Mixed in September
The number of homes sold in 2022 has declined, indirectly affecting the median price of those homes, as well as the total dollar value of all the homes sold in the same period. A closer look at the median price of homes sold through September yields some surprising changes.
Since prices increased dramatically during the coronavirus pandemic we anticipated finding the median price from 2022 to be considerably higher than that of 2019. Indeed, that is the case with the median in the Beach area up 31% over that of 2019, the Harbor up 36%, PV Hill homes up a staggering 47% and the Inland area up 30%. But, that is gradually reversing.
July and August of this year showed depreciation in the median price across the South Bay. Prices consistently dropped in a range from 2% down (Inland) to 18% down on PV Hill. September sales broke the pattern with only the Beach cities losing value per the median. The Inland area was flat, showing no change from August. In an unexpected twist, both the Harbor area and the Hill came in with an increase in the median price. The growth was modest, up 6% for the Harbor area and up 3% for the Hill. Despite the slight improvement in September prices we anticipate continued downward pressure as inventory grows and time on market stretches.
Looking at the median price on a year-over-year basis, we find September with minor declines from August. The Palos Verdes cities showed prices dropping by 2% last month and this month. At the same time the Beach cities dropped 2%, while the Harbor and Inland areas increased by 4% and 2% respectively.
Median prices started 2022 with increases regularly coming in well above 10% growth. In April we saw the first negative where the median for the Hill fell 2% from 2021. Since then we have watched the rate of price appreciation decline from double digits until now in September with both the Beach and PV areas losing value.
We fully expect all areas of the South Bay to reflect declining median prices before the end of the year. While prices will be down on both a month-to-month and year-to-year basis, we don’t anticipate the median to fall below 2019 price points this year.
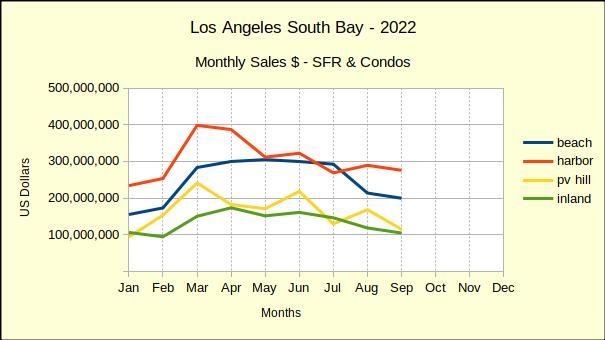
Total South Bay Sales Dollars
When the number of sales is decreasing and the median price of those sales is also decreasing, one has to assume the gross revenue will also decrease. Governor Newsome has been warning for several weeks that the 2022-23 fiscal year will not see the State level revenue surpluses California has been enjoying.
During the first quarter of 2022 gross revenue from real estate sales remained predominately positive, with year-over-year growth rates of about 6% per month. Since March the South Bay has only seen two instances of sales growth, 7% in the Harbor area for April and 3% in the Inland area for June. Every other entry on the chart is negative, with September declines averaging about 40%.
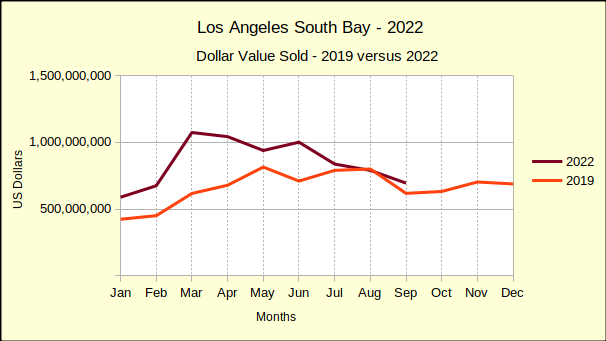
Cumulative sales for the first three quarters of 2022 were off by 29% compared to 2021. Our monthly sales dollars chart shows a zig-zag downward trend since spring of this year. Of course, 2019 is a more realistic point of comparison as a result of market gyrations created by the pandemic and our government’s fiscal response.
Comparing 2022 sales totals to 2019 yields a clearer picture of the current direction of the market. Instead of a sea of red ink, we can clearly see that 2022 sales have remained above those of 2019 with the exception of August. Sales started normally, then in March the Federal Reserve Bank announced a .25% interest rate hike, and promised more to come.
Buyers threatened with increasing monthly payments jumped into the fray and pumped sales up for a couple months. Then a new .5% increase, accompanied with the promise of multiple .75% increases throughout the year began a downward slide in home sales that is continuing.
Following the trajectory of the maroon line, and assuming the interest rates continue to increase, we predict 2022 sales will drop below 2019 again in October. The Federal Reserve Bank has already announced plans for another .75% increase in November, followed by a .5% increase in December. Adding another 1.25% will bring the full increase for the year to 4%. We envision the fall in sales growing steeper, bringing total sales below that of 2019 for the final quarter of the year.
Statistical Summary
This would be the heart of the discussion if we were dealing with a normal fiscal environment. Here we could talk about month-to-month changes and changes from the same month last year to this year. Instead we’re faced with an unanticipated side effect of the pandemic—out-of-control inflation followed by a steep recession.
The areas are: Beach: comprises the cities of El Segundo, Manhattan Beach, Hermosa Beach and Redondo Beach; PV Hill: comprises the cities of Palos Verdes Estates, Rancho Palos Verdes, Rolling Hills and Rolling Hills Estates; Harbor: comprises the cities of San Pedro, Long Beach, Wilmington, Harbor City and Carson; Inland: comprises the cities of Torrance, Gardena and Lomita.
Goodbye Marymount, Hello UCLA!
Marymount California University, is no more. But, shed no tears! The prestigious University of California at Los Angeles plans to open the site for classes in the fall of 2023-24. Escrow had not yet closed as of this writing, but all appears to be moving forward at good speed.
We are told the finalists included four developers and three educational institutions. We’re pleased that UCLA was the successful bidder. We’ve heard some of their ideas and look forward to having them as neighbors.
However, we’re also interested in what kind of potential the developers saw in this deal. There’s a total of 11 acres already developed as residential and 24.5 acres developed as a campus. What would that have looked like if a residential developer purchased the site?
The 24.5 acres, some of it with gorgeous ocean views, is the jewel in the transaction. A little “back of the envelope” calculation says that using an average of 15,000 square feet per lot, Which is about the average in that neighborhood, one could build about 70 high end homes at the location. New construction on similar sites is selling for about $7.5M today, giving a value for the finished project of approximately $525M. Not bad for a land purchase of $80M, especially considering we haven’t started looking at the 11 acres.
There exist some legal complications in the 86 unit, 11 acre property. Deed restrictions purported to require the land to be used to house students. That can readily be accommodated by an educational institution, like UCLA. Developers on the other hand might have to pay some serious legal costs to do anything else with the land.
And it might have been worth the legal expense. A quick look at the apartment building market in the South Bay shows roughly comparable buildings selling for about $420K per unit. That would make 86 units worth about $36M, almost half the stated purchase price.
We’ll never know what might have been. The entire South Bay can look forward though, to an educational revival. A refreshed campus with UCLA’s academic resources and access to the university program at AltaSea and other port projects is a great starting ground.
It’s long been suggested that one should put down at least 20% of the purchase price as down payment. While this is probably a good idea if you can afford it, many people have taken this advice a bit too much to heart, and are reluctant to try to buy with a lower down payment amount. A third of homebuyers even think it’s a requirement to get a loan.
In reality, most loans have a much lower minimum down payment, with one of the most common types — FHA loans — having a minimum of just 3.5%. Some even have no minimum. In addition, the median down payment is significantly less than 20% for first-time homebuyers at 7%. It’s higher for repeat buyers at 17%, but that’s still under 20%. What’s more, there’s a good chance you can get homebuyer assistance to help cover the down payment. While a majority of homebuyer assistance programs are specific to first-time homebuyers, over a third of the approximately two thousand programs do not have this restriction.