We monitor local South Bay real estate activity daily. The data is charted to show the direction of the market in terms of tendency to favor Sellers versus Buyers. Ideal market conditions are in the the center band where both have roughly equal market strength. As you can see, South Bay activity was right down the middle for July. The daily market trend has been more or less level since the beginning of the year, with only a slight upward movement each month.
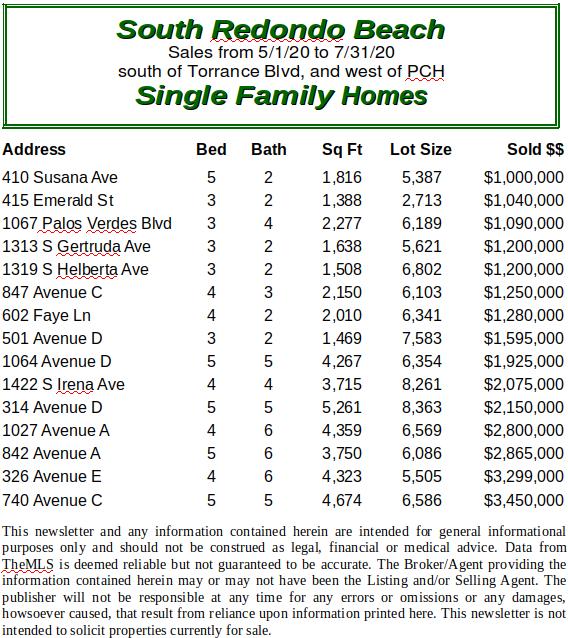
Cumulatively, since the beginning of the year, the market has shifted from almost being a Buyers’ Market to being almost dead center on the chart. What that means in terms of value can be seen by looking at the most recent three months sales. The list below represents only houses, and only those sold in two neighborhoods. If you’re interested in real time information about homes like yours, or near yours, call and ask about our Neighborhood Notice service.