Faced with the Covid-19 pandemic, a particularly contentious national election, and weeks of nation-wide civil rights protests, It looked like there was no way 2020 could ever be called a normal year. Then we learned about a growing recession. So halfway through the year, what do we see?
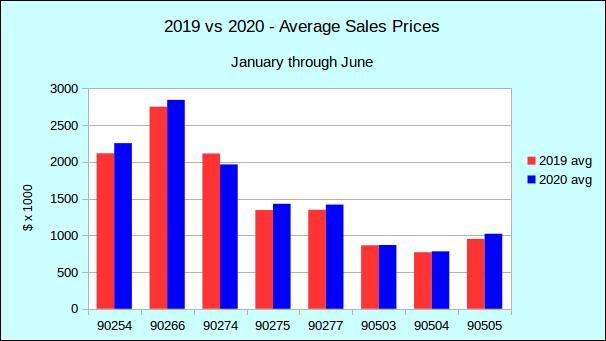
Prices – Up and Down
The South Bay is a nice place to live. Here, the real estate market is frequently shielded from the vagaries of the nation at large. And it’s no different this year. In this chart we compare the average sales prices during the first six months of 2019 versus 2020, by zip code. In nearly all cases the average property price is still going up. Torrance was very nearly flat and 90274 actually dropped slightly. (If your zip code or city is not included here, and you would like statistics, give us a call.)
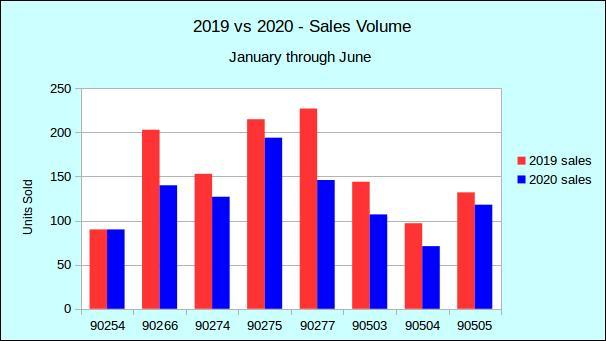
Volume – Mostly down
With prices are still climbing, albeit slower than they were, what about sales volume. Here we see some negative impact. Hermosa Beach is the only local city not experiencing a drop off in sales. In Manhattan Beach, for example, sales are off by 38% for the first six months of this year. South Redondo is off by 35%. Torrance and the peninsula cities are all down by roughly 5-10% from the number of homes sold in the same period of 2019.
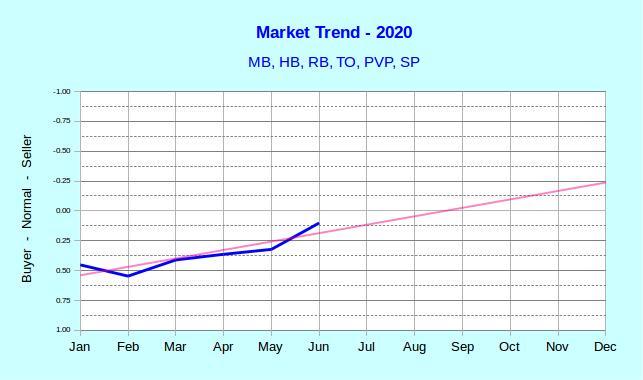
My Crystal Ball
Our Market Trend chart is designed to show whether market conditions generally favorable for sellers or buyers. The year started as a buyers’ market and moved even further toward buyers in February. Since then we have been seeing a slow, but steady movement toward a sellers’ market. Things could change dramatically before the year is out, but right now the red trend line indicates the probability the South Bay will be in a sellers’ market before the end of 2020.