
Covid-19 has kept the South Bay real estate market in disarray for a solid year now. So when we try to compare sales activity from 2020 to 2021 we find huge swings in the data that only tell us we’ve been living in a pandemic. We’re here to try to tease some intelligence out of that data and to guide our clients through buying and selling in these tempestuous times.
Month to Month
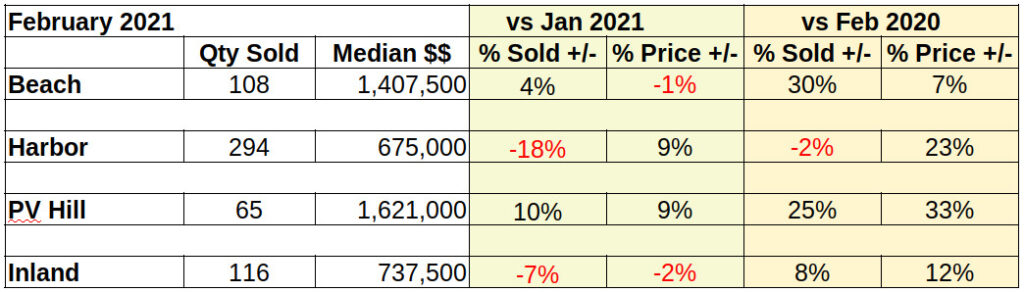
Let’s start by looking at the number of homes sold in the South Bay for February 2021. At the macro level sales volume is down -10% below January. Of course, that ignores the fact the number of sales last month (January) was down -30% compared to December, the prior month.
That’s the macro level. We start to see the range in sales volume when we step down to an area level. Looking more closely, the number of homes closing escrow in February versus January sales ranged from a decline of -18% in the Harbor area to an increase of 10% on the Palos Verdes peninsula. Comparing sales volume for the first two months of the year very much demonstrated the old maxim about the importance of location .
February against January for median price: Dollar-wise, the Beach dropped again, but by only 1% of the median price paid in January. However, note that this follows a 12% monthly drop in January from December 2020. From that scenario we can’t tell if prices are heading up, or still coming down. In other areas, the prices increased a robust 9% each for the Harbor and PV areas. Inland cities were down by -2%.
In total dollar sales, the South Bay was off by -1% from January activity. Once again, the detail was scattered with the high at 14% for Palos Verdes and the low -16% for the Harbor.
Compared to pre-Covid, these numbers are simply freakish.
Outrageously high! Compared to pre-Covid, these numbers are simply freakish. Back in 2019 any of the percentage statistics we look at on a monthly basis would have been in the range of +/-1%, occasionally a tad more. So, instead of Harbor area prices going up 9% in a month, we would normally be talking about .9%, one tenth the amount of increase.
Year to Year
Clearly the pent up demand from the past 12 months has had some impact. That, combined with the limited supply because so few people want to move during the pandemic. There’s always the question of what percentage of the buyers are home owners as opposed to investors. From speaking to other brokers in the area, we find a large number of the transactions are all cash.”
As always, one should note that ultra-local sales numbers are small in terms of mathematical models. As such, a single sale, high or low dollar, may make percentile statistics jump into outlier ranges. Similarly, a seasonal burst, or dearth of sales can seriously skew the numbers. Based on 25+ years of local real estate experience, I can assure you this is closer to a bubble than to a season burst.
Looking at it on a year over year basis doesn’t improve the image. Still the increases in every corner of South Bay, both in the number of sales and the median price increases, are beyond rational.
Photo by Karlis Reimanis on Unsplash